Automated Responsive Thematic Mapping with Layout Guides
Pith reviewed 2026-06-27 07:45 UTC · model grok-4.3
The pith
An algorithmic framework computes responsive thematic maps that adapt to different display sizes using layout guides.
A machine-rendered reading of the paper's core claim, the machinery that carries it, and where it could break.
Core claim
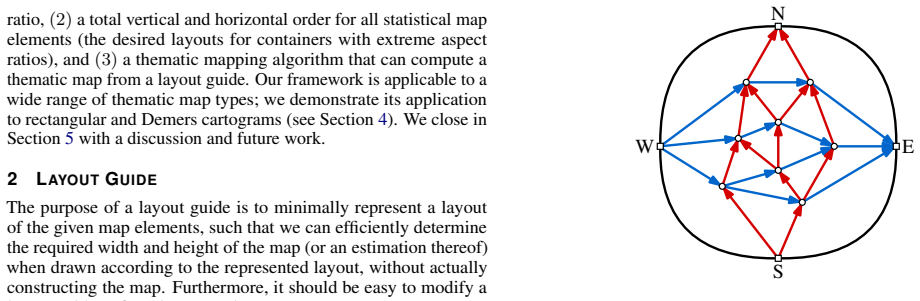
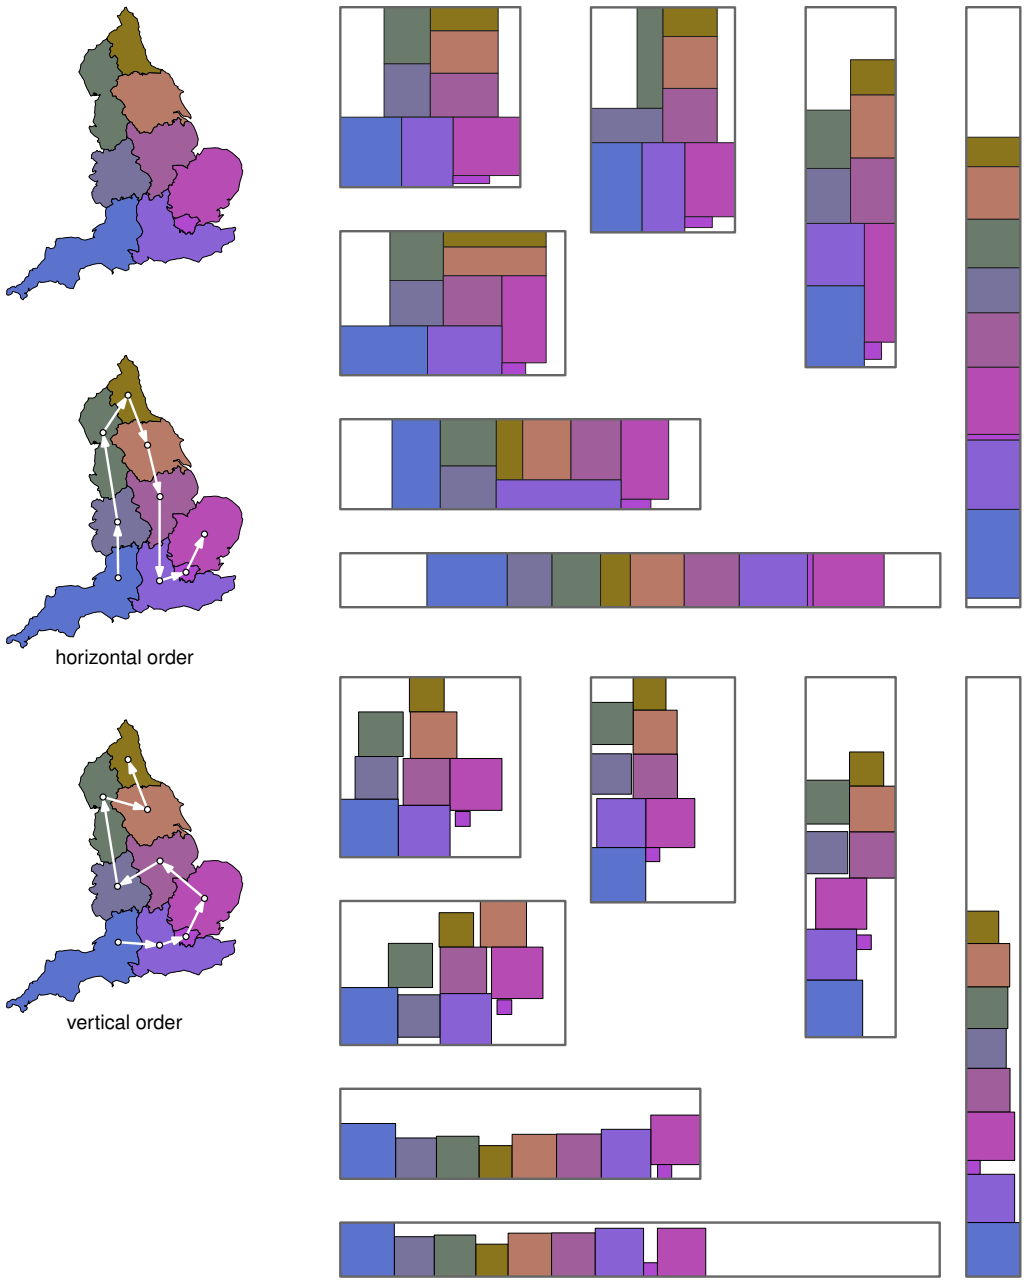
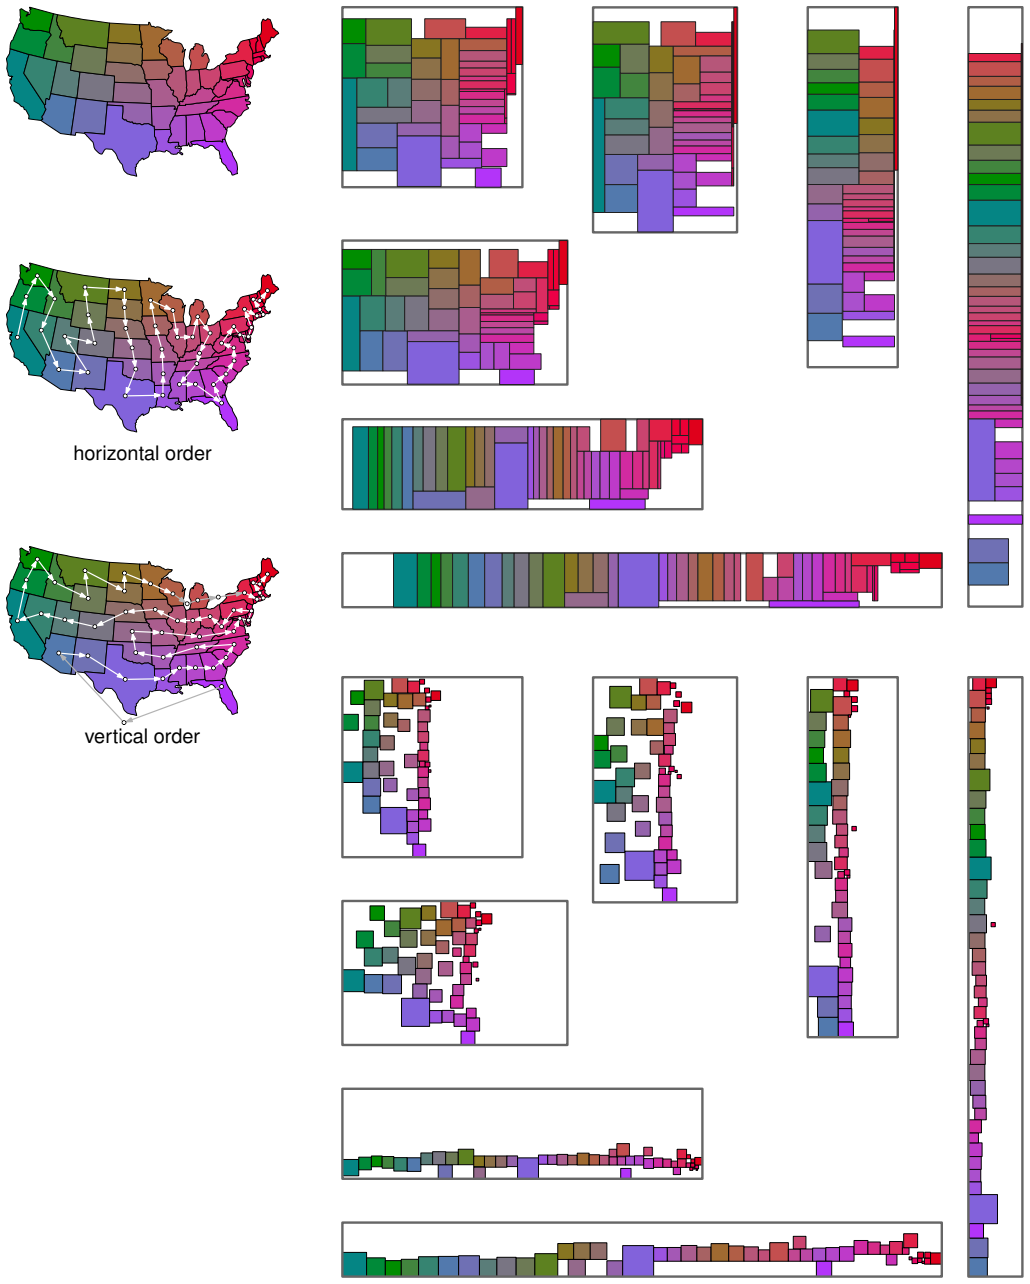
The central claim is the introduction of the first algorithmic framework to efficiently compute responsive thematic maps. A layout guide serves as the key combinatorial structure encoding the visual requirements of each statistical map element and the cartographic context via relative positions. The map arranger takes a visual container as input and returns a suitable layout guide in a stable and consistent manner. The framework requires three ingredients: a reference layout corresponding to the ideal map, total vertical and horizontal orders for map elements at extreme aspect ratios, and a thematic mapping algorithm that constructs the map from the guide. The approach is shown on rectangula
What carries the argument
The layout guide, a combinatorial structure that encodes desired widths and heights of map elements together with their relative positions; the map arranger algorithm generates this structure consistently from any visual container input.
If this is right
- Responsive thematic maps can be generated automatically without manual redesign for each display size.
- The same reference layout and extreme-ratio orders suffice to cover a continuous range of container sizes.
- Layout guide creation is separated from the thematic mapping step, allowing reuse with different mapping algorithms.
- The framework applies to both rectangular cartograms and Demers cartograms.
Where Pith is reading between the lines
- Map makers could maintain one set of reference data and orders to produce usable maps across phones, tablets, and desktop displays.
- The stability property would reduce visual jumps during live resizing of a map view.
- The separation of concerns might allow the layout guide idea to apply to other responsive visualization tasks beyond thematic maps.
Load-bearing premise
The map arranger algorithm can produce a suitable layout guide from any visual container input in a stable and consistent manner.
What would settle it
An input sequence of gradually changing visual containers where the resulting layout guides change abruptly or inconsistently, or where repeated runs on identical containers yield different guides.
Figures


read the original abstract
Thematic maps visually communicate statistical information about spatial units such as countries or states. They must balance the individual readability of those map elements that carry the statistical information and the overall cartographic context. Nowadays, most maps are not static images, but must flexibly respond to a range of device types and display sizes. Current approaches to responsive thematic mapping are limited: they are labor-intensive for practitioners and often rely on combining disjointed visual encodings to cover different device types. In this paper we introduce the first algorithmic framework to efficiently compute responsive thematic maps that smoothly adapt to different display sizes. A key component of our framework is the layout guide: a combinatorial structure which encodes the two essential aspects of a thematic map. The first aspect are the visual requirements of each statistical map element (at least their desired width and height), the second aspect is the cartographic context in the form of relative positions of map elements. Our main algorithmic contribution is the map arranger which takes a visual container as input and returns a suitable layout guide. The map arranger does so in a stable and consistent manner: if the container changes only a little, then so does the layout guide, and the same input container always results in the same layout guide. To use our framework, one needs three ingredients: $(1)$ a reference layout, which corresponds to the ``ideal'' thematic map, $(2)$ a total vertical and horizontal order for all map elements (the desired layouts for containers with extreme aspect ratios), and $(3)$ a thematic mapping algorithm that can construct a thematic map from a layout guide. We demonstrate our framework on two types of thematic maps, namely rectangular and Demers cartograms.
Editorial analysis
A structured set of objections, weighed in public.
Referee Report
Summary. The paper claims to introduce the first algorithmic framework for efficiently computing responsive thematic maps that adapt smoothly to varying display sizes. It defines a layout guide as a combinatorial structure encoding per-element visual requirements (e.g., desired width and height) and relative positions. The core contribution is the map arranger algorithm, which computes a layout guide from a visual container input while guaranteeing stability (small input changes yield small output changes) and consistency (deterministic output). The framework additionally requires a reference layout, extremal total orders on map elements, and any thematic mapping routine that accepts the guide; it is demonstrated on rectangular cartograms and Demers cartograms.
Significance. If the algorithmic claims and stability/consistency guarantees hold with efficient implementations, the work could provide a principled, automated alternative to manual responsive map design, which is currently labor-intensive. The combinatorial formulation of layout guides and the separation into arranger plus thematic mapper offer a reusable structure that might generalize beyond the two demonstrated cartogram types. The emphasis on stability addresses a practical requirement for digital cartography across devices.
major comments (2)
- The manuscript provides no algorithm description, pseudocode, complexity analysis, or proof of the stability and consistency properties for the map arranger (the central technical claim). Without these, it is impossible to verify whether the claimed guarantees are achieved or to assess efficiency.
- No validation data, error analysis, or comparison against existing responsive-mapping techniques are presented, leaving the practical utility of the framework untested.
Simulated Author's Rebuttal
We thank the referee for their detailed review and constructive comments on our manuscript. We address each of the major comments below and outline the revisions we plan to make.
read point-by-point responses
-
Referee: The manuscript provides no algorithm description, pseudocode, complexity analysis, or proof of the stability and consistency properties for the map arranger (the central technical claim). Without these, it is impossible to verify whether the claimed guarantees are achieved or to assess efficiency.
Authors: We agree that the manuscript as submitted does not include a detailed algorithmic description, pseudocode, complexity analysis, or formal proofs for the stability and consistency properties of the map arranger. These are indeed central to the contribution and their absence makes verification difficult. In the revised manuscript, we will provide a complete description of the map arranger algorithm, including pseudocode, an analysis of its computational complexity, and proofs establishing the stability and consistency guarantees. revision: yes
-
Referee: No validation data, error analysis, or comparison against existing responsive-mapping techniques are presented, leaving the practical utility of the framework untested.
Authors: The current version of the manuscript focuses on introducing the framework and demonstrating it on two cartogram types but lacks quantitative validation, error analysis, and comparisons to prior responsive mapping methods. We acknowledge this limitation and will enhance the paper with experimental evaluations, including tests for stability under varying container sizes, error metrics for layout quality, and comparisons against manual or alternative automated approaches where applicable. revision: yes
Circularity Check
No significant circularity; new algorithmic framework is self-contained
full rationale
The paper defines a layout guide as a combinatorial structure encoding visual requirements and relative positions, then presents the map arranger as an algorithm that computes such a guide from a visual container while enforcing stability and consistency. These properties are stated as the central algorithmic result rather than derived from or fitted to the outputs themselves. The framework requires three external ingredients (reference layout, extremal total orders, and a separate thematic mapping routine) that are not constructed from the arranger's results. No self-definitional loops, fitted inputs renamed as predictions, or load-bearing self-citations appear in the derivation chain. The contribution is framed as an independent algorithmic method relying on standard inputs, making the derivation self-contained against external benchmarks.
Axiom & Free-Parameter Ledger
invented entities (1)
-
layout guide
no independent evidence
Reference graph
Works this paper leans on
-
[1]
K. Andrews. Responsive Visualisation. InCHI 2018 Workshop on Data Visualization on Mobile Devices, p. 6, Apr. 2018. 2
2018
-
[2]
K. Andrews, D. Egger, and P. Oberrauner. RespVis: A D3 Extension for Responsive SVG Charts. In2023 27th International Conference Information Visualisation (IV), pp. 19–22, July 2023. doi: 10.1109/ IV60283.2023.000141
arXiv 2023
-
[3]
T. Biedl, G. Kant, and M. Kaufmann. On Triangulating Planar Graphs under the Four-Connectivity Constraint.Algorithmica, 19(4):427–446, Dec. 1997. doi:10.1007/PL000091823, 4
-
[4]
R. G. Cano, K. Buchin, T. Castermans, A. Pieterse, W. Sonke, and B. Speckmann. Mosaic Drawings and Cartograms.Com- puter Graphics Forum, 34(3):361–370, July 2015. _eprint: https://onlinelibrary.wiley.com/doi/pdf/10.1111/cgf.12648. doi: 10. 1111/cgf.126489
-
[5]
F. Chevalier, P. Dragicevic, and S. Franconeri. The Not-so-Staggering Effect of Staggered Animated Transitions on Visual Tracking.IEEE Transactions on Visualization and Computer Graphics, 20(12):2241– 2250, Dec. 2014. doi:10.1109/TVCG.2014.23464249
-
[6]
B. D. Dent, J. Torguson, and T. W. Hodler.Cartography: Thematic Map Design. McGraw-Hill Higher Education, New York, 6th ed., Apr
-
[7]
E. Di Giacomo, W. Didimo, G. Liotta, and F. Montecchiani. Network visualization retargeting. In6th International Conference on Informa- tion, Intelligence, Systems and Applications (IISA), pp. 1–6, June 2015. doi:10.1109/IISA.2015.73880951
-
[8]
D. Eppstein, E. Mumford, B. Speckmann, and K. Verbeek. Area- Universal and Constrained Rectangular Layouts.SIAM Journal on Computing, 41(3):537–564, Jan. 2012. doi:10.1137/1108340328
-
[9]
E. Fusy. Transversal structures on triangulations: A combinatorial study and straight-line drawings.Discrete Mathematics, 309(7):1870– 1894, Apr. 2009. doi:10.1016/j.disc.2007.12.0933, 4, 7
-
[10]
J. Hoffswell, W. Li, and Z. Liu. Techniques for Flexible Responsive Visualization Design. InProceedings of the 2020 CHI Conference on Human Factors in Computing Systems. ACM, Apr. 2020. doi: 10. 1145/3313831.33767771, 2, 9
arXiv 2020
-
[11]
Horak, W
T. Horak, W. Aigner, M. Brehmer, A. Joshi, and C. Tominski. Respon- sive Visualization Design for Mobile Devices. In B. Lee, R. Dachselt, P. Isenberg, and E. K. Choe, eds.,Mobile Data Visualization, pp. 33–
-
[12]
Chapman and Hall/CRC, Boca Raton, 1st ed., Nov. 2021. doi: 10. 1201/9781003090823-22
2021
-
[13]
L. Houtman. Techniques, challenges, and opportunities in mobile thematic map design for data journalism.Cartography and Geographic Information Science, 53(1):18–37, Jan. 2026. doi: 10.1080/15230406. 2025.24842102
-
[14]
G. Kant and X. He. Regular edge labeling of 4-connected plane graphs and its applications in graph drawing problems.Theoretical Com- puter Science, 172(1-2):175–193, Feb. 1997. doi: 10.1016/S0304-3975 (95)00257-X3, 4, 7, 8
-
[15]
H. Kim, D. Moritz, and J. Hullman. Design Patterns and Trade-Offs in Responsive Visualization for Communication.Computer Graphics Forum, 40(3):459–470, June 2021. doi:10.1111/cgf.143211
-
[16]
H. Kim, R. Rossi, F. Du, E. Koh, S. Guo, J. Hullman, and J. Hoffswell. Cicero: A Declarative Grammar for Responsive Visualization. InPro- ceedings of the 2022 CHI Conference on Human Factors in Computing Systems, pp. 1–15. ACM, 2022. doi:10.1145/3491102.35174551
-
[17]
H. Kim, R. Rossi, J. Hullman, and J. Hoffswell. Dupo: A Mixed- Initiative Authoring Tool for Responsive Visualization.IEEE Trans- actions on Visualization and Computer Graphics, 30(1):934–943, Jan
-
[18]
doi:10.1109/TVCG.2023.33265831
-
[19]
W. Meulemans. Efficient Optimal Overlap Removal: Algorithms and Experiments.Computer Graphics Forum, 38(3):713–723, June 2019. doi:10.1111/cgf.137228
-
[20]
W. Meulemans, M. Sondag, and B. Speckmann. A Simple Pipeline for Coherent Grid Maps.IEEE Transactions on Visualization and Computer Graphics, 27(2):1236–1246, Feb. 2021. doi: 10.1109/TVCG. 2020.30289539
-
[21]
Muehlenhaus.Web Cartography: Map Design for Interactive and Mobile Devices
I. Muehlenhaus.Web Cartography: Map Design for Interactive and Mobile Devices. CRC Press, Boca Raton, Dec. 2013. doi: 10.1201/ b162292
2013
-
[22]
S. Nickel, M. Sondag, W. Meulemans, S. Kobourov, J. Peltonen, and M. Nollenburg. Multicriteria Optimization for Dynamic Demers Car- tograms.IEEE Transactions on Visualization and Computer Graphics, 28(6):2376–2387, June 2022. doi:10.1109/TVCG.2022.31512278
-
[23]
J. Oesch, S. Schöttler, J. Kelén, and A. Çöltekin. Thematic World Maps in the News: How Effective are They on Smartphones?The Cartographic Journal, pp. 1–15, Feb. 2025. doi:10.1080/00087041.2024 .24476282
-
[24]
Qu and J
Z. Qu and J. Hullman. Keeping Multiple Views Consistent: Constraints, Validations, and Exceptions in Visualization Authoring.IEEE Trans- actions on Visualization and Computer Graphics, 24(1):468–477, Jan
-
[25]
doi:10.1109/TVCG.2017.27441989
-
[26]
E. Raisz. The rectangular statistical cartogram.Geographical Review, 24(2):292–296, Apr. 1934. 7
1934
-
[27]
P. Raposo, G. Touya, and P. Bereuter. A Change of Theme: The Role of Generalization in Thematic Mapping.ISPRS International Journal of Geo-Information, 9(6):371, June 2020. doi:10.3390/ijgi90603712
-
[28]
R. E. Roth, C. A. Brewer, and M. S. Stryker. A typology of operators for maintaining legible map designs at multiple scales.Cartographic Perspectives, 68:29–64, Mar. 2011. doi:10.14714/CP68.72
-
[29]
R. E. Roth, A. Çöltekin, L. Delazari, B. Denney, A. Mendonça, B. A. Ricker, J. Shen, Z. Stachoˇn, and M. Wu. Making maps & visualizations for mobile devices: A research agenda for mobile-first and responsive cartographic design.Journal of Location Based Services, 18(4):408– 478, Mar. 2024. doi:10.1080/17489725.2023.22514232
-
[30]
S. Schöttler, J. Dykes, J. Wood, U. Hinrichs, and B. Bach. Constraint- Based Breakpoints for Responsive Visualization Design and Develop- ment.IEEE Transactions on Visualization and Computer Graphics, 31(9):4593–4604, June 2025. doi:10.1109/TVCG.2024.34100971, 2
-
[31]
S. Schöttler, U. Hinrichs, and B. Bach. Practices and Strategies in Responsive Thematic Map Design: A Report from Design Work- shops with Experts.IEEE Transactions on Visualization and Computer Graphics, 31(1):1148–1157, Jan. 2025. doi: 10.1109/TVCG.2024.3456352 2
-
[32]
T. A. Slocum, R. B. McMaster, F. C. Kessler, and H. H. Howard. Thematic Cartography and Geovisualization. CRC Press, Boca Raton, 4 ed., Aug. 2022. doi:10.1201/97810031505271, 2
-
[33]
B. Speckmann and K. Verbeek. Necklace Maps.IEEE Transactions on Visualization and Computer Graphics, 16(6):881–889, 2010. doi: 10.1109/TVCG.2010.1801, 2
-
[34]
M. Van Kreveld and B. Speckmann. On rectangular cartograms.Com- putational Geometry, 37(3):175–187, Aug. 2007. doi: 10.1016/j.comgeo. 2006.06.0027
-
[35]
A. Wu, W. Tong, T. Dwyer, B. Lee, P. Isenberg, and H. Qu. MobileVis- Fixer: Tailoring Web Visualizations for Mobile Phones Leveraging an Explainable Reinforcement Learning Framework.IEEE Transactions on Visualization and Computer Graphics, 27(2):464–474, Feb. 2021. doi:10.1109/TVCG.2020.30304231
-
[36]
Y . Wu, X. Liu, S. Liu, and K. Ma. ViSizer: A Visualization Resiz- ing Framework.IEEE Transactions on Visualization and Computer Graphics, 19(2):278–290, Feb. 2013. doi:10.1109/TVCG.2012.1141, 9
-
[37]
W. Zeng, X. Chen, Y . Hou, L. Shao, Z. Chu, and R. Chang. Semi- Automatic Layout Adaptation for Responsive Multiple-View Visual- ization Design.IEEE Transactions on Visualization and Computer Graphics, 30(7):3798–3812, July 2024. doi: 10.1109/TVCG.2023.3240356 1 11 Automated Responsive Thematic Mapping with Layout Guides Supplementary Material Arjen Simon...
discussion (0)
Sign in with ORCID, Apple, or X to comment. Anyone can read and Pith papers without signing in.