Dark and Luminous Matter in the Coma Cluster: Probing Galaxy Cluster Assembly Through Filaments with Weak Lensing and Multiwavelength Observations
Pith reviewed 2026-06-27 09:09 UTC · model grok-4.3
The pith
Weak lensing of the Coma cluster reveals a 1:8 minor merger between two central galaxies and higher dark matter dominance along intracluster filaments.
A machine-rendered reading of the paper's core claim, the machinery that carries it, and where it could break.
Core claim
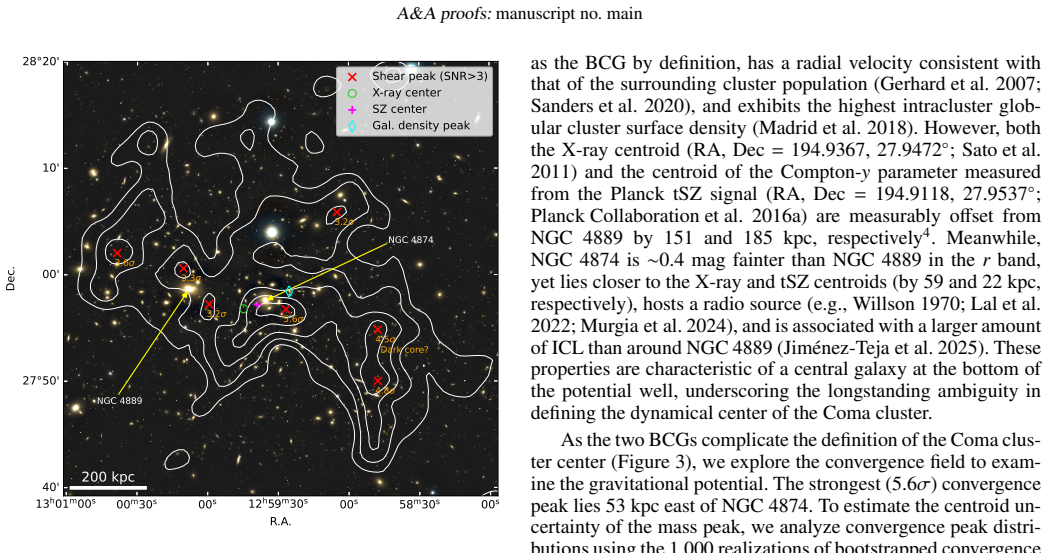
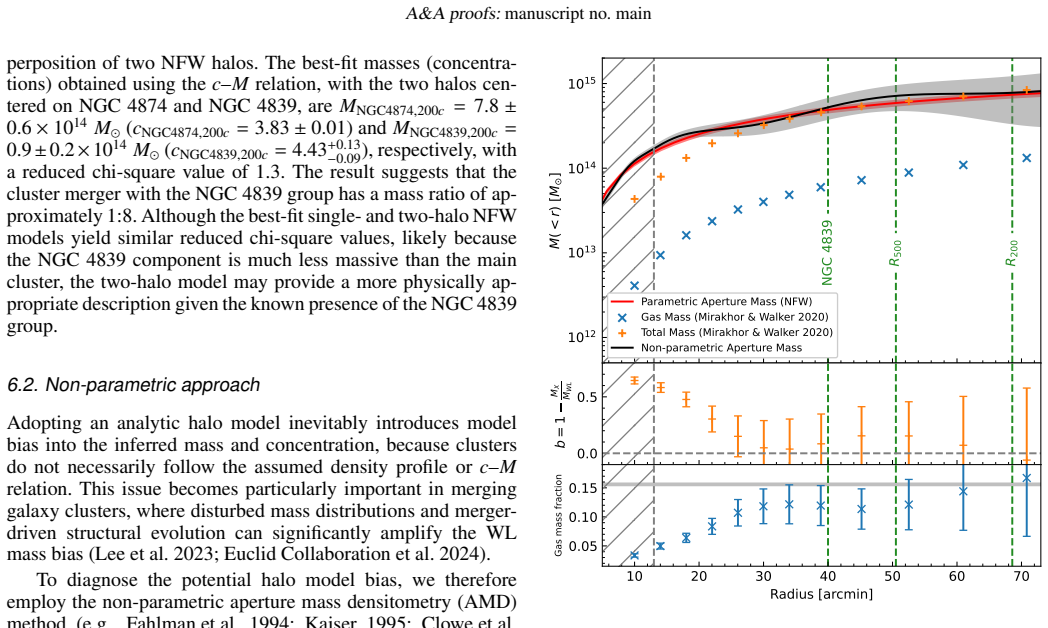
A single-halo NFW fit gives M_200c = 8.2 ± 0.7 × 10^14 M_⊙. A two-halo NFW fit centered on NGC 4874 and NGC 4839 gives masses of 7.8 ± 0.6 and 0.9 ± 0.2 × 10^14 M_⊙, implying a ∼1:8 minor merger. The northern and western ICFs show higher M/L values of ∼1000 M_⊙/L_⊙, suggesting stronger dark matter dominance. The WL signal correlates positively with X-ray surface brightness, strongest along the ICF position angles.
What carries the argument
Two-dimensional weak lensing mass reconstruction fitted with single- and two-halo Navarro-Frenk-White profiles, cross-checked against X-ray surface brightness and mass-to-light ratios along reported intracluster filament directions.
If this is right
- The aperture mass densitometry profile matches the best-fit NFW model and X-ray hydrostatic mass beyond about 560 kpc, indicating little global merger bias in the total mass estimate.
- Shear-selected subhalos appear predominantly along the ICF directions where the WL-X-ray correlation is strongest.
- The gas mass fraction implies the cluster is returning from first apocenter after the minor merger.
- The radially constant average M/L_r of 250 ± 66 within R_200c contrasts with the elevated values in specific filaments.
Where Pith is reading between the lines
- If the higher filament M/L ratios hold, then intracluster filaments may serve as laboratories for studying dark matter on scales between galaxies and the full cluster.
- Joint WL and X-ray mapping along multiple position angles could be applied to other nearby clusters to test whether minor mergers commonly leave detectable filamentary dark matter signatures.
- The lack of strong hydrostatic bias at large radii suggests that weak lensing remains reliable for total mass even in merging systems when averaged over the full aperture.
Load-bearing premise
The reported intracluster filaments are real connected structures whose spatial alignment with the weak lensing signal traces physical assembly rather than chance projections or selection effects.
What would settle it
If deeper weak lensing data or targeted spectroscopy along the same position angles showed no excess mass or galaxy-dark matter correlation in the northern and western filaments, the claim of stronger dark matter dominance in those structures would not hold.
Figures


read the original abstract
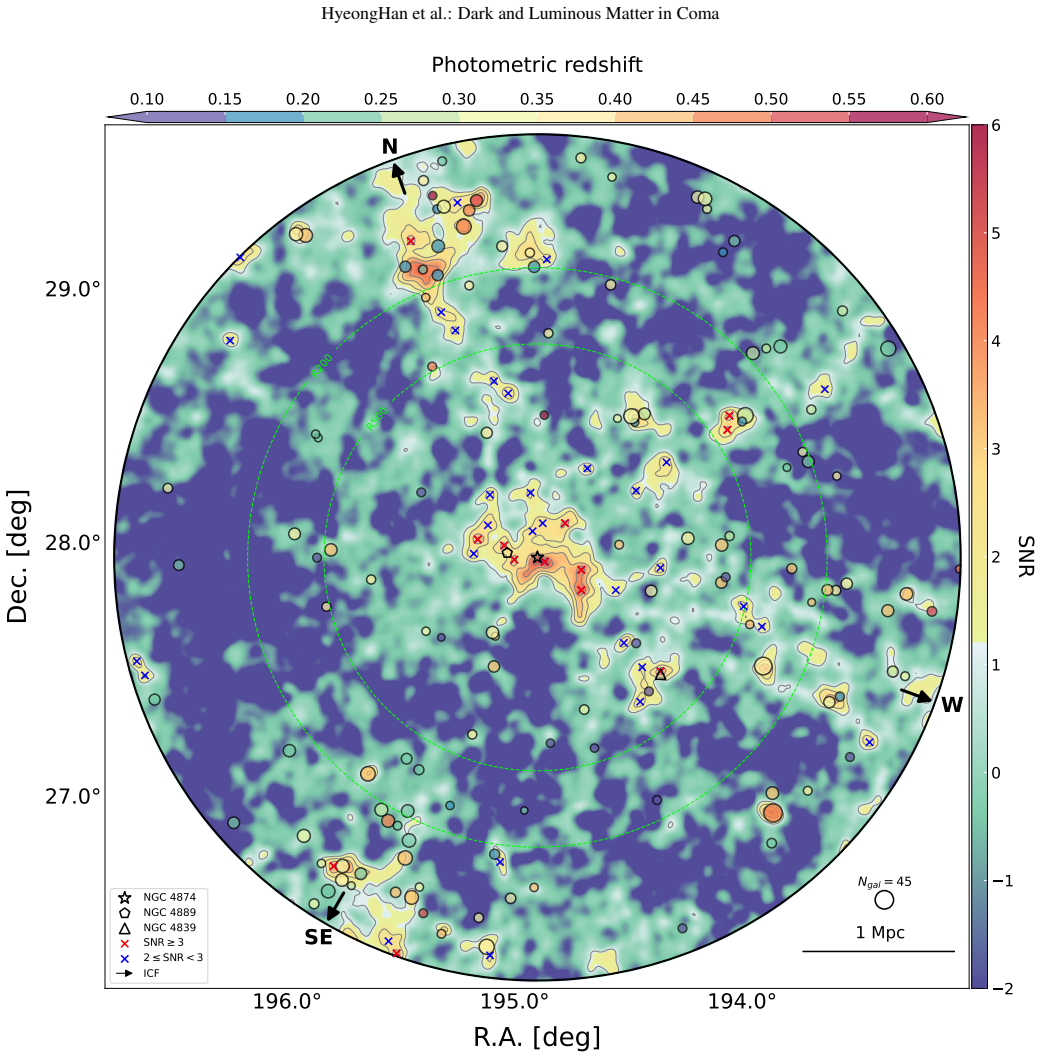
The Coma cluster (Abell 1656; $z=0.023$) is a nearby rich galaxy cluster and a key laboratory for studying cluster assembly in the Cosmic Web. We characterize its projected dark matter distribution and connection to galaxies, the intracluster medium, and reported intracluster filaments (ICFs) with wide-field ($\sim$12-deg$^2$) Subaru/Hyper Suprime-Cam weak-lensing (WL) analysis. We reconstruct the two-dimensional mass distribution, fit Navarro-Frenk-White (NFW) models, derive an aperture mass densitometry profile, and compare the WL signal with optical spectroscopy, eROSITA X-ray observations, radio data, and gas fraction diagnostics. A single-halo NFW fit yields $M_{200\mathrm{c}}=8.2\pm0.7\times10^{14}~M_{\odot}$. The aperture mass profile agrees with the best-fit NFW model and the X-ray hydrostatic mass at $R\gtrsim20'$ ($\sim$560 kpc), suggesting little merger-induced bias in the global WL mass, while the inner region shows substantial hydrostatic bias. A two-halo NFW fit centered on NGC 4874 and NGC 4839 gives masses of $7.8\pm0.6$ and $0.9\pm0.2\times10^{14}~M_{\odot}$, implying a $\sim$1:8 minor merger. The gas mass fraction suggests that the system is returning from first apocenter. We find a positive spatial correlation between the WL signal and X-ray surface brightness, strongest along the ICF directions ($110^{\circ}$ and $340^{\circ}$), where shear-selected subhalos are predominantly detected. The Coma $r$-band mass-to-light ratio is radially constant with $\langle M/L_r\rangle\simeq250\pm66~M_{\odot}/L_{\odot}$ within $R_{200\mathrm{c}}$, whereas the northern and western ICFs show higher values of $\sim1000~M_{\odot}/L_{\odot}$, suggesting stronger dark matter dominance. These results show that joint WL and multiwavelength analyses can effectively probe cluster assembly and the dark matter content of ICFs.
Editorial analysis
A structured set of objections, weighed in public.
Referee Report
Summary. The manuscript presents a wide-field Subaru/HSC weak-lensing analysis of the Coma cluster (z=0.023), reconstructing the 2D mass distribution and fitting single-halo and two-halo NFW profiles. It reports M_{200c}=8.2±0.7×10^{14} M_⊙ for the single-halo case and 7.8±0.6 and 0.9±0.2×10^{14} M_⊙ for the two-halo fit centered on NGC 4874 and NGC 4839, interprets the latter as evidence for a ~1:8 minor merger, finds agreement between WL and X-ray hydrostatic masses at R≳20', reports positive WL–X-ray spatial correlations strongest along reported ICF position angles (110° and 340°), and measures radially constant M/L_r≈250 M_⊙/L_⊙ with elevated values ~1000 M_⊙/L_⊙ in the northern and western ICFs, concluding that the system is returning from first apocenter and that ICFs show stronger dark-matter dominance.
Significance. If the reported masses, correlations, and M/L contrasts are robust after validation of the fitting procedures and controls for projection, the work would add a multiwavelength case study of minor-merger assembly in a nearby cluster and provide observational constraints on dark-matter content within intracluster filaments.
major comments (3)
- [Abstract] Abstract: the two-halo NFW masses are presented as direct evidence for a ~1:8 merger, yet no χ², likelihood ratio, or degrees-of-freedom comparison between the single-halo and two-halo models is supplied, leaving the statistical justification for the two-component model unassessable.
- [Abstract] Abstract: the elevated M/L_r~1000 M_⊙/L_⊙ values in the northern and western ICFs (versus the radial average ~250) are central to the dark-matter-dominance claim, but the abstract gives no information on the precise apertures, luminosity weighting, or error propagation used to derive these region-specific ratios.
- [Abstract] Abstract: the statement that the WL–X-ray correlation is strongest at the ICF position angles 110° and 340° is load-bearing for the assembly interpretation, yet the text supplies neither an a-priori definition of these angles from independent data nor a quantitative test (e.g., randomization of angles or null-hypothesis significance) that would rule out data-driven selection or projection effects.
minor comments (1)
- [Abstract] Abstract: the two-halo masses are quoted without explicit confirmation that they are also M_{200c} quantities, creating minor ambiguity in the comparison to the single-halo result.
Simulated Author's Rebuttal
We thank the referee for the careful and constructive review. The comments highlight areas where the abstract could be made more self-contained with additional statistical and methodological details. We address each point below and will revise the manuscript accordingly.
read point-by-point responses
-
Referee: [Abstract] Abstract: the two-halo NFW masses are presented as direct evidence for a ~1:8 merger, yet no χ², likelihood ratio, or degrees-of-freedom comparison between the single-halo and two-halo models is supplied, leaving the statistical justification for the two-component model unassessable.
Authors: We agree that a quantitative model comparison is needed to assess the two-halo fit. The two-component model is motivated by known substructure, but the revised manuscript will include χ² values, degrees of freedom, and a likelihood-ratio test between the single- and two-halo NFW models, with a brief reference added to the abstract. revision: yes
-
Referee: [Abstract] Abstract: the elevated M/L_r~1000 M_⊙/L_⊙ values in the northern and western ICFs (versus the radial average ~250) are central to the dark-matter-dominance claim, but the abstract gives no information on the precise apertures, luminosity weighting, or error propagation used to derive these region-specific ratios.
Authors: The apertures for the northern and western ICF regions follow the filament position angles reported in the literature, with luminosity weighting from the r-band galaxy catalog and errors propagated from the weak-lensing shear and photometric uncertainties (detailed in the methods). We will revise the abstract to include a concise statement on the apertures and error approach. revision: yes
-
Referee: [Abstract] Abstract: the statement that the WL–X-ray correlation is strongest at the ICF position angles 110° and 340° is load-bearing for the assembly interpretation, yet the text supplies neither an a-priori definition of these angles from independent data nor a quantitative test (e.g., randomization of angles or null-hypothesis significance) that would rule out data-driven selection or projection effects.
Authors: The angles 110° and 340° are adopted from independent prior studies of Coma’s intracluster filaments; we will ensure explicit citations are present. In the revision we will add a quantitative test (e.g., correlation strength versus randomized angles) to demonstrate the result is not driven by post-hoc selection. revision: yes
Circularity Check
No significant circularity detected
full rationale
The derivation consists of standard weak-lensing mass reconstruction followed by direct NFW profile fitting to the Subaru/HSC shear data, yielding the reported single- and two-halo masses as fit outputs. Aperture mass densitometry, M/L ratios, and WL-X-ray spatial correlations are computed from the same data products and external multiwavelength maps without any step that re-uses a fitted parameter as a subsequent prediction or that relies on a self-citation chain for uniqueness. The two-halo masses (7.8±0.6 and 0.9±0.2×10^14 M⊙) and the elevated ICF M/L values are therefore independent results of the analysis rather than tautological restatements of inputs.
Axiom & Free-Parameter Ledger
free parameters (2)
- M200c single-halo mass =
8.2e14 solar masses
- Two-halo masses =
7.8 and 0.9 x 10^14 solar masses
axioms (2)
- domain assumption Navarro-Frenk-White profile accurately describes cluster mass distribution
- domain assumption Weak lensing shear traces projected mass without major unaccounted systematics
Reference graph
Works this paper leans on
-
[1]
Abbott, T. M. C., Aguena, M., Alarcon, A., et al. 2020, Phys. Rev. D, 102, 023509
2020
-
[2]
O., Corwin, Jr., H
Abell, G. O., Corwin, Jr., H. G., & Olowin, R. P. 1989, ApJS, 70, 1
1989
-
[3]
2009, A&A, 507, 1225
Adami, C., Le Brun, V ., Biviano, A., et al. 2009, A&A, 507, 1225
2009
-
[4]
K., Agüeros, M
Adelman-McCarthy, J. K., Agüeros, M. A., Allam, S. S., et al. 2007, ApJS, 172, 634
2007
-
[5]
W., Evrard, A
Allen, S. W., Evrard, A. E., & Mantz, A. B. 2011, ARA&A, 49, 409
2011
-
[6]
Andrade-Santos, F., Nulsen, P. E. J., Kraft, R. P., et al. 2013, ApJ, 766, 107
2013
-
[7]
2023, A&A, 675, A188 Bahé, Y
Angelinelli, M., Ettori, S., Dolag, K., Vazza, F., & Ragagnin, A. 2023, A&A, 675, A188 Bahé, Y . M., McCarthy, I. G., & King, L. J. 2012, MNRAS, 421, 1073
2023
-
[8]
J., & Schneider, P
Bartelmann, M., King, L. J., & Schneider, P. 2001, A&A, 378, 361
2001
-
[9]
Becker, M. R. & Kravtsov, A. V . 2011, ApJ, 740, 25
2011
-
[10]
Beers, T. C. & Geller, M. J. 1983, ApJ, 274, 491
1983
-
[11]
A., Biviano, A., & Abadi, M
Benavides, J. A., Biviano, A., & Abadi, M. G. 2023, A&A, 669, A147
2023
-
[12]
Bernstein, G. M. & Jarvis, M. 2002, AJ, 123, 583
2002
-
[13]
1996, A&A, 311, 95
Biviano, A., Durret, F., Gerbal, D., et al. 1996, A&A, 311, 95
1996
-
[14]
P., Schrabback, T., et al
Bocquet, S., Dietrich, J. P., Schrabback, T., et al. 2019, ApJ, 878, 55
2019
-
[15]
2022, arXiv e-prints, arXiv:2203.01958
Bonafede, A., Brunetti, G., Rudnick, L., et al. 2022, arXiv e-prints, arXiv:2203.01958
arXiv 2022
-
[16]
2021, ApJ, 907, 32
Bonafede, A., Brunetti, G., Vazza, F., et al. 2021, ApJ, 907, 32
2021
-
[17]
R., Kofman, L., & Pogosyan, D
Bond, J. R., Kofman, L., & Pogosyan, D. 1996, Nature, 380, 603
1996
-
[18]
A., Strauss, M
Bond, N. A., Strauss, M. A., & Cen, R. 2010, MNRAS, 409, 156
2010
-
[19]
& Guzzo, L
Borgani, S. & Guzzo, L. 2001, Nature, 409, 39
2001
-
[20]
2022, A&A Rev., 30, 3 Bradaˇc, M., Lombardi, M., & Schneider, P
Boselli, A., Fossati, M., & Sun, M. 2022, A&A Rev., 30, 3 Bradaˇc, M., Lombardi, M., & Schneider, P. 2004, A&A, 424, 13
2022
-
[21]
2025, astropy/photutils: 2.2.0
Bradley, L., Sip˝ocz, B., Robitaille, T., et al. 2025, astropy/photutils: 2.2.0
2025
-
[22]
& Rudnick, L
Brown, S. & Rudnick, L. 2011, MNRAS, 412, 2
2011
-
[23]
Bryan, G. L. & Norman, M. L. 1998, ApJ, 495, 80
1998
-
[24]
O., Roettiger, K., Ledlow, M., & Klypin, A
Burns, J. O., Roettiger, K., Ledlow, M., & Klypin, A. 1994, ApJ, 427, L87
1994
-
[25]
Cautun, M., van de Weygaert, R., Jones, B. J. T., & Frenk, C. S. 2014, MNRAS, 441, 2923
2014
-
[26]
J., Hong, S
Cha, S., Jee, M. J., Hong, S. E., et al. 2025, ApJ, 981, 52
2025
-
[27]
P., Chies-Santos, A
Cho, H., Blakeslee, J. P., Chies-Santos, A. L., et al. 2016, ApJ, 822, 95
2016
-
[28]
M., Lyskova, N., & Sunyaev, R
Churazov, E., Khabibullin, I., Bykov, A. M., Lyskova, N., & Sunyaev, R. 2023, A&A, 670, A156
2023
-
[29]
Churazov, E., Khabibullin, I., Lyskova, N., Sunyaev, R., & Bykov, A. M. 2021, A&A, 651, A41
2021
-
[30]
A., Kaiser, N., & Gioia, I
Clowe, D., Luppino, G. A., Kaiser, N., & Gioia, I. M. 2000, ApJ, 539, 540
2000
-
[31]
M., Krughoff, K
Colberg, J. M., Krughoff, K. S., & Connolly, A. J. 2005, MNRAS, 359, 272
2005
-
[32]
2001, MNRAS, 328, 1039
Colless, M., Dalton, G., Maddox, S., et al. 2001, MNRAS, 328, 1039
2001
-
[33]
& Dunn, A
Colless, M. & Dunn, A. M. 1996, ApJ, 458, 435
1996
-
[34]
2019, MNRAS, 488, 4779
Costanzi, M., Rozo, E., Simet, M., et al. 2019, MNRAS, 488, 4779
2019
-
[35]
S., Fazio, G
Cybulski, R., Yun, M. S., Fazio, G. G., & Gutermuth, R. A. 2014, MNRAS, 439, 3564
2014
-
[36]
S., Schlegel, D
Dawson, K. S., Schlegel, D. J., Ahn, C. P., et al. 2013, AJ, 145, 10 de Lapparent, V ., Geller, M. J., & Huchra, J. P. 1986, ApJ, 302, L1
2013
-
[37]
C., Kitching, T
Deshpande, A. C., Kitching, T. D., Cardone, V . F., et al. 2020, A&A, 636, A95 DESI Collaboration, Abareshi, B., Aguilar, J., et al. 2022, AJ, 164, 207 DESI Collaboration, Adame, A. G., Aguilar, J., et al. 2024, AJ, 168, 58 Di Cintio, A., Brook, C. B., Dutton, A. A., et al. 2017, MNRAS, 466, L1
2020
-
[38]
2018, ApJS, 239, 35
Diemer, B. 2018, ApJS, 239, 35
2018
-
[39]
& Kravtsov, A
Diemer, B. & Kravtsov, A. V . 2014, ApJ, 789, 1
2014
-
[40]
& Shectman, S
Dressler, A. & Shectman, S. A. 1988, AJ, 95, 985
1988
-
[41]
P., Norberg, P., Baldry, I
Driver, S. P., Norberg, P., Baldry, I. K., et al. 2009, Astronomy and Geophysics, 50, 5.12
2009
-
[42]
& Rephaeli, Y
Dvorkin, I. & Rephaeli, Y . 2015, MNRAS, 450, 896
2015
-
[43]
2015, Nature, 528, 105
Eckert, D., Jauzac, M., Shan, H., et al. 2015, Nature, 528, 105
2015
-
[44]
2025, A&A, 704, A151
Einasto, M., Tenjes, P., Kipper, R., et al. 2025, A&A, 704, A151
2025
-
[45]
J., Loeb, A., & Turner, E
Eisenstein, D. J., Loeb, A., & Turner, E. L. 1997, ApJ, 475, 421
1997
-
[46]
J., Weinberg, D
Eisenstein, D. J., Weinberg, D. H., Agol, E., et al. 2011, AJ, 142, 72 Euclid Collaboration, Giocoli, C., Meneghetti, M., et al. 2024, A&A, 681, A67
2011
-
[47]
1994, ApJ, 437, 56
Fahlman, G., Kaiser, N., Squires, G., & Woods, D. 1994, ApJ, 437, 56
1994
-
[48]
E., Gorenstein, M
Falco, E. E., Gorenstein, M. V ., & Shapiro, I. I. 1985, ApJ, 289, L1
1985
-
[49]
H., Wojtak, R., et al
Falco, M., Hansen, S. H., Wojtak, R., et al. 2014, MNRAS, 442, 1887
2014
-
[50]
J., et al
Finner, K., HyeongHan, K., Jee, M. J., et al. 2021, ApJ, 918, 72
2021
-
[51]
J., Cho, H., et al
Finner, K., Jee, M. J., Cho, H., et al. 2025, ApJS, 277, 28
2025
-
[52]
J., Golovich, N., et al
Finner, K., Jee, M. J., Golovich, N., et al. 2017, ApJ, 851, 46
2017
-
[53]
W., Jee, M
Finner, K., Randall, S. W., Jee, M. J., et al. 2023, ApJ, 942, 23
2023
-
[54]
1984, A&A, 138, 85
Fontanelli, P. 1984, A&A, 138, 85
1984
-
[55]
2018, PASJ, 70, S3
Furusawa, H., Koike, M., Takata, T., et al. 2018, PASJ, 70, S3
2018
-
[56]
R., de Carvalho, R
Gal, R. R., de Carvalho, R. R., Lopes, P. A. A., et al. 2003, AJ, 125, 2064 Ganeshaiah Veena, P., Cautun, M., Tempel, E., van de Weygaert, R., & Frenk, C. S. 2019, MNRAS, 487, 1607 Ganeshaiah Veena, P., Cautun, M., van de Weygaert, R., Tempel, E., & Frenk, C. S. 2021, MNRAS, 503, 2280
2003
-
[57]
2026, A&A, 706, L21
Gatuzz, E., Sanders, J., Liu, A., et al. 2026, A&A, 706, L21
2026
-
[58]
1999, A&AS, 136, 227
Gavazzi, G., Carrasco, L., & Galli, R. 1999, A&AS, 136, 227
1999
-
[59]
2011, A&A, 534, A31
Gavazzi, G., Savorgnan, G., & Fumagalli, M. 2011, A&A, 534, A31
2011
-
[60]
2009, A&A, 498, L33
Gavazzi, R., Adami, C., Durret, F., et al. 2009, A&A, 498, L33
2009
-
[61]
C., et al
Gerhard, O., Arnaboldi, M., Freeman, K. C., et al. 2007, A&A, 468, 815
2007
-
[62]
2024, A&A, 689, A298
Ghirardini, V ., Bulbul, E., Artis, E., et al. 2024, A&A, 689, A298
2024
-
[63]
H., Sivanandam, S., Zabludoff, A
Gonzalez, A. H., Sivanandam, S., Zabludoff, A. I., & Zaritsky, D. 2013, ApJ, 778, 14 González, R. E. & Padilla, N. D. 2010, MNRAS, 407, 1449
2013
-
[64]
Richard, I., Juri´c, M., Schlegel, D., et al
Gott, J. Richard, I., Juri´c, M., Schlegel, D., et al. 2005, ApJ, 624, 463
2005
-
[65]
Gregory, S. A. & Thompson, L. A. 1978, ApJ, 222, 784
1978
-
[66]
2020, ApJ, 894, 32
Gu, M., Conroy, C., Law, D., et al. 2020, ApJ, 894, 32
2020
-
[67]
M., & Dekel, A
Hahn, O., Porciani, C., Carollo, C. M., & Dekel, A. 2007, MNRAS, 375, 489
2007
-
[68]
A., Koester, B
Hao, J., McKay, T. A., Koester, B. P., et al. 2010, ApJS, 191, 254
2010
-
[69]
L., Verheijen, M
Healy, J., Blyth, S. L., Verheijen, M. A. W., et al. 2021, A&A, 650, A76
2021
-
[70]
M., et al
Ho, M., Ntampaka, M., Rau, M. M., et al. 2022, Nature Astronomy, 6, 936
2022
-
[71]
2001, A&A, 370, 743
Hoekstra, H. 2001, A&A, 370, 743
2001
-
[72]
2003, MNRAS, 339, 1155
Hoekstra, H. 2003, MNRAS, 339, 1155
2003
-
[73]
2011, MNRAS, 412, 2095
Hoekstra, H., Hartlap, J., Hilbert, S., & van Uitert, E. 2011, MNRAS, 412, 2095
2011
-
[74]
E., Park, S., Jee, M
Hong, S. E., Park, S., Jee, M. J., Bak, D., & Cha, S. 2021, ApJ, 923, 266
2021
-
[75]
Huchra, J. P. & Geller, M. J. 1982, ApJ, 257, 423
1982
-
[76]
Hughes, J. P. 1989, ApJ, 337, 21
1989
-
[77]
S., Geller, M
Hwang, H. S., Geller, M. J., Diaferio, A., Rines, K. J., & Zahid, H. J. 2014, ApJ, 797, 106
2014
-
[78]
J., Lee, W., et al
HyeongHan, K., Jee, M. J., Lee, W., et al. 2025, Nature Astronomy, 9, 925
2025
-
[79]
J., Rudnick, L., et al
HyeongHan, K., Jee, M. J., Rudnick, L., et al. 2020, ApJ, 900, 127
2020
-
[80]
A., et al
Ishiyama, T., Prada, F., Klypin, A. A., et al. 2021, MNRAS, 506, 4210
2021
discussion (0)
Sign in with ORCID, Apple, or X to comment. Anyone can read and Pith papers without signing in.