Exploring Statistical Change Point Detection Techniques for Performance Anomaly Detection at Mozilla
Pith reviewed 2026-06-26 23:30 UTC · model grok-4.3
The pith
Ensemble voting strategies raise the F1-score of performance regression detection by 11 percent over Mozilla's current T-test method.
A machine-rendered reading of the paper's core claim, the machinery that carries it, and where it could break.
Core claim
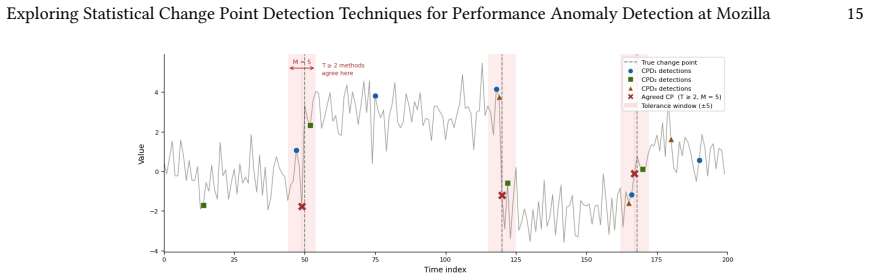
While offline and hybrid change-point detection methods improve recall over Mozilla's Student's T-test approach, they do so at a high cost to precision. Ensemble voting strategies alleviate this trade-off and offer more consistent performance, resulting in 11% improvement in the F1-score on the ground-truth dataset of 174 performance time series.
What carries the argument
Ensemble voting strategies that combine outputs from multiple change-point detection methods to decide when a performance time series contains a regression.
If this is right
- Ensemble methods produce more reliable alerts that reduce wasted engineering effort on false positives.
- The manually annotated dataset supplies a reusable benchmark for testing future change-point detectors in performance settings.
- The best ensembles can be integrated into Perfherder while preserving the existing daily alert workflow.
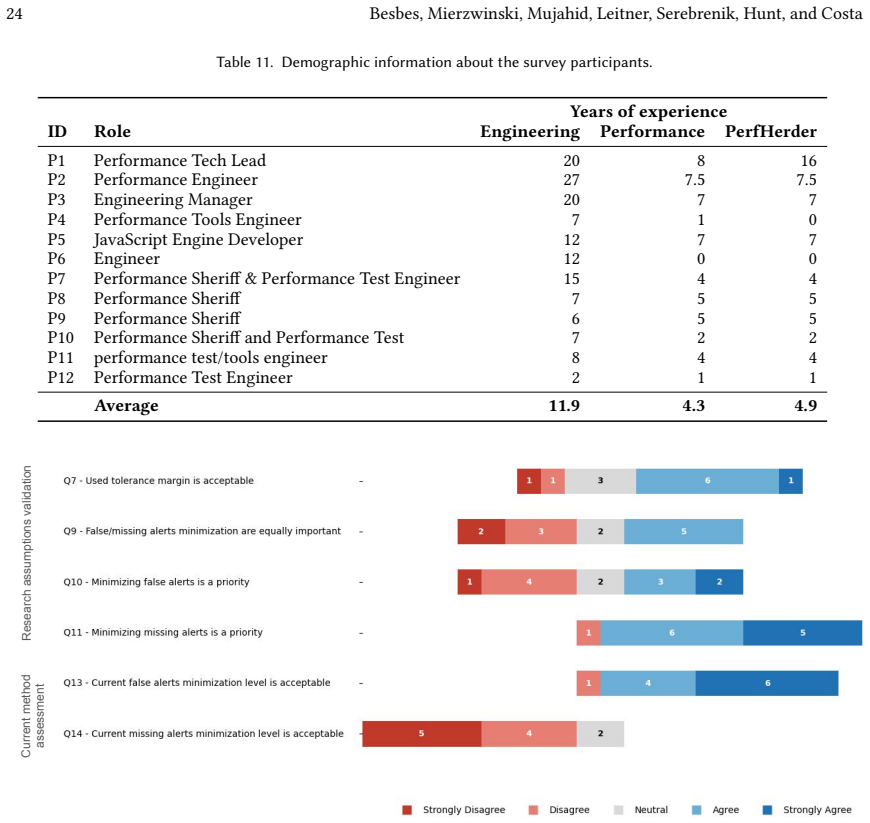
- Practitioner survey responses support that the measured F1 gains translate to reduced alert fatigue in real use.
Where Pith is reading between the lines
- Similar ensemble voting could be applied to other software metrics such as reliability or security signals in the same continuous-integration pipelines.
- Organizations running comparable performance-monitoring systems might see comparable gains by swapping in these ensembles without changing their data collection.
- The 174-series benchmark makes it possible to test whether newer online change-point methods maintain the same 11 percent edge when run in streaming mode.
Load-bearing premise
The ground-truth labels created by the eleven Mozilla performance engineers accurately identify true performance regressions without systematic bias in the 174 time series.
What would settle it
Re-labeling the same 174 time series by a fresh group of engineers and finding that no ensemble reaches a higher F1-score than the original T-test method.
Figures


read the original abstract
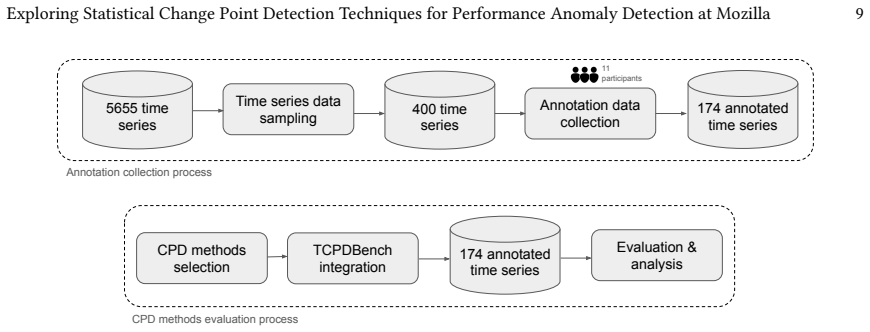
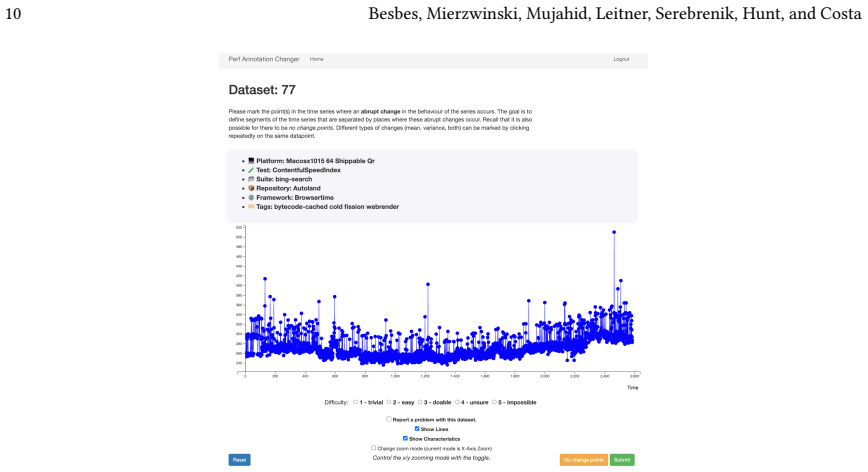
Software performance regressions can have significant business consequences, making automated detection a critical component of modern continuous integration pipelines. At Mozilla, performance anomaly detection is handled by Perfherder, Mozilla's performance engineering management system that relies on a Student's T-test-based approach to flag regressions across hundreds of daily code changes. However, our preliminary analysis of one year of Mozilla performance data reveals that 12.5% of generated alert groups are false positives, while approximately 6.8% of them contain regressions missed by the automated system. This paper presents an empirical study evaluating 25 change-point detection (CPD) methods and 15 ensemble approaches as alternatives to Mozilla's current method. We construct a ground-truth dataset of 174 performance time series manually annotated by eleven Mozilla performance engineers, representing one of the first practitioner-annotated CPD benchmarks for performance engineering. Our results show that while offline and hybrid CPD methods improve recall over Mozilla's method, they do so at a high cost to precision. Ensemble voting strategies alleviate this trade-off and offer more consistent performance, resulting in 11% improvement in the F1-score. We validate the experimental results through a practitioner survey and report on lessons learned from integrating the best methods into Mozilla's performance engineering system.
Editorial analysis
A structured set of objections, weighed in public.
Referee Report
Summary. The manuscript evaluates 25 change-point detection methods and 15 ensemble approaches as alternatives to Mozilla's T-test baseline for performance anomaly detection in Perfherder. It constructs a ground-truth dataset of 174 time series annotated by eleven performance engineers, reports that offline/hybrid methods improve recall at the cost of precision while ensembles achieve an 11% F1-score gain with more consistent performance, and validates results via a practitioner survey.
Significance. If the ground-truth annotations prove reliable, the work supplies one of the first practitioner-annotated benchmarks for CPD in performance engineering and identifies deployable ensemble strategies that could reduce the observed 12.5% false-positive and 6.8% missed-regression rates in continuous-integration pipelines.
major comments (3)
- [Dataset construction] Dataset construction (implicit in abstract and § on ground-truth): the central 11% F1 improvement is computed entirely against labels produced by eleven engineers, yet no inter-annotator agreement statistic (Fleiss' kappa, percentage agreement, or disagreement-resolution protocol) is reported. Without this, it is impossible to distinguish genuine detection quality from methods that simply reproduce annotator-specific biases.
- [Results] Results (abstract and empirical comparison section): the 11% F1 gain for ensembles is stated without accompanying statistical significance tests (paired Wilcoxon or McNemar across the 174 series), confidence intervals, or per-series variance, so it is unclear whether the delta is robust or dataset-specific.
- [Methods] Methods (implementation of the 25 CPD algorithms and 15 ensembles): the manuscript provides no explicit description of hyper-parameter selection, handling of missing values or trend components in the Mozilla time series, or the exact voting rules used in the ensembles, rendering the comparison non-reproducible and the fairness of the baseline evaluation difficult to assess.
minor comments (2)
- [Abstract] Abstract states concrete percentages (12.5% false positives, 6.8% missed) but does not indicate the exact time window or alert-group definition used to compute them.
- [Validation] The practitioner survey is mentioned as validation but its sample size, questions, and response rate are not summarized in the abstract or early sections.
Simulated Author's Rebuttal
We thank the referee for these constructive comments, which highlight important aspects of rigor for the ground-truth dataset, statistical validation of results, and reproducibility. We address each point below and will revise the manuscript to incorporate the requested details.
read point-by-point responses
-
Referee: [Dataset construction] Dataset construction (implicit in abstract and § on ground-truth): the central 11% F1 improvement is computed entirely against labels produced by eleven engineers, yet no inter-annotator agreement statistic (Fleiss' kappa, percentage agreement, or disagreement-resolution protocol) is reported. Without this, it is impossible to distinguish genuine detection quality from methods that simply reproduce annotator-specific biases.
Authors: We agree that reporting inter-annotator agreement is essential for establishing the reliability of the practitioner-annotated ground truth. The current manuscript does not include Fleiss' kappa, percentage agreement, or a detailed disagreement-resolution protocol. In the revision we will compute and report these statistics (including pairwise agreement rates) and describe the annotation process and any resolution steps used by the eleven engineers. revision: yes
-
Referee: [Results] Results (abstract and empirical comparison section): the 11% F1 gain for ensembles is stated without accompanying statistical significance tests (paired Wilcoxon or McNemar across the 174 series), confidence intervals, or per-series variance, so it is unclear whether the delta is robust or dataset-specific.
Authors: We concur that the reported 11% F1 improvement requires statistical support to demonstrate robustness. The manuscript currently presents only the aggregate F1 delta. We will add paired Wilcoxon signed-rank tests (and McNemar's test where suitable), 95% confidence intervals, and per-series variance measures across the 174 time series in the revised empirical section. revision: yes
-
Referee: [Methods] Methods (implementation of the 25 CPD algorithms and 15 ensembles): the manuscript provides no explicit description of hyper-parameter selection, handling of missing values or trend components in the Mozilla time series, or the exact voting rules used in the ensembles, rendering the comparison non-reproducible and the fairness of the baseline evaluation difficult to assess.
Authors: We acknowledge the need for greater methodological transparency. The current text does not detail hyper-parameter selection, missing-value handling, trend removal, or the precise ensemble voting rules. In revision we will expand the methods section with these specifics (including any grid-search or default-parameter choices, preprocessing steps, and voting implementations such as majority or weighted schemes) to enable full reproducibility. revision: yes
Circularity Check
No circularity: purely empirical comparison on external annotations
full rationale
The paper reports an empirical evaluation of 25 CPD methods and 15 ensembles on 174 time series whose ground-truth labels were created by eleven Mozilla engineers. The central result (11% F1 improvement of ensembles over the T-test baseline) is computed directly against these external labels. No equations, derivations, fitted parameters renamed as predictions, or self-citation chains appear in the provided text. The evaluation is therefore self-contained against the stated benchmark and does not reduce to any of the enumerated circularity patterns.
Axiom & Free-Parameter Ledger
Reference graph
Works this paper leans on
-
[1]
Ryan Prescott Adams and David J. C. MacKay. 2007. Bayesian Online Changepoint Detection. arXiv:0710.3742 [stat.ML] https://arxiv.org/abs/0710.3 742
Pith/arXiv arXiv 2007
-
[2]
Mejbah Alam, Justin Gottschlich, Nesime Tatbul, Javier Turek, Timothy Mattson, and Abdullah Muzahid. 2019. A zero-positive learning approach for diagnosing software performance regressions. InAdvances in Neural Information Processing Systems, Vol. 32. Curran Associates Inc., Red Hook, NY, USA, Article 1043, 13 pages. doi:10.5555/3454287.3455330
-
[3]
Samaneh Aminikhanghahi and Diane Cook. 2017. A Survey of Methods for Time Series Change Point Detection.Knowledge and Information Systems 51, 2 (05 2017), 339––367. doi:10.1007/s10115-016-0987-z
-
[4]
Andrea Arcuri and Lionel Briand. 2011. A practical guide for using statistical tests to assess randomized algorithms in software engineering. InProceedings of the 33rd International Conference on Software Engineering(Waikiki, Honolulu, HI, USA)(ICSE ’11). Association for Computing Machinery, New York, NY, USA, 1––10. doi:10.1145/1985793.1985795
-
[5]
Zahra Atashgahi, Decebal Constantin Mocanu, Raymond Veldhuis, and Mykola Pechenizkiy. 2022. Memory-free Online Change-point Detection: A Novel Neural Network Approach. arXiv:2207.03932 [cs.LG] https://arxiv.org/abs/2207.03932
arXiv 2022
-
[6]
Ivan E. Auger and Charles E. Lawrence. 1989. Algorithms for the Optimal Identification of Segment Neighborhoods.Bulletin of Mathematical Biology51, 1 (Jan. 1989), 39––54. doi:10.1007/BF02458835
-
[7]
Sayandeep Banerjee, Bappa Basak, Sandip Mandal, Subhajit Manna, Shuvam Chakraborty, Sujata Ghatak, and Anirban Das. 2024. Real Time Anomaly Detection in Network Traffic: A Comparative Analysis of Machine Learning.International Research Journal on Advanced Engineering Hub (IRJAEH)2, 07 (Jul. 2024), 1968––1977. doi:10.47392/IRJAEH.2024.0269
-
[8]
2024.WBS R Package
Rafal Baranowski and Piotr Fryzlewicz. 2024.WBS R Package. https://cran.r-project.org/web/packages/wbs/index.html
2024
-
[9]
Jonathan Bell and Gail Kaiser. 2014. Unit test virtualization with VMVM. InProceedings of the 36th International Conference on Software Engineering (Hyderabad, India)(ICSE 2014). Association for Computing Machinery, New York, NY, USA, 550––561. doi:10.1145/2568225.2568248
-
[10]
Moritz Beller, Hongyu Li, Vivek Nair, Vijayaraghavan Murali, Imad Ahmad, Jürgen Cito, Drew Carlson, Ari Aye, and Wes Dyer. 2023. Learning to Learn to Predict Performance Regressions in Production at Meta. In2023 IEEE/ACM International Conference on Automation of Software Test (AST). 56––67. doi:10.1109/AST58925.2023.00010
-
[11]
Mohamed Bilel Besbes, Diego Elias Costa, Suhaib Mujahid, Gregory Mierzwinski, and Marco Castelluccio. 2025. A Dataset of Performance Measurements and Alerts from Mozilla (Data Artifact). InCompanion of the 16th ACM/SPEC International Conference on Performance Engineering (Toronto ON, Canada)(ICPE ’25). Association for Computing Machinery, New York, NY, US...
-
[12]
Albert Bifet and Ricard Gavaldà. 2007. Learning from Time-Changing Data with Adaptive Windowing. InProceedings of the 2007 SIAM International Conference on Data Mining. 443–448. doi:10.1137/1.9781611972771.42
-
[13]
Morton B. Brown and Alan B. Forsythe. 1974. Robust Tests for the Equality of Variances.J. Amer. Statist. Assoc.69, 346 (1974), 364––367. doi:10.1080/01621459.1974.10482955
-
[14]
Jinfu Chen and Weiyi Shang. 2017. An Exploratory Study of Performance Regression Introducing Code Changes. In2017 IEEE International Conference on Software Maintenance and Evolution (ICSME). 341––352. doi:10.1109/ICSME.2017.13
-
[15]
Jinfu Chen, Weiyi Shang, and Emad Shihab. 2022. PerfJIT: Test-Level Just-in-Time Prediction for Performance Regression Introducing Commits. IEEE Transactions on Software Engineering48, 5 (2022), 1529––1544. doi:10.1109/TSE.2020.3023955 Manuscript submitted to ACM 34 Besbes, Mierzwinski, Mujahid, Leitner, Serebrenik, Hunt, and Costa
-
[16]
Zhuangbin Chen, Jinyang Liu, Yuxin Su, Hongyu Zhang, Xiao Ling, Yongqiang Yang, and Michael R. Lyu. 2022. Adaptive performance anomaly detection for online service systems via pattern sketching. InProceedings of the 44th International Conference on Software Engineering(Pittsburgh, Pennsylvania)(ICSE ’22). Association for Computing Machinery, New York, NY,...
-
[17]
2012.How One Second Could Cost Amazon $1.6 Billion In Sales
Fast Company. 2012.How One Second Could Cost Amazon $1.6 Billion In Sales. https://www.fastcompany.com/1825005/how-one-second-could-cost- amazon-16-billion-sales
arXiv 2012
-
[18]
Diego Costa, Cor-Paul Bezemer, Philipp Leitner, and Artur Andrzejak. 2021. What’s Wrong with My Benchmark Results? Studying Bad Practices in JMH Benchmarks.IEEE Transactions on Software Engineering47, 7 (2021), 1452––1467. doi:10.1109/TSE.2019.2925345
-
[19]
Harald Cramér. 1928. On the composition of elementary errors.Scandinavian Actuarial Journal1928, 1 (1928), 13––74. doi:10.1080/03461238.1928.10 416862
-
[20]
David Daly. 2021. Creating a Virtuous Cycle in Performance Testing at MongoDB. InProceedings of the ACM/SPEC International Conference on Performance Engineering(Virtual Event, France)(ICPE ’21). Association for Computing Machinery, New York, NY, USA, 33––41. doi:10.1145/342792 1.3450234
-
[21]
David Daly, William Brown, Henrik Ingo, Jim O’Leary, and David Bradford. 2020. The Use of Change Point Detection to Identify Software Performance Regressions in a Continuous Integration System. InProceedings of the ACM/SPEC International Conference on Performance Engineering (Edmonton AB, Canada)(ICPE ’20). Association for Computing Machinery, New York, N...
-
[22]
Janez Demšar. 2006. Statistical Comparisons of Classifiers over Multiple Data Sets.J. Mach. Learn. Res.7 (Dec. 2006), 1––30. doi:10.5555/1248547.12 48548
-
[23]
2022.TCPDBench
Simon Eismann. 2022.TCPDBench. https://github.com/SimonEismann/TCPDBench/tree/master
2022
-
[24]
Emelie Engström, Margaret-Anne Storey, Per Runeson, Martin Höst, and Maria Teresa Baldassarre. 2020. How software engineering research aligns with design science: a review.Empirical Software Engineering25, 4 (July 2020), 2630––2660. doi:10.1007/s10664-020-09818-7
-
[25]
Paul Fearnhead and Guillem Rigaill. 2019. Changepoint Detection in the Presence of Outliers.J. Amer. Statist. Assoc.114, 525 (2019), 169––183. doi:10.1080/01621459.2017.1385466
-
[26]
Piotr Fryzlewicz. 2014. WILD BINARY SEGMENTATION FOR MULTIPLE CHANGE-POINT DETECTION.The Annals of Statistics42, 6 (2014), 2243––2281. doi:10.1214/14-AOS1245
-
[27]
Heitor Murilo Gomes, Jacob Montiel, Saulo Martiello Mastelini, Bernhard Pfahringer, and Albert Bifet. 2020. On Ensemble Techniques for Data Stream Regression. In2020 International Joint Conference on Neural Networks (IJCNN). 1––8. doi:10.1109/IJCNN48605.2020.9206756
-
[28]
2020.Milliseconds Make Millions
Google and Deloitte. 2020.Milliseconds Make Millions. https://www.deloitte.com/content/dam/assets-zone2/ie/en/docs/services/consulting/2023/Mi lliseconds_Make_Millions_report.pdf
2020
-
[29]
Mark Grechanik, Chen Fu, and Qing Xie. 2012. Automatically finding performance problems with feedback-directed learning software testing. In 2012 34th International Conference on Software Engineering (ICSE). 156––166. doi:10.1109/ICSE.2012.6227197
-
[30]
2019.Robust-FPOP
guillemr. 2019.Robust-FPOP. https://github.com/guillemr/robust-fpop
2019
-
[31]
Francis Harchaoui, Zaïd Moulines, Éric, and Bach. 2008. Kernel change-point analysis. InProceedings of the 22nd International Conference on Neural Information Processing Systems(Vancouver, British Columbia, Canada)(NIPS’08). Curran Associates Inc., Red Hook, NY, USA, 609––616. doi:10.5555/2981780.2981856
-
[32]
Christoph Heger, Jens Happe, and Roozbeh Farahbod. 2013. Automated root cause isolation of performance regressions during software development. InProceedings of the 4th ACM/SPEC International Conference on Performance Engineering(Prague, Czech Republic)(ICPE ’13). Association for Computing Machinery, New York, NY, USA, 27––38. doi:10.1145/2479871.2479879
-
[33]
Alan R. Hevner, Salvatore T. March, Jinsoo Park, and Sudha Ram. 2004. Design science in information systems research.MIS Q.28, 1 (March 2004), 75––105. doi:10.5555/2017212.2017217
-
[34]
David V. Hinkley. 1970. Inference about the change-point in a sequence of random variables.Biometrika57, 1 (04 1970), 1––17. doi:10.1093/biomet /57.1.1
-
[35]
Husari, Abdulrahman and Taherpour, Sepehr. 2024. Enhanced Techniques for Detecting Performance Abnormalities in Software Quality Assurance Processes. Student Paper
2024
-
[36]
Henrik Ingo. 2025. 8 Years of Optimizing Apache Otava: How disconnected open source developers took an algorithm from n3 to constant time. arXiv:2505.06758 [cs.PF] https://arxiv.org/abs/2505.06758
arXiv 2025
-
[37]
Nicholas A. James and David S. Matteson. 2015. ecp: An R Package for Nonparametric Multiple Change Point Analysis of Multivariate Data.Journal of Statistical Software62, 7 (2015), 1––25. doi:10.18637/jss.v062.i07
-
[38]
Hiranya Jayathilaka, Chandra Krintz, and Rich Wolski. 2020. Detecting Performance Anomalies in Cloud Platform Applications .IEEE Transactions on Cloud Computing8, 03 (July 2020), 764––777. doi:10.1109/TCC.2018.2808289
-
[39]
Frank J. Massey Jr. 1951. The Kolmogorov-Smirnov Test for Goodness of Fit.J. Amer. Statist. Assoc.46, 253 (1951), 68––78. doi:10.1080/01621459.195 1.10500769
-
[40]
Iurii Katser, Viacheslav Kozitsin, Victor Lobachev, and Ivan Maksimov. 2021. Unsupervised Offline Changepoint Detection Ensembles.Applied Sciences11, 9 (2021). doi:10.3390/app11094280
-
[41]
Rebecca Killick and Idris A. Eckley. 2014. changepoint: An R Package for Changepoint Analysis.Journal of Statistical Software58, 3 (2014), 1––19. https://www.jstatsoft.org/article/view/v058i03 Manuscript submitted to ACM Exploring Statistical Change Point Detection Techniques for Performance Anomaly Detection at Mozilla 35
2014
-
[42]
R. Killick, P. Fearnhead, and I. A. Eckley. 2012. Optimal Detection of Changepoints With a Linear Computational Cost.J. Amer. Statist. Assoc.107, 500 (2012), 1590––1598. doi:10.1080/01621459.2012.737745
-
[43]
Ambika Kirkland, Shivam Mehta, Harm Lameris, Gustav Eje Henter, Eva Szekely, and Joakim Gustafson. 2023. Stuck in the MOS Pit: A Critical Analysis of MOS Test Methodology in TTS Evaluation. InProceedings of the 12th ISCA Speech Synthesis Workshop (SSW2023). 41––47. doi:10.21437/SSW.2023-7
-
[44]
Iman Kohyarnejadfard, Daniel Aloise, Michel R. Dagenais, and Mahsa Shakeri. 2021. A Framework for Detecting System Performance Anomalies Using Tracing Data Analysis.Entropy23, 8 (2021). doi:10.3390/e23081011
-
[45]
Gunnar Kudrjavets, Jeff Thomas, and Nachiappan Nagappan. 2022. The Evolving Landscape of Software Performance Engineering. InProceedings of the 26th International Conference on Evaluation and Assessment in Software Engineering(Gothenburg, Sweden)(EASE ’22). Association for Computing Machinery, New York, NY, USA, 260––261. doi:10.1145/3530019.3534977
-
[46]
Christoph Laaber, Joel Scheuner, and Philipp Leitner. 2019. Software Microbenchmarking in the Cloud. How Bad Is It Really?Empirical Software Engineering24, 4 (Aug. 2019), 2469––2508. doi:10.1007/s10664-019-09681-1
-
[47]
Donghun Lee, Sang K. Cha, and Arthur H. Lee. 2012. A Performance Anomaly Detection and Analysis Framework for DBMS Development.IEEE Transactions on Knowledge and Data Engineering24, 8 (2012), 1345–1360. doi:10.1109/TKDE.2011.88
-
[48]
Yixiao Li, Gloria Lin, Thomas Lau, and Ruochen Zeng. 2019. A Review of Changepoint Detection Models. arXiv:1908.07136 [stat.ML] https: //arxiv.org/abs/1908.07136
arXiv 2019
-
[49]
R.A. Likert. 1932. A technique for the measurement of attitudes.Archives of Psychology22, 140 (1932), 5––55
1932
-
[50]
Xutong Liu, Yufei Zhou, Yutian Tang, Junyan Qian, and Yuming Zhou. 2025. Human-in-the-loop online just-in-time software defect prediction: What have we achieved and what do we still miss?Science of Computer Programming244 (2025), 103296. doi:10.1016/j.scico.2025.103296
-
[51]
2025.ALIBI Detect
Seldon Technologies Ltd. 2025.ALIBI Detect. https://docs.seldon.io/projects/alibi-detect/en/latest/index.html
2025
-
[52]
James M. Lucas and Michael S. Saccucci. 1990. Exponentially Weighted Moving Average Control Schemes: Properties and Enhancements. Technometrics32, 1 (1990), 1––12. doi:10.1080/00401706.1990.10484583
-
[53]
Zhan Lyu, Thomas Bach, Yong Li, Nguyen Minh Le, and Lars Hoemke. 2024. BIPeC: A Combined Change-Point Analyzer to Identify Performance Regressions in Large-scale Database Systems. In2024 IEEE International Conference on Software Maintenance and Evolution (ICSME). 808––819. doi:10.1109/ICSME58944.2024.00084
-
[54]
H. B. Mann and D. R. Whitney. 1947. On a Test of Whether one of Two Random Variables is Stochastically Larger than the Other.The Annals of Mathematical Statistics18, 1 (1947), 50––60. doi:10.1214/aoms/1177730491
-
[55]
Aleksander Maricq, Dmitry Duplyakin, Ivo Jimenez, Carlos Maltzahn, Ryan Stutsman, and Robert Ricci. 2018. Taming performance variability. In Proceedings of the 13th USENIX Conference on Operating Systems Design and Implementation(Carlsbad, CA, USA)(OSDI’18). USENIX Association, USA, 409––425. doi:10.5555/3291168.3291198
-
[56]
Florian Markusse, Philipp Leitner, and Alexander Serebrenik. 2022. Using Benchmarking Bots for Continuous Performance Assessment.IEEE Softw. 39, 5 (2022), 50––55. doi:10.1109/MS.2022.3184430
-
[57]
D.R. Martin, C.C. Fowlkes, and J. Malik. 2004. Learning to detect natural image boundaries using local brightness, color, and texture cues.IEEE Transactions on Pattern Analysis and Machine Intelligence26, 5 (2004), 530––549. doi:10.1109/TPAMI.2004.1273918
-
[58]
Journal of the American Statistical Association , author =
David S. Matteson and Nicholas A. James. 2014. A Nonparametric Approach for Multiple Change Point Analysis of Multivariate Data.J. Amer. Statist. Assoc.109, 505 (2014), 334––345. doi:10.1080/01621459.2013.849605
-
[59]
Sara E. McBride, Wendy A. Rogers, and Arthur D. Fisk. 2014. Understanding human management of automation errors.Theoretical Issues in Ergonomics Science15, 6 (2014), 545––577. doi:10.1080/1463922X.2013.817625 PMID: 25383042
-
[60]
2024.E Divisive CPD Method
MongoDB. 2024.E Divisive CPD Method. https://pypi.org/project/signal-processing-algorithms/
2024
-
[61]
Jacob Montiel, Max Halford, Saulo Martiello Mastelini, Geoffrey Bolmier, Raphael Sourty, Robin Vaysse, Adil Zouitine, Heitor Murilo Gomes, Jesse Read, Talel Abdessalem, and Albert Bifet. 2021. River: machine learning for streaming data in Python.J. Mach. Learn. Res.22, 1, Article 110 (Jan. 2021), 8 pages. doi:10.5555/3546258.3546368
-
[62]
2026.Autoland code repository
Mozilla. 2026.Autoland code repository. https://hg.mozilla.org/integration/autoland/
2026
-
[63]
2026.Mozilla’s Perfherder dashboard
Mozilla. 2026.Mozilla’s Perfherder dashboard. https://treeherder.mozilla.org/perfherder/alerts/
2026
-
[64]
2026.Replication Package
Mozilla. 2026.Replication Package. https://github.com/mozilla/REALISE-Performance
2026
-
[65]
BONNIE M. MUIR and NEVILLE MORAY. 1996. Trust in automation. Part II. Experimental studies of trust and human intervention in a process control simulation.Ergonomics39, 3 (1996), 429––460. doi:10.1080/00140139608964474 PMID: 8849495
-
[66]
Todd Mytkowicz, Amer Diwan, Matthias Hauswirth, and Peter F. Sweeney. 2009. Producing wrong data without doing anything obviously wrong!. InProceedings of the 14th International Conference on Architectural Support for Programming Languages and Operating Systems(Washington, DC, USA)(ASPLOS XIV). Association for Computing Machinery, New York, NY, USA, 265––...
-
[67]
Stefan Mühlbauer, Sven Apel, and Norbert Siegmund. 2019. Accurate Modeling of Performance Histories for Evolving Software Systems. In2019 34th IEEE/ACM International Conference on Automated Software Engineering (ASE). 640––652. doi:10.1109/ASE.2019.00065
-
[68]
Adrian Nistor, Po-Chun Chang, Cosmin Radoi, and Shan Lu. 2015. CARAMEL: Detecting and Fixing Performance Problems That Have Non-Intrusive Fixes. In2015 IEEE/ACM 37th IEEE International Conference on Software Engineering, Vol. 1. 902––912. doi:10.1109/ICSE.2015.100
-
[69]
Oscar Hernan Madrid Padilla, Alex Athey, Alex Reinhart, and James G. Scott. 2019. Sequential Nonparametric Tests for a Change in Distribution: An Application to Detecting Radiological Anomalies.J. Amer. Statist. Assoc.114, 526 (2019), 514––528. doi:10.1080/01621459.2018.1476245
-
[70]
E. S. Page. 1954. Continuous Inspection Schemes.Biometrika41, 1/2 (1954), 100––115. doi:10.2307/2333009 Manuscript submitted to ACM 36 Besbes, Mierzwinski, Mujahid, Leitner, Serebrenik, Hunt, and Costa
-
[71]
2019.ocp: Bayesian Online Changepoint Detection
Andrea Pagotto. 2019.ocp: Bayesian Online Changepoint Detection. https://CRAN.R-project.org/package=ocp
2019
-
[72]
Shravan Pargaonkar. 2023. A Comprehensive Review of Performance Testing Methodologies and Best Practices: Software Quality Engineering. International Journal of Science and Research12, 8 (2023), 2008––2014. doi:10.21275/SR23822111402
-
[73]
Christoph Raab, Moritz Heusinger, and Frank-Michael Schleif. 2020. Reactive Soft Prototype Computing for Concept Drift Streams.Neurocomputing 416 (2020), 340––351. doi:10.1016/j.neucom.2019.11.111
-
[74]
Raghu Ramakrishnan and Arvinder Kaur. 2017. Technique for Detecting Early-Warning Signals of Performance Deterioration in Large Scale Software Systems. InProceedings of the 8th ACM/SPEC on International Conference on Performance Engineering(L’Aquila, Italy)(ICPE ’17). Association for Computing Machinery, New York, NY, USA, 213––222. doi:10.1145/3030207.3044533
-
[75]
David Georg Reichelt and Stefan Kühne. 2018. How to Detect Performance Changes in Software History: Performance Analysis of Software System Versions. InCompanion of the 2018 ACM/SPEC International Conference on Performance Engineering(Berlin, Germany)(ICPE ’18). Association for Computing Machinery, New York, NY, USA, 183––188. doi:10.1145/3185768.3186404
-
[76]
Martin P. Robillard, Deeksha M. Arya, Neil A. Ernst, Jin L. C. Guo, Maxime Lamothe, Mathieu Nassif, Nicole Novielli, Alexander Serebrenik, Igor Steinmacher, and Klaas-Jan Stol. 2024. Communicating Study Design Trade-offs in Software Engineering.ACM Trans. Softw. Eng. Methodol.33, 5 (2024), 112:1––112:10. doi:10.1145/3649598
-
[77]
Gordon J. Ross and Niall M. Adams. 2012. Two Nonparametric Control Charts for Detecting Arbitrary Distribution Changes.Journal of Quality Technology44, 2 (2012), 102––116. doi:10.1080/00224065.2012.11917887
-
[78]
2025.Cramér-von Mises test implementation in scipy.stats
SciPy. 2025.Cramér-von Mises test implementation in scipy.stats. https://docs.scipy.org/doc/scipy/reference/generated/scipy.stats.cramervonmises_ 2samp.html
2025
-
[79]
2025.Kolmogorov-Smirnov implementation in scipy.stats
SciPy. 2025.Kolmogorov-Smirnov implementation in scipy.stats. https://docs.scipy.org/doc/scipy/reference/generated/scipy.stats.ks_2samp.html
2025
-
[80]
2025.Levene test implementation in scipy.stats
SciPy. 2025.Levene test implementation in scipy.stats. https://docs.scipy.org/doc/scipy/reference/generated/scipy.stats.levene.html
2025
discussion (0)
Sign in with ORCID, Apple, or X to comment. Anyone can read and Pith papers without signing in.