Testing X-ray selection effects with four rich, yet X--ray--faint, galaxy clusters
Pith reviewed 2026-06-26 19:45 UTC · model grok-4.3
The pith
Four rich galaxy clusters show X-ray luminosities suppressed by one dex relative to their optical richness, making them undetectable in surveys like eROSITA.
A machine-rendered reading of the paper's core claim, the machinery that carries it, and where it could break.
Core claim
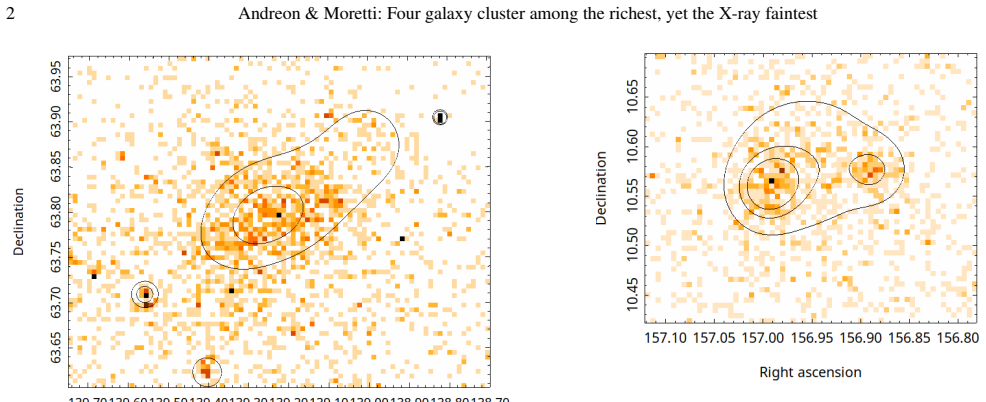
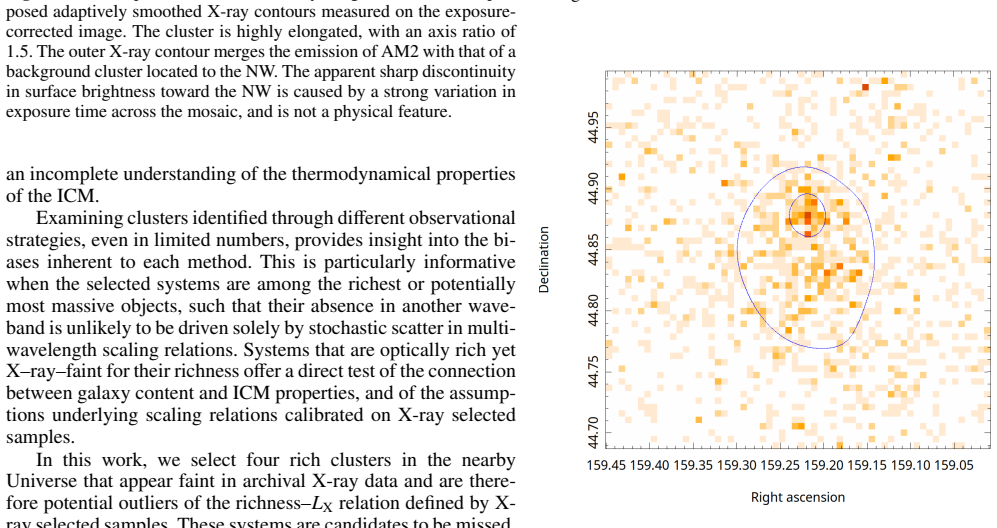
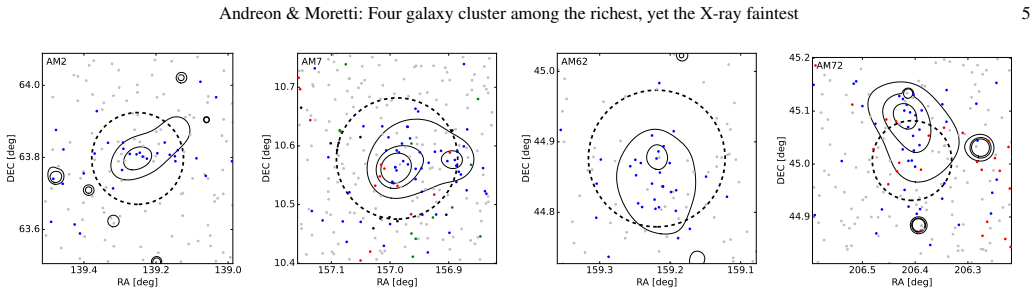
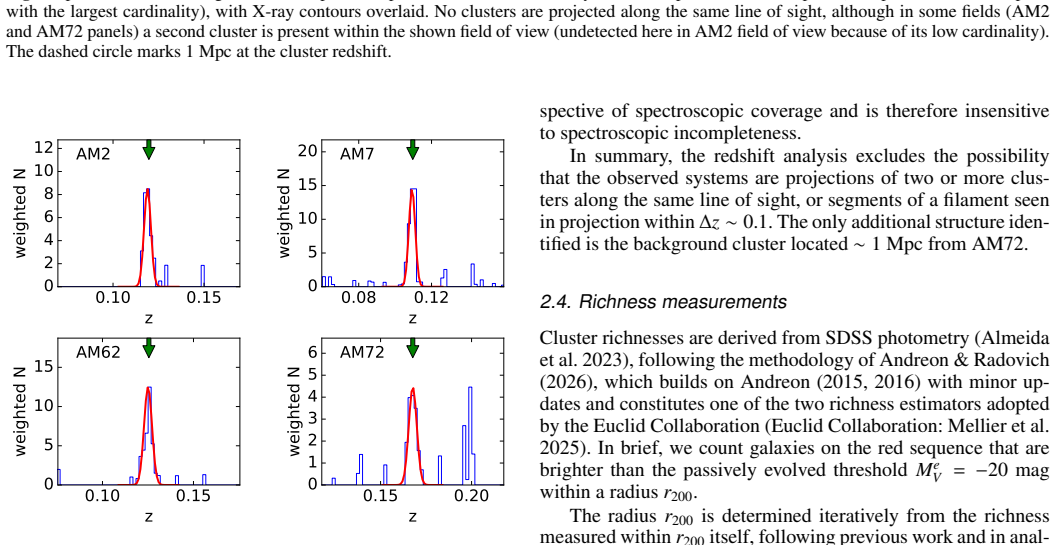
Four galaxy clusters with optical richness implying log M200/M⊙ ∼ 14.6 exhibit low central X-ray surface brightness, multiple X-ray peaks or high axis ratios, and total X-ray luminosities suppressed by roughly one dex compared with the expectation from richness, rendering them undetectable in current X-ray surveys while remaining visible through optical selection.
What carries the argument
The direct comparison of Euclid baseline optical richness to deep XRT X-ray luminosity and morphology for these four systems, used to quantify the suppression and to rule out projections via shared redshifts of substructures.
If this is right
- X-ray surveys such as eROSITA miss a non-negligible fraction of rich clusters at z < 0.3.
- Cluster samples selected in X-rays under-represent the full range of dynamical states and luminosities present in the population.
- Optical or richness-based selection is required to obtain complete samples for cosmological and astrophysical studies.
- The fraction of X-ray faint rich clusters is at least 20 percent based on the current small sample.
Where Pith is reading between the lines
- Mass-observable relations calibrated only on X-ray detected clusters may systematically overestimate the X-ray luminosity at fixed mass.
- Similar X-ray faint systems could exist at higher redshift and affect future surveys if their fraction does not decrease.
- The physical origin of the suppressed X-ray emission (merger-driven gas displacement or other processes) needs targeted follow-up to understand the selection bias mechanism.
Load-bearing premise
Optical richness from the Euclid estimator gives an unbiased mass for these disturbed clusters and the spectroscopic data fully exclude line-of-sight projections.
What would settle it
Deeper X-ray observations or weak-lensing mass measurements showing that the true masses are at least one dex lower than the richness-implied values, eliminating the claimed suppression.
Figures


read the original abstract
A robust understanding of selection effects in galaxy cluster studies is crucial for both astrophysical and cosmological applications. Examining clusters identified through different observational strategies, even in small numbers, helps to illuminate potential biases inherent to each method. We selected four rich galaxy clusters in the Northern Hemisphere whose early Swift X-ray Telescope (XRT) observations indicated unusually low central X-ray emission, making them unlikely to be detected in X-ray surveys. Spectroscopic follow-up confirms that all four systems are genuine galaxy clusters, rather than projections of multiple clusters or groups along the line of sight. Their optical richness, estimated using one of the baseline Euclid cluster richness estimators, implies masses of $\log M_{200}/M_\odot \sim 14.6$ and independently confirms the absence of additional massive structures along the line of sight. Deep XRT follow-up reveals highly disturbed X-ray morphologies: three clusters exhibit at least two distinct X-ray peaks, while the remaining cluster has an axis ratio exceeding 1.5. Spectroscopy shows that galaxies associated with different parts share the same redshift, demonstrating that these substructures are physically connected rather than chance projections. These clusters display low central X-ray surface brightness and total X-ray luminosities suppressed by roughly one dex for their richness, making them undetectable in X-ray surveys as eROSITA. We estimate $\sim$20\% as a lower limit for the poorly sampled population, albeit based on a small sample. Our results demonstrate that even rich clusters in the northern $z<0.3$ Universe can be missed by X-ray selection and that the X-ray variety captured by X-ray surveys underestimates the true cluster diversity.
Editorial analysis
A structured set of objections, weighed in public.
Referee Report
Summary. The manuscript reports four optically rich galaxy clusters at z<0.3 in the northern sky whose Swift XRT data show low central surface brightness and X-ray luminosities suppressed by ~1 dex relative to their optical richness. Spectroscopic follow-up confirms physical association (shared redshifts for substructures) rather than line-of-sight projections, with three systems showing multiple X-ray peaks and one having axis ratio >1.5. Richness from a Euclid baseline estimator implies log M200/M⊙~14.6; the systems would be undetectable in eROSITA-like surveys. The authors conclude that ~20% is a lower limit on the fraction of such X-ray-faint rich clusters missed by X-ray selection, based on this sample of four.
Significance. If the richness-mass relation holds for these disturbed systems, the work provides concrete examples of selection bias in X-ray cluster surveys and illustrates that X-ray morphology alone under-samples cluster diversity. This has relevance for cosmological applications that rely on X-ray-selected samples. The small sample size and single mass proxy limit the strength of the quantitative fraction, but the qualitative demonstration of X-ray-faint rich clusters is a useful observational contribution.
major comments (3)
- [Abstract] Abstract: the ∼20% lower limit on the missed population is stated without reference to a parent optically selected catalog, explicit selection function, or completeness calculation; with N=4 the fraction remains sensitive to discovery biases and is under-constrained for a quantitative claim.
- [Abstract] Abstract: the mass inference log M200/M⊙∼14.6 rests on the Euclid baseline richness estimator remaining unbiased for these multi-peak, high-axis-ratio systems; no velocity-dispersion, dynamical, or weak-lensing mass is reported to test this assumption for substructured clusters.
- [Abstract] Abstract: spectroscopy rules out gross projections by showing shared redshifts, yet the manuscript does not quantify residual richness bias arising from substructure or report error bars on the derived masses, leaving the central mass-proxy step unverified.
minor comments (1)
- [Abstract] Abstract: the specific Euclid baseline richness estimator used is not named or referenced, hindering reproducibility of the mass estimates.
Simulated Author's Rebuttal
We thank the referee for the constructive comments on the abstract. We address each point below, agreeing where the presentation requires clarification and indicating planned revisions.
read point-by-point responses
-
Referee: [Abstract] Abstract: the ∼20% lower limit on the missed population is stated without reference to a parent optically selected catalog, explicit selection function, or completeness calculation; with N=4 the fraction remains sensitive to discovery biases and is under-constrained for a quantitative claim.
Authors: We agree that the ~20% lower limit is presented without a full parent catalog, selection function, or completeness calculation, and that N=4 makes it sensitive to discovery biases. The manuscript already qualifies the estimate as 'albeit based on a small sample' and intends it only as an illustrative lower bound on the missed population in the northern z<0.3 sky. We will revise the abstract to remove the numerical value, emphasize the qualitative demonstration of X-ray-faint rich clusters, and explicitly note the absence of a systematic completeness assessment. revision: yes
-
Referee: [Abstract] Abstract: the mass inference log M200/M⊙∼14.6 rests on the Euclid baseline richness estimator remaining unbiased for these multi-peak, high-axis-ratio systems; no velocity-dispersion, dynamical, or weak-lensing mass is reported to test this assumption for substructured clusters.
Authors: The mass values are derived exclusively from the Euclid baseline richness estimator applied to these systems. No velocity-dispersion, dynamical, or weak-lensing masses are available in the current dataset to cross-check the assumption for multi-peak or high-axis-ratio clusters. We will revise the text to state this limitation explicitly and add a caveat that the estimator is used as a baseline proxy without independent verification for disturbed systems. revision: yes
-
Referee: [Abstract] Abstract: spectroscopy rules out gross projections by showing shared redshifts, yet the manuscript does not quantify residual richness bias arising from substructure or report error bars on the derived masses, leaving the central mass-proxy step unverified.
Authors: Spectroscopy demonstrates shared redshifts across substructures, confirming physical association rather than projections. We have not quantified residual richness bias from substructure nor reported error bars on the richness-derived masses. We will revise to include any available uncertainties from the estimator and add discussion of possible substructure effects on richness, while noting that a detailed bias quantification lies beyond the scope of the present observations. revision: partial
- A complete optical parent catalog, selection function, and formal completeness calculation for the ~20% estimate, which would require a systematic all-sky optical search with defined criteria not performed in this work.
Circularity Check
No circularity: purely observational report using external mass proxy
full rationale
The paper selects four clusters via an external Euclid baseline richness estimator, performs direct X-ray observations with Swift XRT, confirms physical association via spectroscopy, and reports measured luminosities and morphologies. The ~20% lower-limit fraction is stated as a sample-based estimate without any internal fitting, prediction, or equation that reduces to the input data by construction. No self-citation chain, ansatz smuggling, or uniqueness theorem is invoked to support a derivation; all central quantities (richness-implied masses, X-ray luminosities) are either externally sourced or directly measured.
Axiom & Free-Parameter Ledger
axioms (1)
- domain assumption The Euclid baseline richness estimator supplies an unbiased mass proxy for these systems
Reference graph
Works this paper leans on
-
[1]
Abell, G. O. 1958, ApJS, 3,
1958
-
[2]
, year = 1958, month = may, volume =
doi:10.1086/190036 Almeida, A., Anderson, S. F., Argudo-Fern´andez, M., et al. 2023, ApJS, 267,
-
[3]
2003, A&A, 409,
Andreon, S. 2003, A&A, 409,
2003
-
[4]
2015, A&A, 582, A100
Andreon, S. 2015, A&A, 582, A100. Andreon, S. 2016, A&A, 587, A158. Andreon, S. & Moretti, A. 2011, A&A, 536, A37. Andreon, S. & Berg´e, J. 2012, A&A, 547, A117. Andreon, S. & Hurn, M. 2013, Statistical Analysis and Data Mining: The ASA Data Science Journal, 9, 1,
2015
-
[5]
& Radovich, M
Andreon, S. & Radovich, M. 2025, ApJ, 985, 1,
2025
-
[6]
& Radovich, M
Andreon, S. & Radovich, M. 2026, A&A, 705, A208. Andreon, S., de Propris, R., Puddu, E., et al. 2008, MNRAS, 383, 1,
2026
-
[7]
2009, A&A, 507, 1,
Andreon, S., Maughan, B., Trinchieri, G., et al. 2009, A&A, 507, 1,
2009
-
[8]
2011, MNRAS, 412, 4,
Andreon, S., Trinchieri, G., & Pizzolato, F. 2011, MNRAS, 412, 4,
2011
-
[9]
L., Moretti, A., et al
Andreon, S., Serra, A. L., Moretti, A., et al. 2016, A&A, 585, A147. Andreon, S., Moretti, A., Trinchieri, G., et al. 2019, A&A, 630, A78. Andreon, S., Trinchieri, G., & Moretti, A. 2022, MNRAS, 511, 4,
2016
-
[10]
2024, A&A, 686, A284
Andreon, S., Trinchieri, G., & Moretti, A. 2024, A&A, 686, A284. Bulbul, E., Liu, A., Pasini, T., et al. 2022, A&A, 661, A10. Bulbul, E., Liu, A., Kluge, M., et al. 2024, A&A, 685, A106. Burrows, D. N., Hill, J. E., Nousek, J. A., et al. 2005, Space Sci. Rev., 120, 3-4,
2024
-
[11]
2022, A&A, 661, A1
Brunner, H., Liu, T., Lamer, G., et al. 2022, A&A, 661, A1. Chandran, J., Remazeilles, M., & Barreiro, R. B. 2023, MNRAS, 526, 4,
2022
-
[12]
1980, A&A, 82,
Danese, L., de Zotti, G., & di Tullio, G. 1980, A&A, 82,
1980
-
[13]
P., Forman, W., & Jones, C
David, L. P., Forman, W., & Jones, C. 1999, ApJ, 519, 2,
1999
-
[14]
G., et al
DESI Collaboration, Abdul-Karim, M., Adame, A. G., et al. 2026, AJ, 171, 285 Ebeling, H., Edge, A. C., Bohringer, H., et al. 1998, MNRAS, 301, 4,
2026
-
[15]
A., & Rangarajan, F
Ebeling, H., White, D. A., & Rangarajan, F. V . N. 2006, MNRAS, 368, 1,
2006
-
[16]
2025, A&A, 697, A1
Euclid Collaboration, Mellier, Y ., Abdurro’uf, et al. 2025, A&A, 697, A1. Gioia, I. M., Henry, J. P., Maccacaro, T., et al. 1990, ApJ, 356, L35. Gladders, M. D. & Yee, H. K. C. 2000, AJ, 120, 4,
2025
-
[17]
E., Sheldon, E
Johnston, D. E., Sheldon, E. S., Tasitsiomi, A., et al. 2007, ApJ, 656, 1,
2007
-
[18]
2021, ApJS, 253,
Hilton, M., Sif´on, C., Naess, S., et al. 2021, ApJS, 253,
2021
-
[19]
P., McKay, T
Koester, B. P., McKay, T. A., Annis, J., et al. 2007, ApJ, 660, 1,
2007
-
[20]
W., Ebeling, H., et al
Mantz, A., Allen, S. W., Ebeling, H., et al. 2010, MNRAS, 406, 3,
2010
-
[21]
2024, A&A, 682, A34
Merloni, A., Lamer, G., Liu, T., et al. 2024, A&A, 682, A34. Miller, C. J., Nichol, R. C., Reichart, D., et al. 2005, AJ, 130, 3,
2024
-
[22]
2005, Proc
Moretti, A., Campana, S., Mineo, T., et al. 2005, Proc. SPIE, 5898,
2005
-
[23]
2019, Astro2020 Decadal Survey (arXiv:1903.04083) Pacaud, F., Pierre, M., Adami, C., et al
Mushotzky et al. 2019, Astro2020 Decadal Survey (arXiv:1903.04083) Pacaud, F., Pierre, M., Adami, C., et al. 2007, MNRAS, 382, 3,
Pith/arXiv arXiv 2019
-
[24]
2016, A&A, 592, A1
Pierre, M., Pacaud, F., Adami, C., et al. 2016, A&A, 592, A1. Piffaretti, R., Arnaud, M., Pratt, G. W., et al. 2011, A&A, 534, A109. Planck Collaboration, Ade, P. A. R., Aghanim, N., et al. 2014, A&A, 571, A29. Planck Collaboration, Adam, R., Ade, P. A. R., et al. 2016a, A&A, 594, A1. Planck Collaboration, Ade, P. A. R., Aghanim, N., et al. 2016b, A&A, 59...
2016
-
[25]
1995, ApJ, 445, L11
Rosati, P., Della Ceca, R., Burg, R., et al. 1995, ApJ, 445, L11. Shimwell, T. W., Hardcastle, M. J., Tasse, C., et al. 2022, A&A, 659, A1. Shirasaki, M., Sif ´on, C., Miyatake, H., et al. 2024, Phys. Rev. D, 110, 10, 103006. Smith, R. K., Brickhouse, N. S., Liedahl, D. A., & Raymond, J. C. 2001, ApJ, 556, L91 Sunyaev, R. A. & Zeldovich, Y . B. 1972, A&A, 20,
1995
-
[26]
V ., Burenin, R
Vikhlinin, A., Kravtsov, A. V ., Burenin, R. A., et al. 2009, ApJ, 692, 2,
2009
-
[27]
2019, Astro2020 Decadal Survey (arXiv:1903.04550) Willingale, R., Starling, R
Walker et al. 2019, Astro2020 Decadal Survey (arXiv:1903.04550) Willingale, R., Starling, R. L. C., Beardmore, A. P., et al. 2013, MNRAS, 431, 1,
Pith/arXiv arXiv 2019
-
[28]
et al., 1961-1968,Catalogue of Galaxies and of Cluster of Galaxies, (Pasadena:Caltech)
Zwicky F. et al., 1961-1968,Catalogue of Galaxies and of Cluster of Galaxies, (Pasadena:Caltech)
1961
discussion (0)
Sign in with ORCID, Apple, or X to comment. Anyone can read and Pith papers without signing in.