Dynamic Computerized Tumbling-E Testing for Temporal Reliability of Human Sequential Perceptual Decisions
Pith reviewed 2026-06-26 11:24 UTC · model grok-4.3
The pith
A dynamic tumbling-E task records timing and adaptation to build a temporal reliability benchmark for perceptual decisions.
A machine-rendered reading of the paper's core claim, the machinery that carries it, and where it could break.
Core claim
The paper claims that the dynamic computerized tumbling-E procedure, with its automatic staircase adjustment and trial-by-trial capture of latency and timeouts, converts the task into a temporally resolved human perceptual-decision benchmark whose primary output is a dataset containing 1154 valid trials, 1078 non-timeout responses, and an observable Temporal Hallucination Index derived from delay and timeout components.
What carries the argument
The adaptive staircase that automatically reduces or increases stimulus size on each trial while logging reaction time, timeout events, and delay rate to compute the Temporal Hallucination Index from those components.
If this is right
- Static accuracy scores can mask delays and unstable convergence that the new measures detect.
- Human responses remain fast with low timeout rates and converge smoothly toward threshold.
- The dataset supplies trial-level signals usable for direct comparison against artificial decision systems.
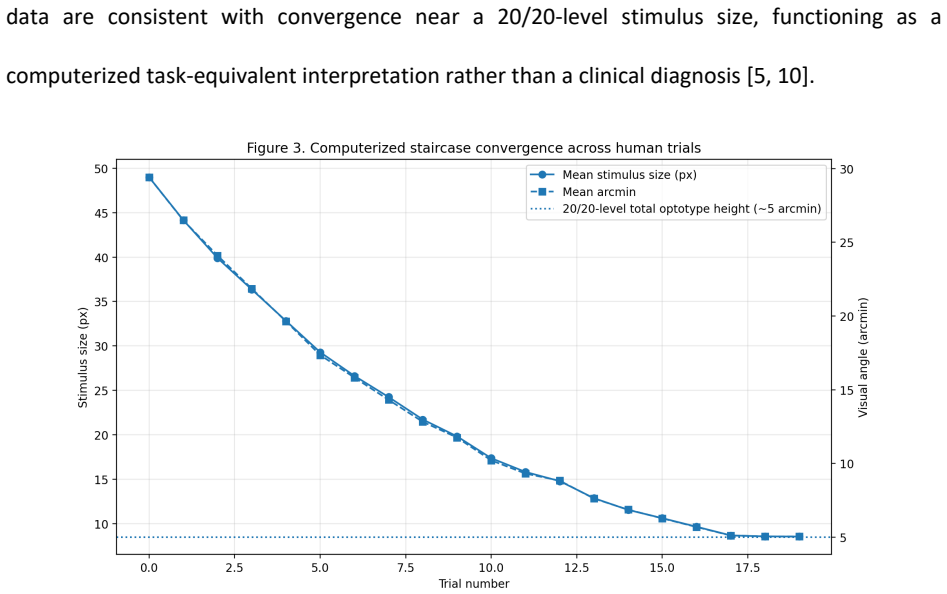
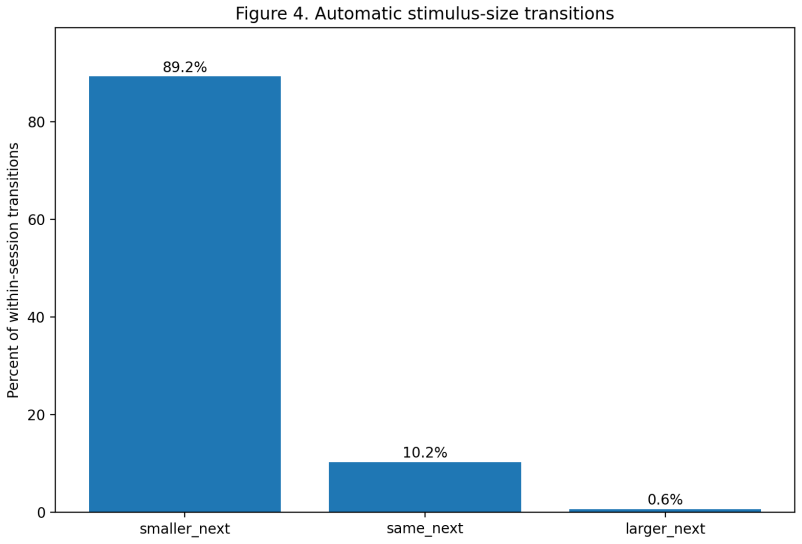
- Staircase behavior is dominated by transitions to smaller stimuli, reaching near 20/20 levels without clinical diagnosis.
Where Pith is reading between the lines
- The same recording setup could be applied to other sensory thresholds to test whether temporal reliability patterns generalize.
- If AI agents run the identical task, differences in timeout rates or adaptation speed would become directly observable.
- Requiring explicit formula and validation data for the THI would allow external checks on whether it adds information beyond raw timing statistics.
Load-bearing premise
The THI built from delay and timeout data supplies a meaningful and comparable index of temporal reliability.
What would settle it
Demonstration that the recorded timing and adaptation patterns fail to separate stable from unstable perceptual sequences across repeated sessions would remove the dataset's claimed value as a reliability benchmark.
Figures


read the original abstract
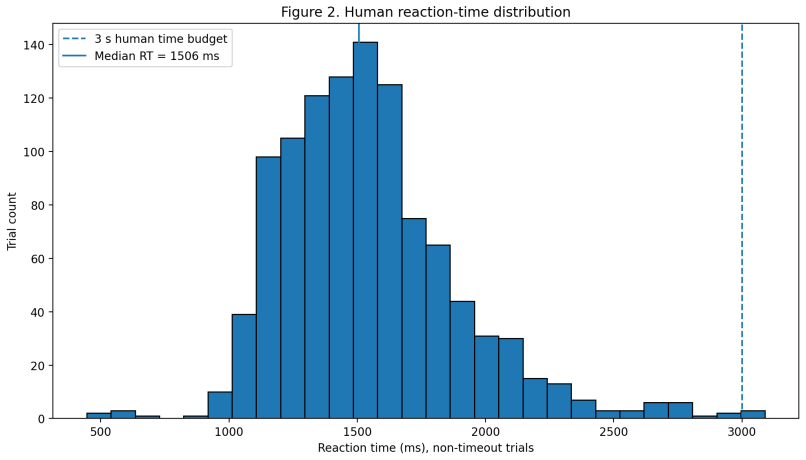
OBJECTIVES: Visual acuity and tumbling-E tasks are often treated as static threshold measures, yet sequential perceptual decisions unfold over time. A computerized tumbling-E task preserves response latency, timeouts, and stimulus-size adaptation, creating a temporal reliability dataset rather than only a chart-line score. This matters for human-AI comparison because the Temporal Hallucination Index (THI) shows how static accuracy can obscure delays, drift, persistence, and unstable convergence. METHODS: We curated trial-level human data from a computerized dynamic tumbling-E task. On each trial, a single E optotype appeared in one of four orientations, participants selected the perceived direction or timed out, and stimulus size was automatically adjusted through an adaptive staircase. Primary outcomes were reaction time, timeout rate, delay rate above a 3-second budget, and observable THI based on delay and timeout components. RESULTS: The final dataset included 1,154 valid trials from 21 human identifiers across 77 sessions. There were 1,078 non-timeout responses and 76 timeouts, giving a 6.6% timeout rate. Non-timeout reaction times centered near 1.5 seconds (mean 1546 ms; median 1506 ms; IQR 1306-1713 ms), with only 3 responses exceeding 3,000 ms. Adaptation was dominated by smaller-next-stimulus transitions (89.2%). Mean arcminutes declined from 29.42 at trial 0 to 5.04 at trial 19, supporting convergence near a 20/20-level optotype without clinical acuity diagnosis. CONCLUSIONS: This dataset converts a tumbling-E visual task into a temporally resolved human perceptual-decision benchmark. Its novel contribution is automatic capture of staircase behavior, response timing, timeouts, and trial-level reliability signals. The human data show fast timing and smooth adaptation toward threshold, establishing a human-only baseline for future comparison with artificial agents.
Editorial analysis
A structured set of objections, weighed in public.
Referee Report
Summary. The manuscript curates and describes a dataset of 1,154 valid trials from a dynamic computerized tumbling-E optotype task performed by 21 human participants across 77 sessions. It reports reaction times (mean 1546 ms), timeout rates (6.6%), stimulus-size adaptation via staircase, and introduces the Temporal Hallucination Index (THI) constructed from delay and timeout components as a temporally resolved reliability signal intended to serve as a human baseline for future human-AI perceptual-decision comparisons.
Significance. A well-documented, trial-level dataset with timing and adaptation metadata could provide a useful empirical reference for studies of sequential perceptual decisions. However, because the THI—the index positioned as the key novel temporal-reliability construct—is never defined, the manuscript’s central claim that the data reveal delays, drift, and unstable convergence hidden by static accuracy cannot be evaluated or reproduced.
major comments (3)
- [Abstract] Abstract and Results: The THI is repeatedly invoked as the observable that 'shows how static accuracy can obscure delays, drift, persistence, and unstable convergence' and as the basis for the human-AI benchmark, yet no formula, weighting of delay versus timeout components, or computational definition is supplied anywhere in the manuscript.
- [Results] Methods/Results: No validation of the THI is reported against established reliability metrics (test-retest, split-half, or signal-detection d'), nor is any correlation or comparison with conventional acuity scores provided; without this the claim that THI supplies a 'meaningful and comparable measure of temporal reliability' remains unsupported.
- [Methods] Methods: Participant recruitment, inclusion/exclusion criteria, session structure, exact staircase algorithm, and timeout threshold definition are not described, preventing independent assessment of the reported counts (1,154 valid trials, 76 timeouts) and adaptation statistics.
minor comments (1)
- [Abstract] The abstract states 'Mean arcminutes declined from 29.42 at trial 0 to 5.04 at trial 19' but does not specify whether these values are means across participants or sessions, or how trial numbering is aligned across variable-length staircases.
Simulated Author's Rebuttal
We thank the referee for their thorough review and valuable comments on our manuscript. We address each of the major comments below and plan to revise the manuscript to incorporate the necessary clarifications and additions.
read point-by-point responses
-
Referee: [Abstract] Abstract and Results: The THI is repeatedly invoked as the observable that 'shows how static accuracy can obscure delays, drift, persistence, and unstable convergence' and as the basis for the human-AI benchmark, yet no formula, weighting of delay versus timeout components, or computational definition is supplied anywhere in the manuscript.
Authors: We agree that the manuscript does not provide an explicit formula for the THI. The THI is described as being based on delay and timeout components, but the specific computational definition, including any weighting, was inadvertently omitted. We will include a clear mathematical definition of the THI in the revised Methods section. revision: yes
-
Referee: [Results] Methods/Results: No validation of the THI is reported against established reliability metrics (test-retest, split-half, or signal-detection d'), nor is any correlation or comparison with conventional acuity scores provided; without this the claim that THI supplies a 'meaningful and comparable measure of temporal reliability' remains unsupported.
Authors: The primary aim of this manuscript is to curate and describe the dataset as a baseline for future human-AI comparisons, rather than to fully validate the THI metric here. However, we recognize that demonstrating its relation to established metrics would enhance the paper. Since the dataset includes multiple sessions per participant, we will add test-retest reliability analyses and correlations with acuity measures in the revised version where feasible. revision: partial
-
Referee: [Methods] Methods: Participant recruitment, inclusion/exclusion criteria, session structure, exact staircase algorithm, and timeout threshold definition are not described, preventing independent assessment of the reported counts (1,154 valid trials, 76 timeouts) and adaptation statistics.
Authors: We acknowledge that these methodological details are missing from the current manuscript. We will expand the Methods section to fully describe participant recruitment and inclusion/exclusion criteria, session structure, the exact staircase algorithm used for stimulus-size adaptation, and the definition of the timeout threshold. This will enable readers to independently verify the reported trial counts and statistics. revision: yes
Circularity Check
No circularity; purely empirical dataset report with no derivation or fitted predictions
full rationale
The manuscript presents summary statistics from 1,154 human trials in a tumbling-E task, including reaction times, timeout rates, and adaptation behavior. No equations, parameter fitting, predictions, or first-principles derivations are described that could reduce to inputs by construction. The THI is mentioned as an observable based on delay and timeout components but is not used in any load-bearing derivation or self-referential definition within the provided text. All reported outcomes are direct empirical aggregates, making the work self-contained against external benchmarks with no circular steps.
Axiom & Free-Parameter Ledger
invented entities (1)
-
Temporal Hallucination Index (THI)
no independent evidence
Reference graph
Works this paper leans on
-
[1]
Division of Translational Neuroscience, Department of Clinical Neurosciences, Hotchkiss Brain Institute, University of Calgary, Calgary, AB T2N 4N1, Canada To whom corresponding should be addressed: Professor Bin Hu MD. Ph.D. Suter Professor for Parkinson’s Disease Research Founder and Director Open Digital Health (OpenDH) Program of University of Calgary...
1964
-
[2]
Applying new design principles to the construction of an illiterate E chart
Taylor HR. Applying new design principles to the construction of an illiterate E chart. Am J Optom Physiol Opt. 1978;55(5):348-351
1978
-
[3]
New design principles for visual acuity letter charts
Bailey IL, Lovie JE. New design principles for visual acuity letter charts. Am J Optom Physiol Opt. 1976;53(11):740-745
1976
-
[4]
New visual acuity charts for clinical research
Ferris FL 3rd, Kassoff A, Bresnick GH, Bailey I. New visual acuity charts for clinical research. Am J Ophthalmol. 1982;94(1):91-96
1982
-
[5]
Visual acuity testing
Bailey IL, Lovie-Kitchin JE. Visual acuity testing. From the laboratory to the clinic. Vision Res. 2013;90:2-9
2013
-
[6]
Illiterate E visual acuity charts: historical and technical overview
Shute DV. Illiterate E visual acuity charts: historical and technical overview. Ophthalmic Physiol Opt. 2002;22(4):271-279
2002
-
[7]
Making sense of visual acuity data
Johnston AW. Making sense of visual acuity data. Clin Exp Optom. 1991;74(5):146-154
1991
-
[8]
The effect of structural layout on the reliability of letter charts
Rosser DA, Murdoch IE, Cousens SN. The effect of structural layout on the reliability of letter charts. Invest Ophthalmol Vis Sci. 2004;45(9):3060-3065
2004
-
[9]
The Freiburg Visual Acuity Test - automatic measurement of visual acuity
Bach M. The Freiburg Visual Acuity Test - automatic measurement of visual acuity. Optom Vis Sci. 1996;73(1):49-53
1996
-
[10]
Computer-based quantification of cortical visual function
Strasburger H. Computer-based quantification of cortical visual function. Front Human Neurosci. 2011;5:117
2011
-
[11]
Transformed up-down methods in psychoacoustics
Levitt H. Transformed up-down methods in psychoacoustics. J Acoust Soc Am. 1971;49(2B):467-477
1971
-
[12]
QUEST: a Bayesian adaptive psychometric method
Watson AB, Pelli DG. QUEST: a Bayesian adaptive psychometric method. Percept Psychophys. 1983;33(2):113-120
1983
-
[13]
Adaptive psychophysical procedures
Treutwein B. Adaptive psychophysical procedures. Vision Res. 1995;35(17):2503-2522
1995
-
[14]
Criteria for the choice and evaluation of psychophysical telemetry benchmarks
Gorea A, Caetta F, Sagi D. Criteria for the choice and evaluation of psychophysical telemetry benchmarks. J Vision. 2005;5(4):311-324
2005
-
[15]
The Temporal Hallucination Index (THI): A framework for quantifying sequential instabilities in human and artificial vision
Sandhu A, Hu B. The Temporal Hallucination Index (THI): A framework for quantifying sequential instabilities in human and artificial vision. Canadian Open Digital Health Protocols. 2025;3(1):45-58. 21
2025
-
[16]
Temporal consistency and drift evaluation frameworks for computer vision systems
Zhang Y, Hughes JW, Ermon S. Temporal consistency and drift evaluation frameworks for computer vision systems. IEEE Trans Pattern Anal Mach Intell. 2024;46(2):1012-1025
2024
-
[17]
Survey of hallucination in large vision-language models
Ji Ziwei, Lee N, Frieske R, et al. Survey of hallucination in large vision-language models. ACM Comput Surv. 2024;56(8):1-34
2024
-
[18]
Beyond accuracy: Evaluating the temporal stability of sequential deep neural net classifications
Wang F, Zhou L, Science S. Beyond accuracy: Evaluating the temporal stability of sequential deep neural net classifications. Int J Comput Vis. 2025;133(3):412-429
2025
-
[19]
A theory of memory retrieval
Ratcliff R. A theory of memory retrieval. Psychol Rev. 1978;85(2):59-108
1978
-
[20]
A comparison of sequential sampling models for two-choice reaction time
Ratcliff R, Smith PL. A comparison of sequential sampling models for two-choice reaction time. Psychol Rev. 2004;111(2):333-367
2004
-
[21]
The effect of stimulus intensity on the response time in a visual discrimination task
Palmer J, Huk AC, Shadlen MN. The effect of stimulus intensity on the response time in a visual discrimination task. J Vision. 2005;5(5):376-404
2005
-
[22]
The neural basis of decision making
Gold JI, Shadlen MN. The neural basis of decision making. Annu Rev Neurosci. 2007;30:535-574
2007
-
[23]
Speed-accuracy tradeoff and visual signal detection
Wickelgren WA. Speed-accuracy tradeoff and visual signal detection. Percept Psychophys. 1977;22(2):119-124
1977
-
[24]
Sequential sampling models in cognitive neuroscience: Advantages, applications, and extensions
Forstmann BU, Ratcliff R, Wagenmakers EJ. Sequential sampling models in cognitive neuroscience: Advantages, applications, and extensions. Annu Rev Psychol. 2016;67:641-666
2016
-
[25]
Automated computerized near visual acuity assessment: Challenges of calibration and viewing distance control
Bennett CR, Bex PJ. Automated computerized near visual acuity assessment: Challenges of calibration and viewing distance control. Front Digit Health. 2021;3:698502
2021
-
[26]
Geirhos R, Rubisch P, Michaelis C, et al. ImageNet-trained CNNs are biased towards texture; increasing shape bias improves robustness and human relevance. arXiv preprint arXiv:1811.12231
-
[27]
Segregation of form, color, movement, and depth: Anatomy, physiology, and perception
Livingstone MS, Hubel DH. Segregation of form, color, movement, and depth: Anatomy, physiology, and perception. Science. 1988;240(4853):740-749
1988
-
[28]
Strike (a pose): Neural networks are easily fooled by strange object poses
Alcorn MA, Li L, Zhang L, et al. Strike (a pose): Neural networks are easily fooled by strange object poses. CVPR. 2019;4845-4854
2019
-
[29]
Cognition does not affect perception: Evaluating the evidence for 'top-down' effects
Firestone C, Scholl BJ. Cognition does not affect perception: Evaluating the evidence for 'top-down' effects. Behav Brain Sci. 2016;39:e229
2016
-
[30]
Rapid and objective measurement of visual acuity function
Dorr M, Lesmes LA, Lu ZL, Bex PJ. Rapid and objective measurement of visual acuity function. Invest Ophthalmol Vis Sci. 2013;54(13):8112-8119
2013
discussion (0)
Sign in with ORCID, Apple, or X to comment. Anyone can read and Pith papers without signing in.