Detection of Variability in Seyfert 2 Galaxies and Measurement of the Optical Scattering Region Size
Pith reviewed 2026-06-26 08:13 UTC · model grok-4.3
The pith
Seyfert 2 galaxies exhibit optical variability consistent with scattering over a torus-sized region.
A machine-rendered reading of the paper's core claim, the machinery that carries it, and where it could break.
Core claim
Seyfert 2 galaxies show a relatively low but significant level of long-term optical variability on month to year time scales, also visible in their structure functions. Using a variability suppression model where the scattering region smooths unobscured photon packets from the central engine as light scatters over the torus, along with dilution from host starlight, the scattering region sizes are estimated by matching variability amplitudes of Seyfert 1s to those of Seyfert 2s. These measured scattering sizes are largely consistent with the torus size measured using their emission properties, suggesting that the scattering region is of a similar size as the torus.
What carries the argument
The variability suppression model by the scattering region that smooths the photon packets from the central engine as the light scatters over the torus, combined with host starlight dilution, used to estimate the region size from amplitude matching.
If this is right
- Variability can be detected in Seyfert 2s at significant levels over month to year timescales.
- The scattering region sizes match those of the torus from emission properties.
- Variability provides a powerful and independent test for AGN unification models.
- The structure functions of Seyfert 2s also reveal the variability.
Where Pith is reading between the lines
- If the model holds, variability monitoring could measure scattering region sizes in a wider range of AGN types without needing infrared data.
- This suggests that the optical scattering region and the torus are the same structure or closely related in geometry.
- Extending this to higher redshift or more luminous AGN could test if the sizes scale with other properties like black hole mass.
Load-bearing premise
That the differences in variability between Seyfert 1 and 2 galaxies are primarily due to a simple scattering suppression and host dilution effect rather than other factors like different intrinsic properties.
What would settle it
Finding scattering region sizes that are inconsistent with independent torus size measurements from infrared observations or reverberation mapping would challenge the result.
Figures

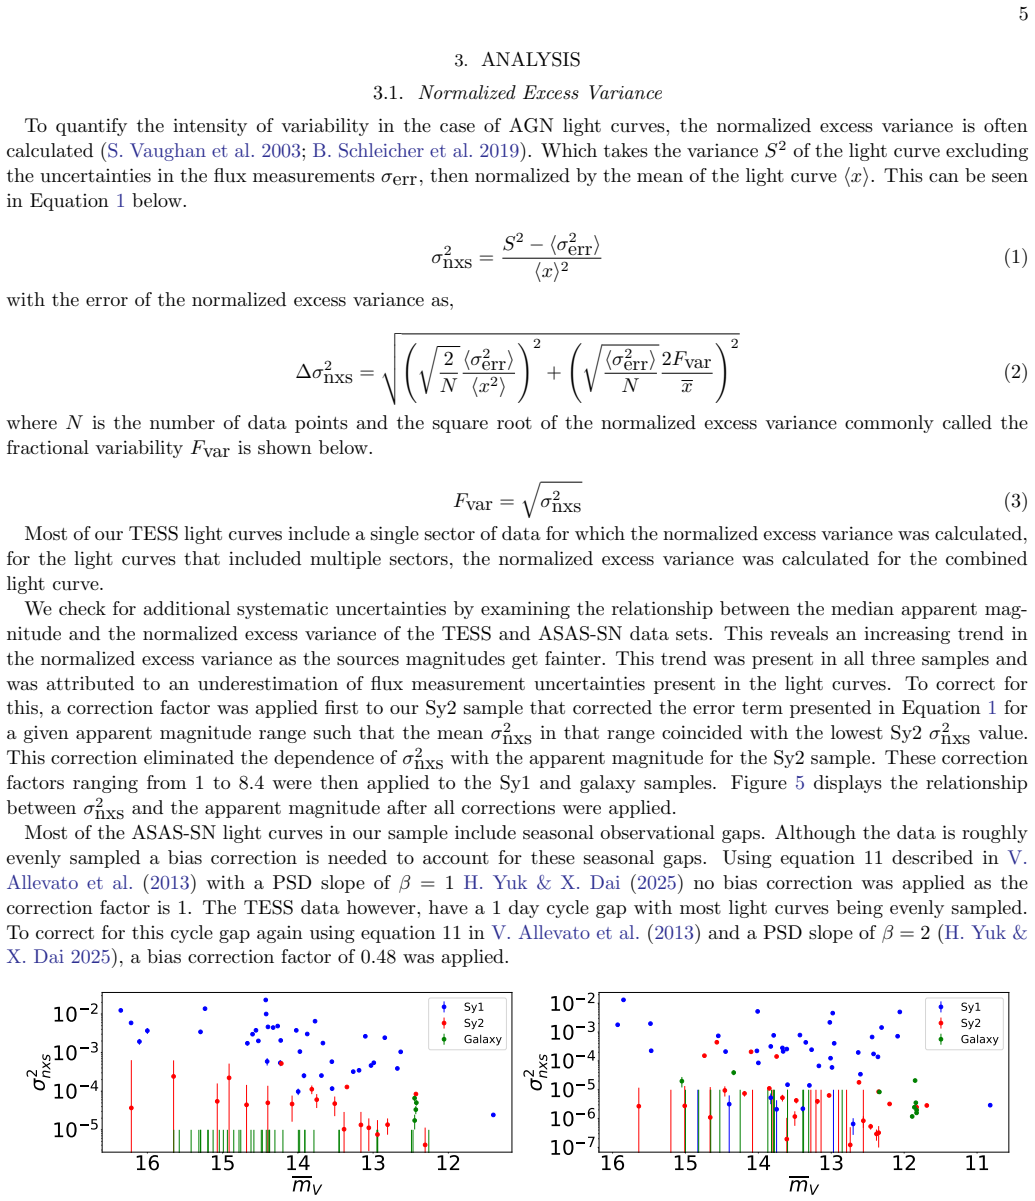

read the original abstract
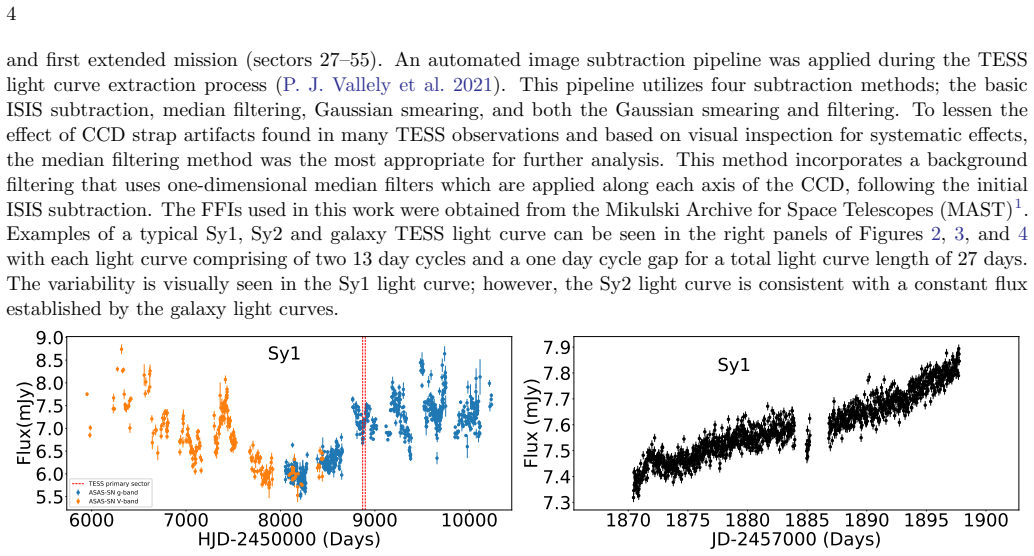
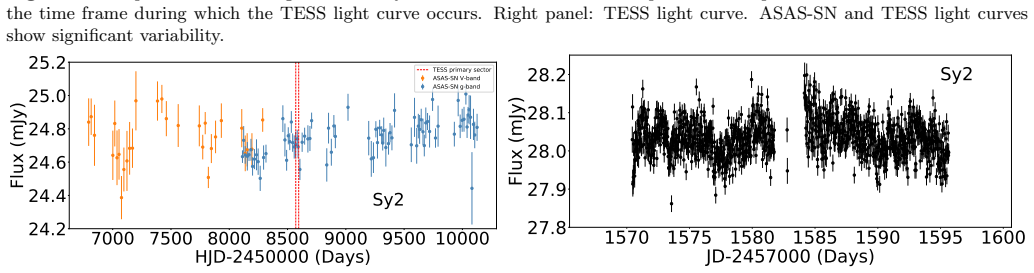
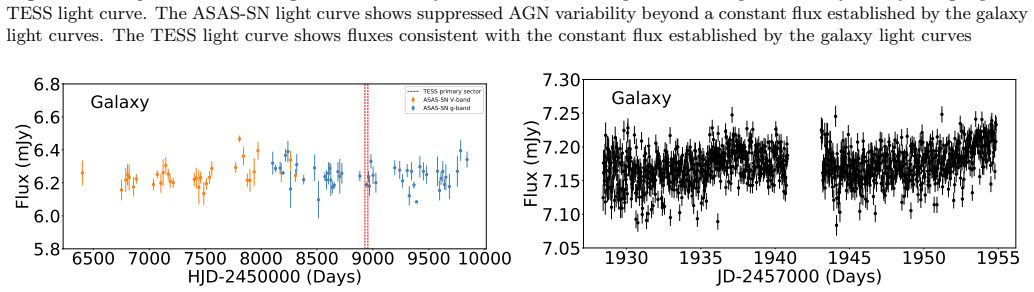
One main theme of the Unification Model of active galactic nuclei is that there is an obscuring torus structure blocking the direct view of the central engine for Seyfert 2 galaxies. Here, we present the detection of long-term optical variability for a sample of nearby Seyfert 2s. We found that Seyfert 2s exhibit a relatively low but significant level of variability beyond the constant fluxes established by galaxies over month to year time scales. The variability is also detected in the structure functions of Seyfert 2s. Assuming a simple variability suppression model by the scattering region and dilution due to host starlight, where the region smooths the unobscured photon packets from the central engine as the light scatters over the torus, we estimate AGN scattering region sizes by matching the variability amplitudes of Seyfert 1s to 2s. Our measured scattering sizes are largely consistent with the torus size measured using their emission properties, suggesting that the scattering region is of a similar size as the torus. Our results pave the way towards variability as a powerful and independent test for AGN unification models.
Editorial analysis
A structured set of objections, weighed in public.
Referee Report
Summary. The manuscript reports the detection of long-term optical variability in a sample of nearby Seyfert 2 galaxies, visible both in direct fluxes and in structure functions on month-to-year timescales. Assuming a simple variability suppression model in which the scattering region acts as a low-pass filter on central-engine light plus dilution by host starlight, the authors match the observed variability amplitudes of Seyfert 1 and Seyfert 2 samples to infer the size of the optical scattering region; these sizes are reported to be largely consistent with independent torus-size estimates derived from emission properties, thereby providing a variability-based test of AGN unification.
Significance. If the suppression model and amplitude-matching procedure can be shown to be robust, the result would supply an independent, variability-driven route to measuring the scattering-region size and would strengthen the unification picture by demonstrating that the scattering region is comparable in scale to the torus. The approach is novel in its use of differential variability amplitudes between type 1 and type 2 objects.
major comments (2)
- [Abstract] Abstract: the abstract states the detection and the matching procedure but supplies no quantitative details on sample selection, error bars, statistical significance thresholds, or validation of the suppression model; the central size-consistency claim therefore rests on an undescribed implementation.
- [Abstract] Abstract: the scattering region size is obtained by matching observed amplitudes under an assumed suppression model whose parameters are not independently constrained in the abstract, so the numerical result is tied to the model's functional form and any fitted dilution factors.
Simulated Author's Rebuttal
We thank the referee for the detailed review and constructive comments on the abstract. We agree that the abstract would benefit from additional quantitative information to better support the central claims. Below we address each point and indicate the planned revisions.
read point-by-point responses
-
Referee: [Abstract] Abstract: the abstract states the detection and the matching procedure but supplies no quantitative details on sample selection, error bars, statistical significance thresholds, or validation of the suppression model; the central size-consistency claim therefore rests on an undescribed implementation.
Authors: The full manuscript (Sections 2 and 3) details the sample (nearby Seyfert 2 galaxies selected from standard catalogs with multi-epoch photometry), the structure-function analysis, error estimation via Monte Carlo simulations, and significance thresholds (e.g., variability detected above 3-sigma in the majority of objects). The suppression model is validated by comparing the observed amplitude ratio to the expected low-pass filtering plus dilution. We will revise the abstract to incorporate key quantitative elements: sample size, typical variability amplitudes with uncertainties, significance levels, and a brief statement on model validation. revision: yes
-
Referee: [Abstract] Abstract: the scattering region size is obtained by matching observed amplitudes under an assumed suppression model whose parameters are not independently constrained in the abstract, so the numerical result is tied to the model's functional form and any fitted dilution factors.
Authors: The model (low-pass filtering by the scattering region plus host dilution) and its parameter constraints are fully specified in the methods section, where dilution factors are fitted from the data and the functional form is tested against the observed structure functions. The abstract summarizes the outcome without repeating these details for brevity. In the revision we will add a short clause noting that sizes are derived under the stated model assumptions with parameters constrained by the amplitude matching, directing readers to the text for the implementation. revision: yes
Circularity Check
No significant circularity in derivation chain
full rationale
The paper states an explicit assumption of a simple variability suppression model (plus host dilution) to convert observed amplitude ratios into scattering-region size estimates, then compares those estimates to an independent torus-size measurement obtained from emission properties. No equations are shown that reduce the size value to the input amplitudes by construction, no parameter is fitted on a subset and then relabeled as a prediction, and no load-bearing self-citation or uniqueness theorem is invoked. The consistency claim is therefore conditional on the stated model rather than tautological; the derivation remains self-contained against external benchmarks.
Axiom & Free-Parameter Ledger
free parameters (1)
- suppression factor
axioms (1)
- domain assumption The scattering region smooths the unobscured photon packets from the central engine as the light scatters over the torus
Reference graph
Works this paper leans on
-
[1]
2013, ApJ, 771, 9, doi: 10.1088/0004-637X/771/1/9
Allevato, V., Paolillo, M., Papadakis, I., & Pinto, C. 2013, ApJ, 771, 9, doi: 10.1088/0004-637X/771/1/9
-
[2]
Antonucci, R. 1993, Annu. Rev. Astron. Astrophys., 31, 473, doi: 10.1146/annurev.aa.31.090193.002353
-
[3]
Antonucci, R. R. J., & Miller, J. S. 1985, ApJ, 297, 621, doi: 10.1086/163559
-
[4]
Aretxaga, I., Femandes, Roberto Cid, J., & Terlevich, R. J. 1997, MNRAS, 286, 271, doi: 10.1093/mnras/286.2.271
-
[5]
Barthelmy, S. D., Barbier, L. M., Cummings, J. R., et al. 2005, SSRv, 120, 143, doi: 10.1007/s11214-005-5096-3
work page internal anchor Pith review doi:10.1007/s11214-005-5096-3 2005
-
[6]
Chiaberge, M., & Marconi, A. 2011, MNRAS, 416, 917, doi: 10.1111/j.1365-2966.2011.19079.x
-
[7]
Choi, Y., Gibson, R. R., Becker, A. C., et al. 2014, ApJ, 782, 37, doi: 10.1088/0004-637X/782/1/37
-
[8]
CLOPPER, C. J., & PEARSON, E. S. 1934, Biometrika, 26, 404, doi: 10.1093/biomet/26.4.404
-
[9]
Courvoisier, T. J. L., Paltani, S., & Walter, R. 1996, A&A, 308, L17 de Ruiter, H. R., & Lub, J. 1986, A&AS, 63, 59
1996
-
[10]
doi:10.1111/j.1365-2966.2010.17535.x , eprint =
Emmanoulopoulos, D., McHardy, I. M., & Uttley, P. 2010, MNRAS, 404, 931, doi: 10.1111/j.1365-2966.2010.16328.x
-
[11]
2004, ApJ, 611, 1005, doi: 10.1086/422091
Gehrels, N., Chincarini, G., Giommi, P., et al. 2004, ApJ, 611, 1005, doi: 10.1086/422091
-
[12]
Hart, K., Shappee, B. J., Hey, D., et al. 2023, arXiv e-prints, arXiv:2304.03791, doi: 10.48550/arXiv.2304.03791
-
[13]
Heisler, C. A., Lumsden, S. L., & Bailey, J. A. 1997, Nature, 385, 700, doi: 10.1038/385700a0
-
[14]
2015, ApJ, 803, 57, doi: 10.1088/0004-637X/803/2/57
Ichikawa, K., Packham, C., Ramos Almeida, C., et al. 2015, ApJ, 803, 57, doi: 10.1088/0004-637X/803/2/57
-
[15]
H., Chester, T., Cutri, R., et al
Jarrett, T. H., Chester, T., Cutri, R., et al. 2000, AJ, 119, 2498, doi: 10.1086/301330
-
[16]
Jayasinghe, T., Kochanek, C. S., Stanek, K. Z., et al. 2018, MNRAS, 477, 3145, doi: 10.1093/mnras/sty838
-
[17]
Jayasinghe, T., Stanek, K. Z., Kochanek, C. S., et al. 2019, MNRAS, 485, 961, doi: 10.1093/mnras/stz444
-
[18]
Kawaguchi, T., Mineshige, S., Umemura, M., & Turner, E. L. 1998, ApJ, 504, 671, doi: 10.1086/306105
-
[19]
Kishimoto, M., H¨ onig, S. F., Beckert, T., & Weigelt, G. 2007, A&A, 476, 713, doi: 10.1051/0004-6361:20077911
-
[20]
1995, ARA&A, 33, 581, doi: 10.1146/annurev.aa.33.090195.003053
Kormendy, J., & Richstone, D. 1995, ARA&A, 33, 581, doi: 10.1146/annurev.aa.33.090195.003053
-
[21]
2025, ApJ, 985, 177, doi: 10.3847/1538-4357/adcb40 Koz lowski, S
Kovacevic, N., Dai, X., Yuk, H., et al. 2025, ApJ, 985, 177, doi: 10.3847/1538-4357/adcb40 Koz lowski, S. 2016, ApJ, 826, 118, doi: 10.3847/0004-637X/826/2/118
-
[22]
Krolik, J. H., Horne, K., Kallman, T. R., et al. 1991, ApJ, 371, 541, doi: 10.1086/169918 L´ opez-Navas, E., Ar´ evalo, P., Bernal, S., et al. 2023, MNRAS, 518, 1531, doi: 10.1093/mnras/stac3174
-
[23]
MacLeod, C. L., Ivezi´ c,ˇZ., Kochanek, C. S., et al. 2010, ApJ, 721, 1014, doi: 10.1088/0004-637X/721/2/1014
-
[24]
Madau, P., Ghisellini, G., & Fabian, A. C. 1994, MNRAS, 270, L17, doi: 10.1093/mnras/270.1.L17
-
[25]
2002, ApJ, 570, L9, doi: 10.1086/340857
Nenkova, M., Ivezi´ c,ˇZ., & Elitzur, M. 2002, ApJ, 570, L9, doi: 10.1086/340857
-
[26]
M., Ivezi´ c,ˇZ., & Elitzur, M
Nenkova, M., Sirocky, M. M., Ivezi´ c,ˇZ., & Elitzur, M. 2008a, ApJ, 685, 147, doi: 10.1086/590482
-
[27]
Elitzur, M. 2008b, ApJ, 685, 160, doi: 10.1086/590483
-
[28]
Osterbrock, D. E. 1981, ApJ, 249, 462, doi: 10.1086/159306 Ramos Almeida, C., Mart´ ınez Gonz´ alez, M. J., Asensio
-
[29]
2016, MNRAS, 461, 1387, doi: 10.1093/mnras/stw1388
Ramos, A., et al. 2016, MNRAS, 461, 1387, doi: 10.1093/mnras/stw1388
-
[30]
Roche, P. F., Aitken, D. K., Smith, C. H., & Ward, M. J. 1991, MNRAS, 248, 606, doi: 10.1093/mnras/248.4.606
-
[31]
2019, Galaxies, 7, 62, doi: 10.3390/galaxies7020062
Schleicher, B., Arbet-Engels, A., Baack, D., et al. 2019, Galaxies, 7, 62, doi: 10.3390/galaxies7020062
-
[32]
Seyfert, C. K. 1943, ApJ, 97, 28, doi: 10.1086/144488
-
[33]
Shappee, B. J., Prieto, J. L., Grupe, D., et al. 2014, ApJ, 788, 48, doi: 10.1088/0004-637X/788/1/48
work page internal anchor Pith review doi:10.1088/0004-637x/788/1/48 2014
-
[34]
Skrutskie, M. F., Cutri, R. M., Stiening, R., et al. 2006, AJ, 131, 1163, doi: 10.1086/498708
-
[35]
Treiber, H. P., Hinkle, J. T., Fausnaugh, M. M., et al. 2023, MNRAS, 525, 5795, doi: 10.1093/mnras/stad2530
-
[36]
Treister, E., & Urry, C. M. 2005, ApJ, 630, 115, doi: 10.1086/431892 Tr` evese, D., & Vagnetti, F. 2002, ApJ, 564, 624, doi: 10.1086/324541
-
[37]
Tueller, J., Mushotzky, R. F., Barthelmy, S., et al. 2008, ApJ, 681, 113, doi: 10.1086/588458
-
[38]
Unified Schemes for Radio-Loud Active Galactic Nuclei
Urry, C. M., & Padovani, P. 1995, PASP, 107, 803, doi: 10.1086/133630
work page internal anchor Pith review doi:10.1086/133630 1995
-
[39]
Vallely, P. J., Kochanek, C. S., Stanek, K. Z., Fausnaugh, M., & Shappee, B. J. 2021, MNRAS, 500, 5639, doi: 10.1093/mnras/staa3675
-
[40]
Vaughan, S., Edelson, R., Warwick, R. S., & Uttley, P. 2003, MNRAS, 345, 1271, doi: 10.1046/j.1365-2966.2003.07042.x
-
[41]
Wasserstein, R. L., & Lazar, N. A. 2016, The American Statistician, 70, 129, doi: 10.1080/00031305.2016.1154108 11
work page internal anchor Pith review Pith/arXiv arXiv doi:10.1080/00031305.2016.1154108 2016
-
[42]
2000, ApJ, 540, 652, doi: 10.1086/309341
Webb, W., & Malkan, M. 2000, ApJ, 540, 652, doi: 10.1086/309341
-
[43]
1997, MNRAS, 292, 273, doi: 10.1093/mnras/292.2.273
Winkler, H. 1997, MNRAS, 292, 273, doi: 10.1093/mnras/292.2.273
-
[44]
Winkler, H., Glass, I. S., van Wyk, F., et al. 1992, MNRAS, 257, 659, doi: 10.1093/mnras/257.4.659
-
[45]
2011, ApJ, 730, 121, doi: 10.1088/0004-637X/730/2/121
Zhao, Y.-H. 2011, ApJ, 730, 121, doi: 10.1088/0004-637X/730/2/121
-
[46]
2020, ApJ., 900, 58, doi: 10.3847/1538-4357/aba59b
Yang, Q., Shen, Y., Liu, X., et al. 2020, ApJ., 900, 58, doi: 10.3847/1538-4357/aba59b
-
[47]
2025, A&A, 698, A105, doi: 10.1051/0004-6361/202452469
Yuk, H., & Dai, X. 2025, A&A, 698, A105, doi: 10.1051/0004-6361/202452469
-
[48]
2022, ApJ, 930, 110, doi: 10.3847/1538-4357/ac6423
Yuk, H., Dai, X., Jayasinghe, T., et al. 2022, ApJ, 930, 110, doi: 10.3847/1538-4357/ac6423
discussion (0)
Sign in with ORCID, Apple, or X to comment. Anyone can read and Pith papers without signing in.