REVIEW 2 major objections 3 minor
Reviewed by Pith at T0; open to challenge.
T0 means a machine referee read the full paper against a public rubric. The mark states how deep the mechanical check went, never who wrote it. the ladder, T0–T4 →
T0 review · grok-4.3
Randomized neural networks estimate exposure and CVA for American options with the same accuracy as least-squares Monte Carlo but lower cost in high dimensions.
2026-06-25 21:54 UTC pith:JL2NCPXH
load-bearing objection Randomized nets match LSM on American CVA exposure but deliver the expected scaling win only in high dimensions. the 2 major comments →
Randomized Neural Networks for estimation of exposure profiles and Credit Valuation Adjustment (CVA) for American Equity Options
The pith
A machine-rendered reading of the paper's core claim, the machinery that carries it, and where it could break.
Core claim
The randomized feedforward neural network approach preserves convergence to the LSM benchmark when it is extended from pricing to exposure and CVA estimation, while its main advantage appears in high-dimensional problems, where it scales more efficiently and leads to lower computational cost.
What carries the argument
Randomized feedforward neural network trained on simulated paths to estimate continuation values for American exercise decisions inside Monte Carlo exposure and CVA calculations.
Load-bearing premise
Once trained on the same paths used by LSM, the randomized network produces continuation-value estimates whose statistical properties stay close enough to LSM that downstream exposure and CVA numbers do not diverge materially.
What would settle it
Run the identical high-dimensional test set and observe whether the neural-network CVA or exposure profile deviates from the LSM benchmark by more than Monte Carlo sampling error.
If this is right
- The method produces usable exposure and CVA numbers for both Black-Scholes and Heston American options.
- Portfolio netting effects are captured at the same accuracy level as LSM.
- Pathwise convergence and sensitivity tests remain stable when the network replaces LSM regression.
- Computational cost stays lower than LSM once the dimension exceeds a few assets.
Where Pith is reading between the lines
- The same network could replace LSM regression steps in other path-dependent claims such as Bermudan swaptions.
- Real-time risk systems for large equity baskets might become feasible if training cost stays sub-linear in dimension.
- Extending the approach to stochastic interest rates would require only adding the rate factors to the network inputs.
Editorial analysis
A structured set of objections, weighed in public.
Referee Report
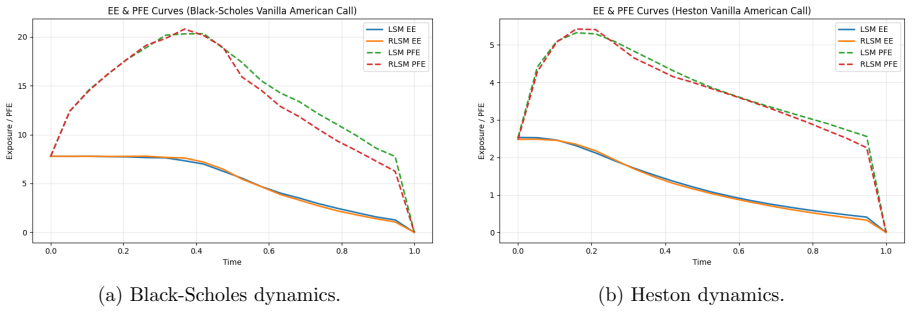
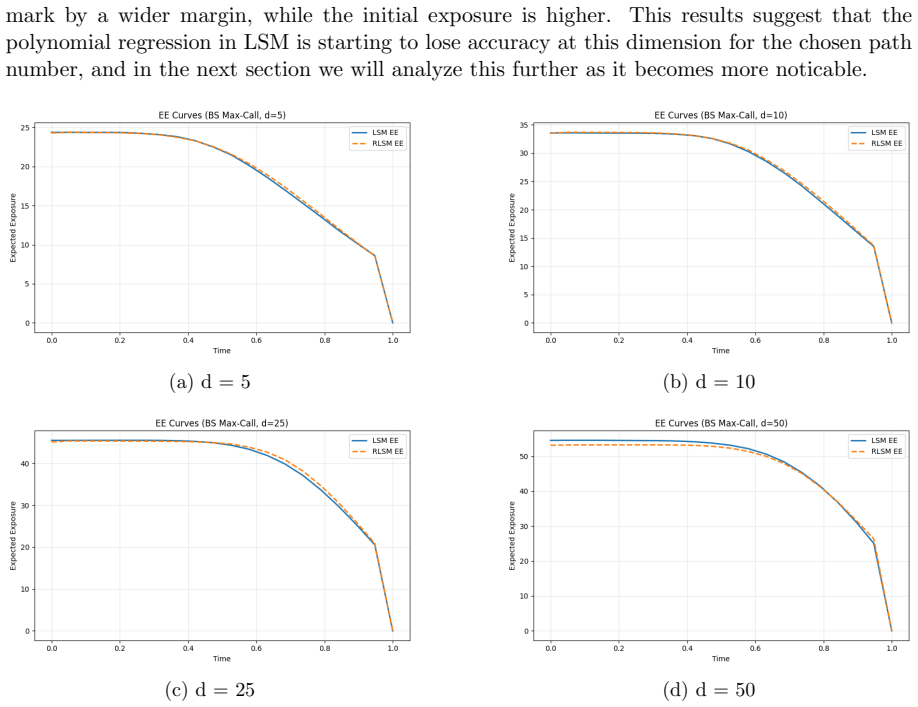
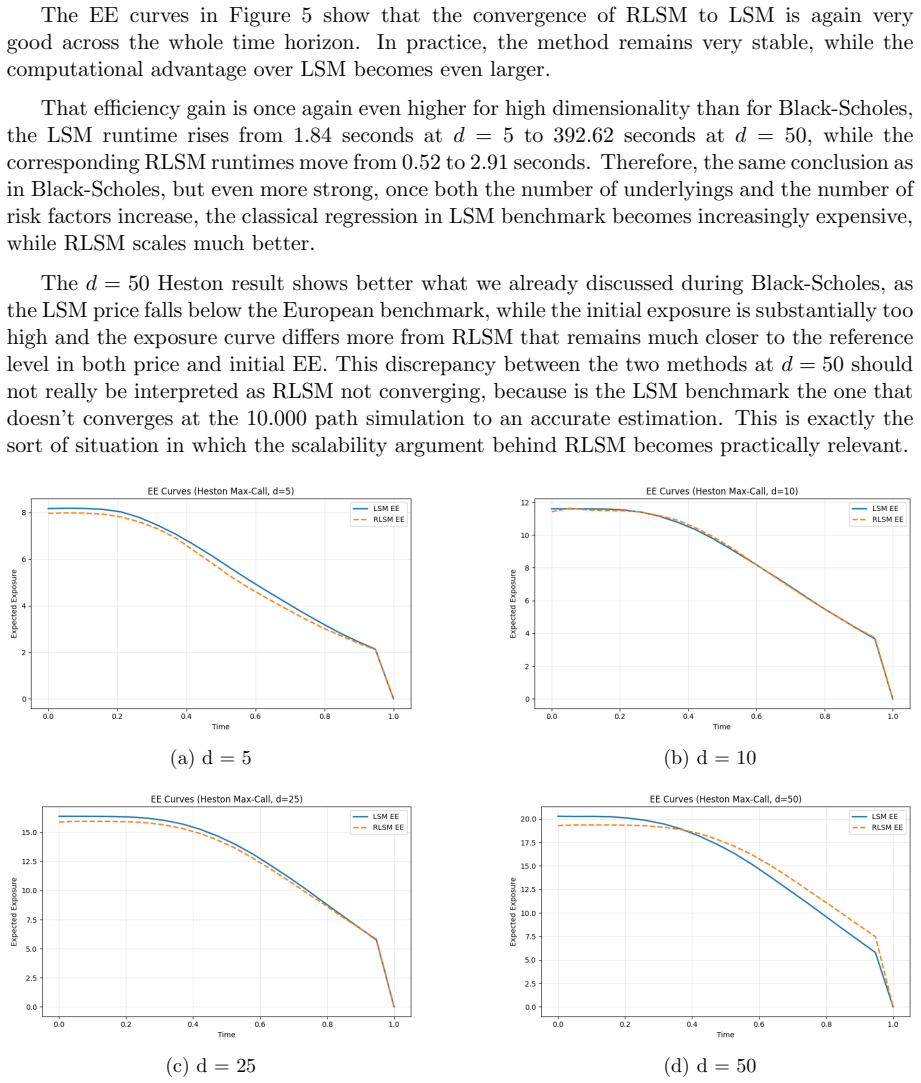
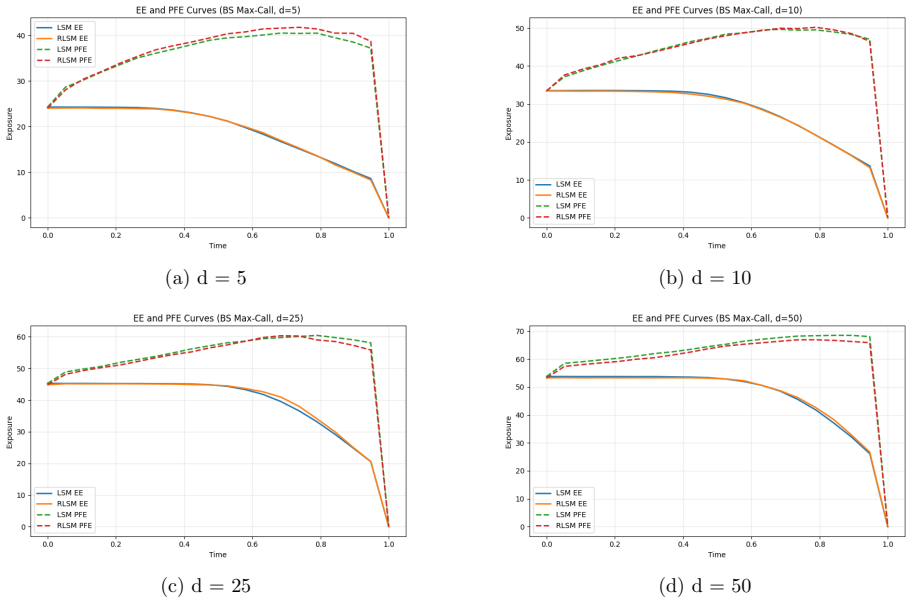
Summary. The manuscript proposes the use of randomized feedforward neural networks within a Monte Carlo simulation framework to estimate exposure profiles (EE, PFE) and unilateral CVA for American equity options. The method is tested separately under Black-Scholes and Heston dynamics, for single-asset and multi-asset portfolios (with netting), and is benchmarked against Least-Squares Monte Carlo (LSM). Numerical results include path-convergence tests and sensitivity analysis; the central claim is that the randomized NN approach converges to the LSM benchmark while offering computational scaling advantages in high-dimensional settings.
Significance. If the empirical convergence holds, the work supplies a practical, lower-cost alternative to LSM for CVA and exposure calculations on American-style claims in high-dimensional equity portfolios. The explicit inclusion of both dynamics, netting, and path-convergence diagnostics strengthens the applicability claim for risk-management use cases.
major comments (2)
- [§4.2] §4.2 (high-dimensional experiments): the reported CPU-time savings versus LSM are stated without accompanying standard errors or number of independent runs; it is therefore unclear whether the observed speed-up is statistically distinguishable from run-to-run Monte Carlo variability.
- [Table 5] Table 5 (CVA values under Heston with netting): the absolute differences between NN and LSM are on the order of 1–3 % of the LSM value, yet no formal statistical test (e.g., paired t-test across paths) is supplied to confirm that these differences are consistent with Monte Carlo noise rather than systematic bias in the continuation-value estimator.
minor comments (3)
- [Abstract] The abstract states that “a path-convergence test … were performed” but does not report the observed convergence rates or the number of paths used; adding a short quantitative summary would improve readability.
- [§3.1] Notation for the randomized NN (weights drawn from which distribution, activation function, number of hidden units) is introduced only in §3.1; a compact table summarizing the hyper-parameters used in each experiment would aid reproducibility.
- [Figure 3] Figure 3 (exposure profiles) uses different y-axis scales across panels; aligning the scales or adding a common reference line would make visual comparison with LSM easier.
Simulated Author's Rebuttal
We thank the referee for the careful reading and constructive comments. We address the two major comments point by point below. We agree that the suggested additions of statistical information will strengthen the manuscript and plan to incorporate them.
read point-by-point responses
-
Referee: [§4.2] §4.2 (high-dimensional experiments): the reported CPU-time savings versus LSM are stated without accompanying standard errors or number of independent runs; it is therefore unclear whether the observed speed-up is statistically distinguishable from run-to-run Monte Carlo variability.
Authors: We agree that reporting the number of independent runs and standard errors is necessary for a rigorous interpretation of the timing results. In the revised manuscript we will state the number of independent timing runs performed in §4.2 and include standard errors for the reported CPU times, allowing readers to confirm that the observed speed-ups exceed run-to-run Monte Carlo variability. revision: yes
-
Referee: [Table 5] Table 5 (CVA values under Heston with netting): the absolute differences between NN and LSM are on the order of 1–3 % of the LSM value, yet no formal statistical test (e.g., paired t-test across paths) is supplied to confirm that these differences are consistent with Monte Carlo noise rather than systematic bias in the continuation-value estimator.
Authors: We accept that a formal test would provide additional reassurance. In the revision we will compute and report a paired t-test (or equivalent) on the CVA estimates obtained from multiple independent Monte Carlo path sets, demonstrating that the observed 1–3 % differences lie within the range attributable to Monte Carlo noise rather than estimator bias. The test results and updated discussion will be added to the presentation of Table 5. revision: yes
Circularity Check
No significant circularity; empirical results rest on external LSM benchmark
full rationale
The paper's core claims are established through direct numerical comparison of randomized NN continuation values against the independent LSM benchmark on the same simulated paths, under both Black-Scholes and Heston dynamics, including path-convergence tests and sensitivity analysis for exposure and CVA. No derivation step reduces a reported CVA or exposure statistic to a fitted parameter or self-defined quantity by construction; the randomized NN is trained once and then evaluated for statistical closeness to LSM, which is an external method. No load-bearing self-citation chains or uniqueness theorems imported from the authors' prior work appear in the derivation. The work is therefore self-contained against external benchmarks.
Axiom & Free-Parameter Ledger
read the original abstract
This paper studies the use of randomized neural networks for the estimation of exposure profiles and unilateral CVA of American options within a Monte Carlo framework. The analysis is carried out separately under both Black-Scholes and Heston dynamics, combining American option valuation, expected exposure and potential future exposure estimation, and unilateral CVA calculation with portfolio netting effects. The numerical experiment compares this approach with the classical Least-Squares Monte Carlo (LSM) used as a benchmark in both low-dimensional single-asset and high-dimensional multi-asset scenarios, and also includes a path convergence test and a sensitivity analysis. The results show that the randomized feedforward neural network approach preserves convergence to the LSM benchmark when it is extended from pricing to exposure and CVA estimation, while its main advantage appears in high-dimensional problems, where it scales more efficiently and leads to lower computational cost. These results support the use of randomized neural networks as a useful alternative for exposure and CVA estimation in high-dimensional American-style options.
Figures





discussion (0)
Sign in with ORCID, Apple, or X to comment. Anyone can read and Pith papers without signing in.