A Statistical Study of HI Gas in AGN-Hosting and Satellite Galaxies from ALFALFA and FASHI
Pith reviewed 2026-06-25 21:27 UTC · model grok-4.3
The pith
AGN feedback suppresses HI gas and star formation in satellite galaxies even at the virial radius.
A machine-rendered reading of the paper's core claim, the machinery that carries it, and where it could break.
Core claim
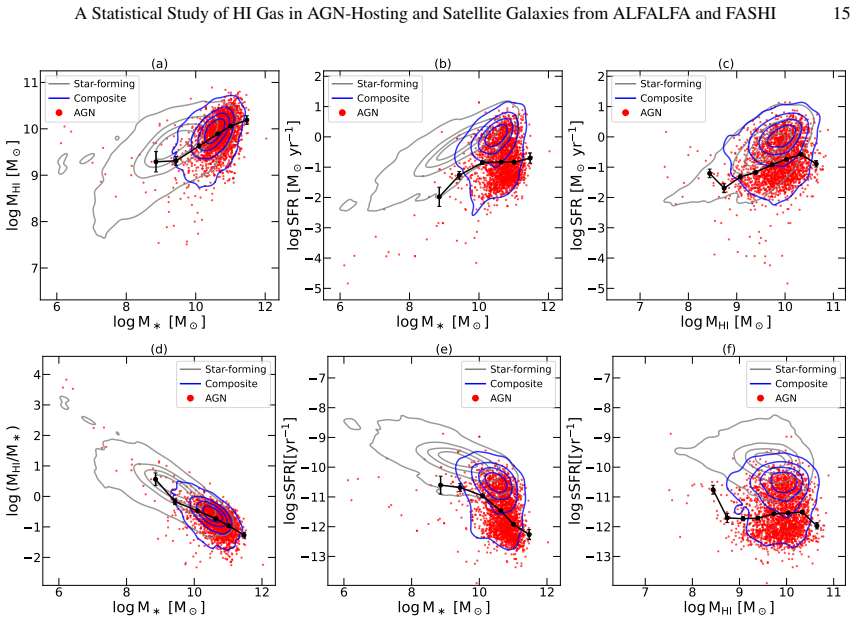
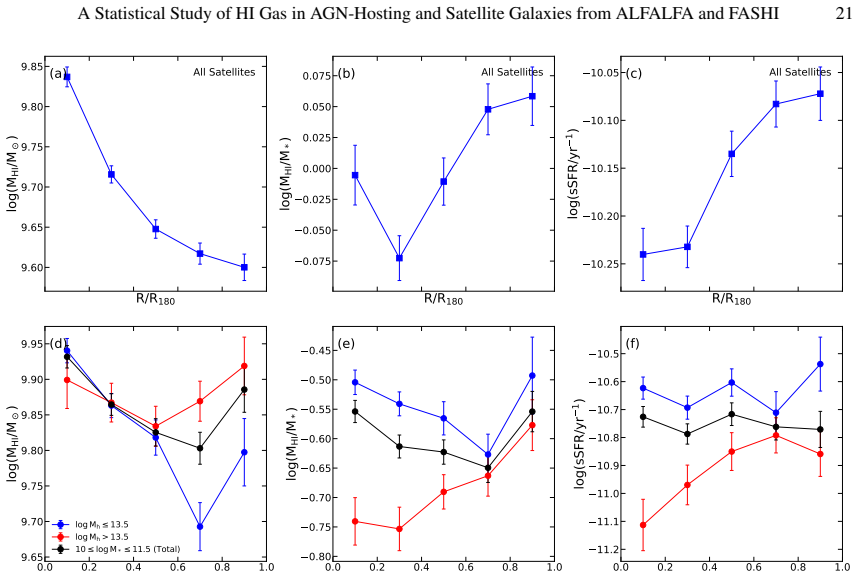
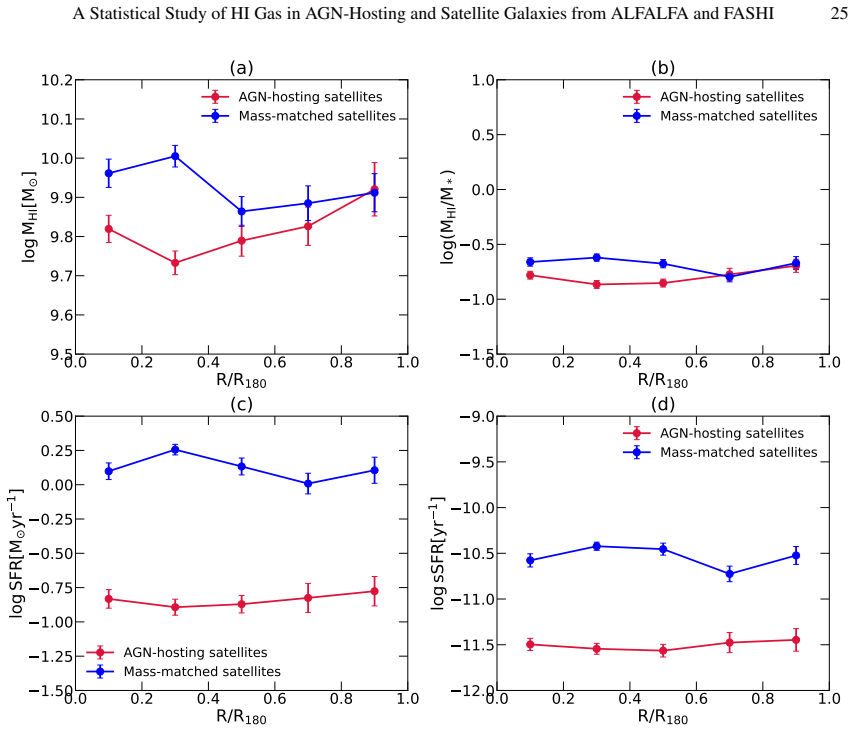
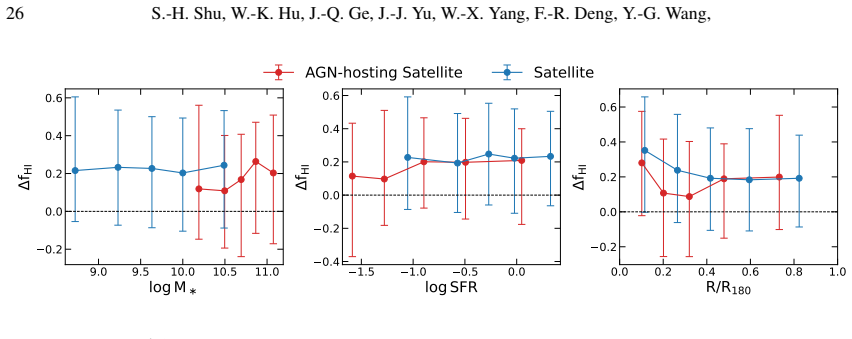
AGN-hosting satellites exhibit a significant and persistent deficit in both gas fraction and SFR relative to normal satellites without AGN, even at the halo virial radius (R/R180 approx 1). This suggests that cold gas depletion is primarily driven by internal AGN feedback before these galaxies experience intense environmental interactions. The relatively flat radial profiles of gas fraction and sSFR further indicate that the evolution of AGN-hosting satellites is governed by internal physical processes rather than environmental interactions.
What carries the argument
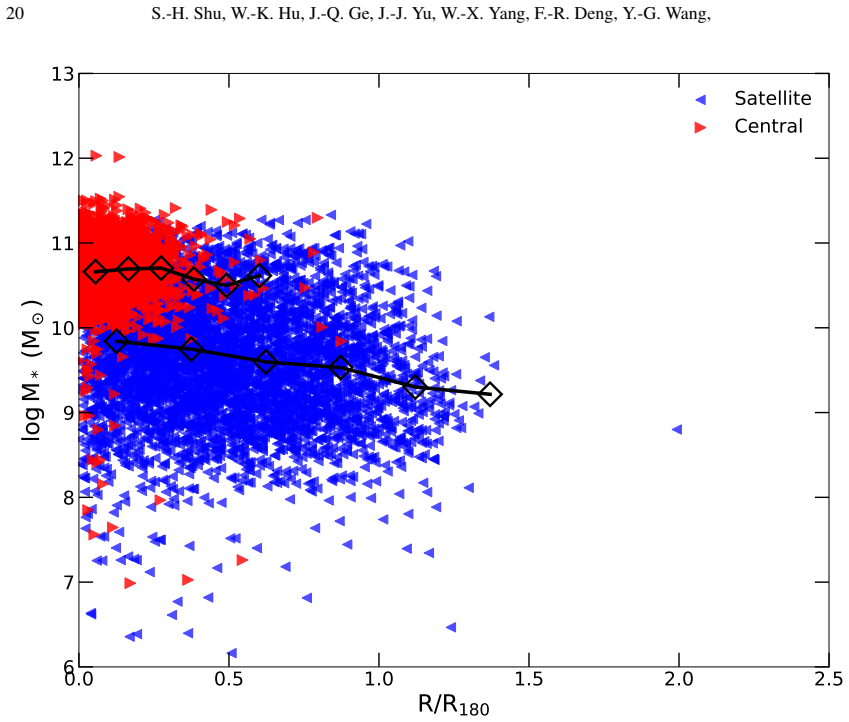
Comparison of HI gas fraction and specific star formation rate as functions of projected group-centric radius (R/R180) for AGN-classified versus non-AGN satellite galaxies.
If this is right
- Internal AGN feedback operates as the dominant quenching channel for gas-rich satellites before they enter dense group environments.
- Environmental processes such as ram-pressure stripping become secondary for galaxies that already host AGN.
- Flat radial trends imply that the observed gas depletion does not strengthen with proximity to the group center for AGN hosts.
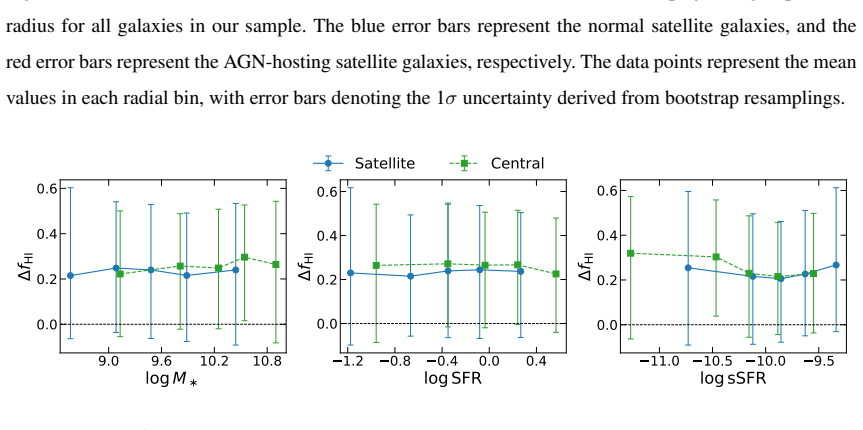
- Beam confusion must be accounted for when interpreting central HI measurements in single-dish surveys.
Where Pith is reading between the lines
- If AGN feedback precedes environmental effects, models of satellite quenching should incorporate an early internal phase that sets the gas reservoir before infall.
- Future HI surveys with higher angular resolution could test whether the central gas upturn disappears once beam confusion is removed.
- The result raises the question of whether AGN activity itself is triggered by the same processes that later drive environmental quenching or arises independently.
Load-bearing premise
Optical spectroscopy from SDSS and DESI accurately identifies AGN hosts without substantial misclassification that could create the observed gas deficits.
What would settle it
Repeating the radial gas-fraction analysis on a sample where AGN classification is independently verified by X-ray or mid-infrared diagnostics instead of optical lines.
Figures

read the original abstract
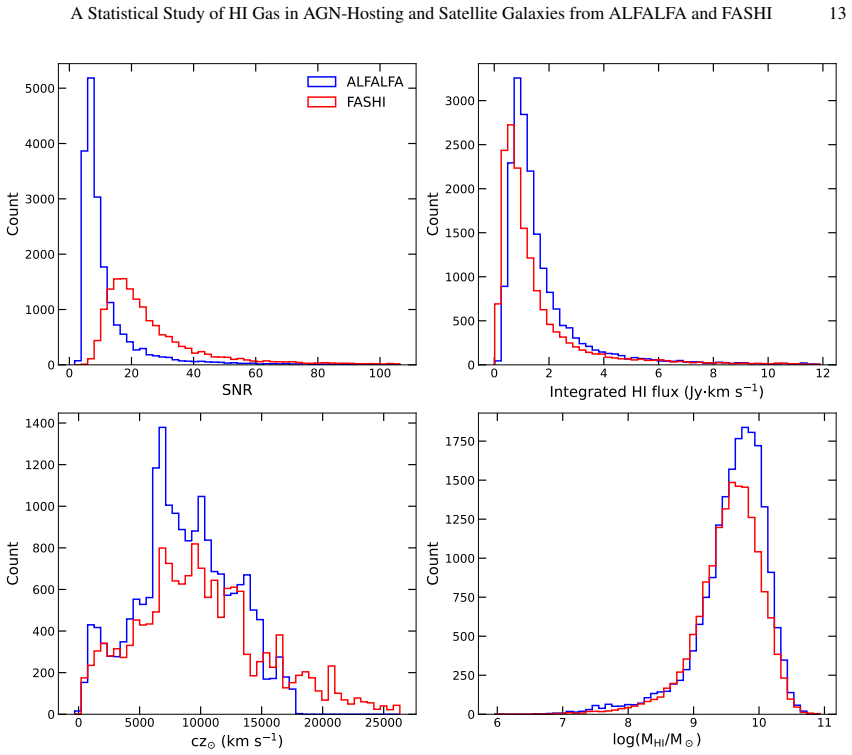
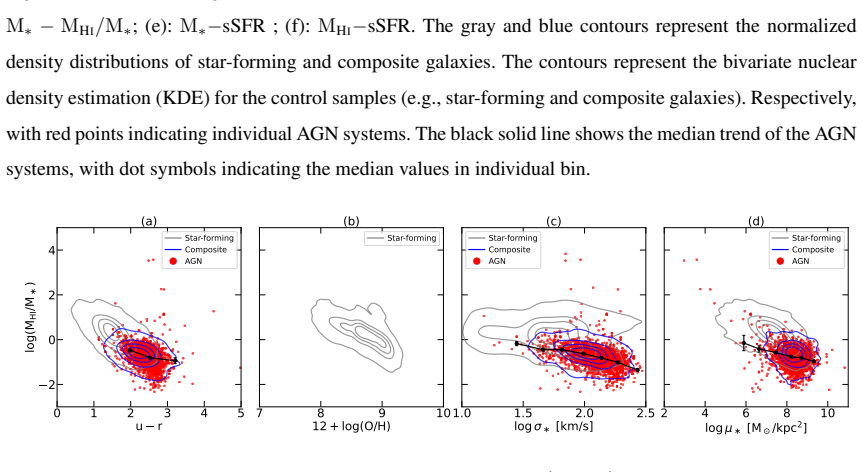
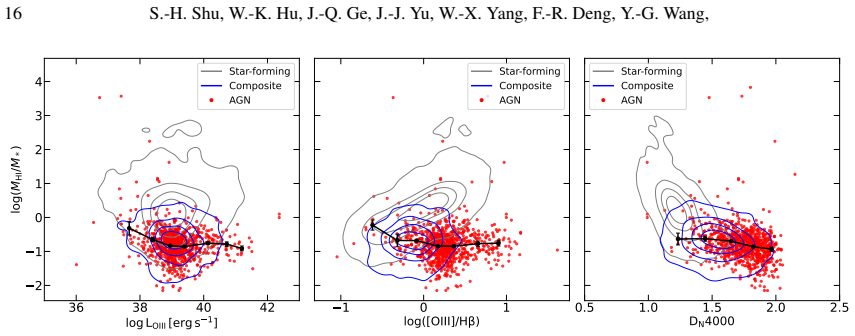
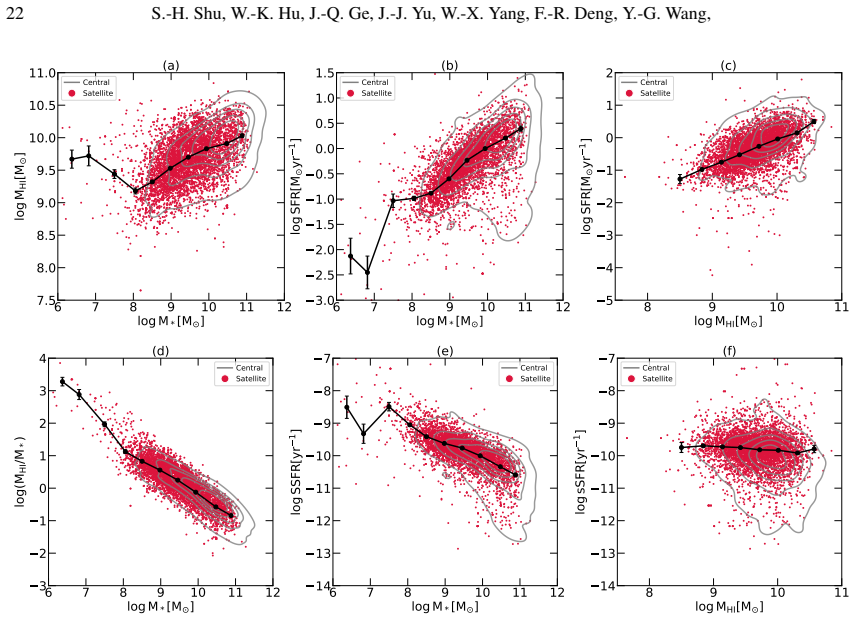
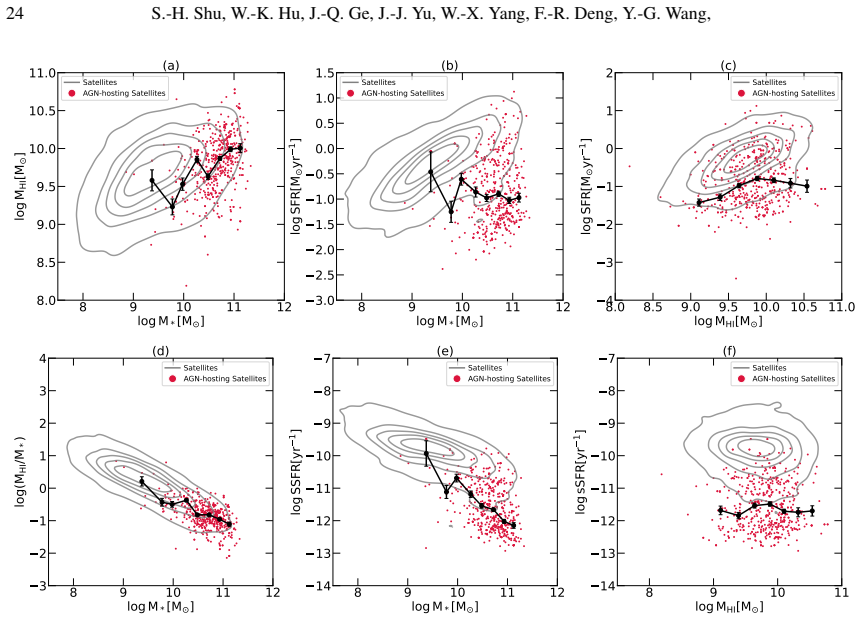
We investigate the relative importance of Active Galactic Nucleus (AGN) feedback and environmental processes using a large sample of HI galaxies from the ALFALFA and FASHI surveys. By applying the optical spectroscopy from SDSS DR7/DR8 and the DESI survey, we analyse the gas content and physical properties of AGN-hosting galaxies in group environments. Our results show that AGN-hosting galaxies exhibit significantly suppressed star formation rates and HI gas fraction, approximately one order of magnitude lower than star-forming counterparts, regardless of their group-centric position. AGN-hosting satellites exhibit a significant and persistent deficit in both gas fraction and SFR relative to normal satellites without AGN, even at the halo virial radius (R/R180 approx 1). This suggests that cold gas depletion is primarily driven by internal AGN feedback before these galaxies experience intense environmental interactions. The relatively flat radial profiles of gas fraction and sSFR further indicate that the evolution of AGN-hosting satellites is governed by internal physical processes rather than environmental interactions. Moreover, the apparent increase in HI gas at R/R180 < 0.3 is identified as an artifact of beam confusion. We conclude that for the AGN-hosting population, internal feedback is likely the prior quenching mechanism, while environmental effects act as a secondary, subsequent process.
Editorial analysis
A structured set of objections, weighed in public.
Referee Report
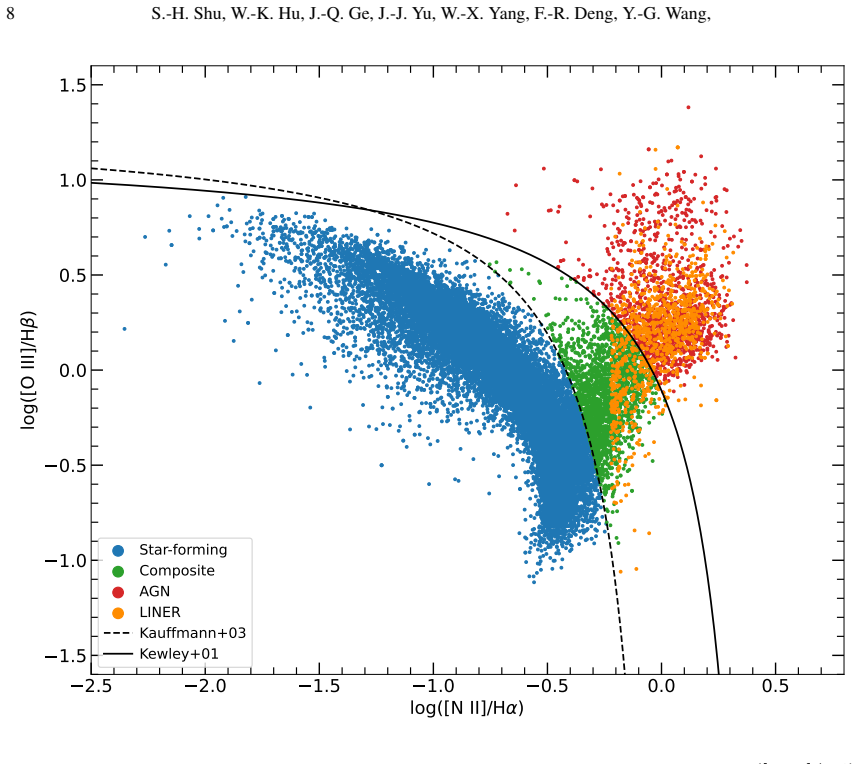
Summary. The manuscript analyzes HI gas fractions and star formation rates in AGN-hosting versus non-AGN satellite galaxies drawn from the ALFALFA and FASHI surveys, with AGN classification performed via optical line ratios from SDSS DR7/DR8 and DESI. It reports an approximately one-dex suppression in both quantities for AGN hosts that persists to R/R180 ≈ 1, with flat radial profiles, and concludes that internal AGN feedback is the primary quenching mechanism acting prior to environmental effects.
Significance. If the AGN classification is shown to be robust against contamination and if sample selection and beam effects are demonstrated to be adequately controlled, the result would supply useful observational constraints on the relative timing of internal feedback versus environmental quenching in group satellites.
major comments (2)
- [Sample construction and AGN classification (abstract and §2)] The central claim that internal AGN feedback precedes environmental effects rests on the accuracy of the optical AGN classification. The manuscript provides no purity, completeness, or contamination statistics for the SDSS/DESI BPT-style selection, nor any cross-validation against X-ray or mid-IR AGN indicators. Low-SFR systems are known to produce harder line ratios that can mimic AGN, which could contribute to the reported gas-fraction deficit if such objects are preferentially included or misclassified.
- [Results on radial trends (§3–4)] The reported persistence of the one-dex deficit and flat radial profiles out to R/R180 ≈ 1 is load-bearing for the conclusion that environmental processes are secondary. The text does not supply quantitative details on group-membership criteria, matched control samples of non-AGN satellites, error propagation on gas fractions, or a systematic assessment of beam confusion beyond noting an artifact inside R/R180 < 0.3; without these, selection biases cannot be ruled out as contributors to the observed trends.
minor comments (1)
- [Abstract] Notation in the abstract (“R/R180 approx 1”) should be standardized to R/R_{180} ≈ 1 and defined at first use.
Simulated Author's Rebuttal
We thank the referee for the constructive comments on our manuscript. We address each major point below and will revise the paper accordingly to provide additional details and clarifications where feasible.
read point-by-point responses
-
Referee: [Sample construction and AGN classification (abstract and §2)] The central claim that internal AGN feedback precedes environmental effects rests on the accuracy of the optical AGN classification. The manuscript provides no purity, completeness, or contamination statistics for the SDSS/DESI BPT-style selection, nor any cross-validation against X-ray or mid-IR AGN indicators. Low-SFR systems are known to produce harder line ratios that can mimic AGN, which could contribute to the reported gas-fraction deficit if such objects are preferentially included or misclassified.
Authors: We agree that the manuscript would benefit from more explicit discussion of the AGN classification. Our selection follows the standard BPT criteria with Kewley et al. (2001) and Kauffmann et al. (2003) demarcations applied to SDSS DR7/DR8 and DESI spectra, consistent with widespread practice in the literature. We will add a dedicated paragraph on selection criteria, potential biases from low-SFR systems (noting that our HI-detected sample reduces the likelihood of including quiescent contaminants), and references to validation studies comparing optical AGN selection to X-ray/mid-IR indicators. Full quantitative purity/completeness metrics and new cross-validation are not feasible without additional multiwavelength data for the entire sample, but we will acknowledge this limitation and its possible impact on the results. revision: partial
-
Referee: [Results on radial trends (§3–4)] The reported persistence of the one-dex deficit and flat radial profiles out to R/R180 ≈ 1 is load-bearing for the conclusion that environmental processes are secondary. The text does not supply quantitative details on group-membership criteria, matched control samples of non-AGN satellites, error propagation on gas fractions, or a systematic assessment of beam confusion beyond noting an artifact inside R/R180 < 0.3; without these, selection biases cannot be ruled out as contributors to the observed trends.
Authors: We acknowledge that additional quantitative details are required. Group membership follows the SDSS group catalog using a friends-of-friends algorithm; we will expand §2 with the specific linking lengths and velocity cuts employed. Control samples of non-AGN satellites were matched in stellar mass and redshift (with tolerances of 0.2 dex and 0.05 in z); we will include a description of the matching procedure and resulting sample sizes. Error propagation on HI gas fractions incorporates survey flux uncertainties and distance errors via standard quadrature methods, which we will detail. The beam confusion artifact inside R/R180 < 0.3 is already flagged, and we will add a systematic assessment comparing ALFALFA/FASHI beam sizes to typical group scales and quantifying the affected fraction. These changes will be incorporated in the revised manuscript. revision: yes
Circularity Check
No circularity: purely empirical statistical comparison of survey data
full rationale
The paper reports observational differences in HI gas fraction and SFR between AGN-classified and non-AGN satellites drawn from ALFALFA, FASHI, SDSS, and DESI catalogs. No equations, fitted parameters, ansatzes, or derivations are presented that reduce the claimed deficits or radial profiles to definitions or self-referential quantities. AGN classification relies on external line-ratio diagnostics from public surveys rather than any self-defined or self-cited uniqueness theorem. The central claim is a direct statistical finding from the data splits, with no load-bearing self-citation chain or renaming of known results as new unification. This is a standard data-driven study whose conclusions stand or fall on sample selection and measurement accuracy, not on internal logical reduction.
Axiom & Free-Parameter Ledger
axioms (2)
- domain assumption Optical spectroscopy from SDSS and DESI correctly identifies AGN-hosting galaxies
- domain assumption HI measurements from ALFALFA and FASHI provide reliable gas fractions after standard corrections
Reference graph
Works this paper leans on
-
[1]
2018, ApJ, 862, 48
Ai, M., & Zhu, M. 2018, ApJ, 862, 48
2018
-
[2]
A., Phillips, M
Baldwin, J. A., Phillips, M. M., & Terlevich, R. 1981, PASP, 93, 5 A Statistical Study of HI Gas in AGN-Hosting and Satellite Galaxies from ALFALFA and FASHI 25 0.0 0.2 0.4 0.6 0.8 1.0 R/R180 9.5 9.6 9.7 9.8 9.9 10.0 10.1 10.2 log MHI[M ] (a) AGN-hosting satellites Mass-matched satellites 0.0 0.2 0.4 0.6 0.8 1.0 R/R180 1.5 1.0 0.5 0.0 0.5 1.0 log(MHI/M* )...
1981
-
[3]
R., Schlegel, D
Blanton, M. R., Schlegel, D. J., Strauss, M. A., et al. 2005, AJ, 129, 2562
2005
-
[4]
2019, A&A, 622, A103
Boquien, M., Burgarella, D., Roehlly, Y ., et al. 2019, A&A, 622, A103
2019
-
[5]
2022, A&A Rev., 30, 3
Boselli, A., Fossati, M., & Sun, M. 2022, A&A Rev., 30, 3
2022
-
[6]
2006, PASP, 118, 517
Boselli, A., & Gavazzi, G. 2006, PASP, 118, 517
2006
-
[7]
S., Kennicutt, R
Bothwell, M. S., Kennicutt, R. C., & Lee, J. C. 2009, MNRAS, 400, 154 26 S.-H. Shu, W.-K. Hu, J.-Q. Ge, J.-J. Yu, W.-X. Yang, F.-R. Deng, Y .-G. Wang, 9.0 9.5 10.0 10.5 11.0 log M 0.2 0.0 0.2 0.4 0.6 fHI 1.5 1.0 0.5 0.0 log SFR 0.4 0.2 0.0 0.2 0.4 0.6 fHI 0.0 0.2 0.4 0.6 0.8 1.0 R/R180 0.2 0.0 0.2 0.4 0.6 fHI AGN-hosting Satellite Satellite Fig. 14: Media...
2009
-
[8]
Brinchmann, J., Charlot, S., White, S. D. M., et al. 2004, MNRAS, 351, 1151
2004
-
[9]
2015, MNRAS, 452, 2479
Brown, T., Catinella, B., Cortese, L., et al. 2015, MNRAS, 452, 2479
2015
-
[10]
2003, MNRAS, 344, 1000
Bruzual, G., & Charlot, S. 2003, MNRAS, 344, 1000
2003
-
[11]
2010, MNRAS, 403, 683
Catinella, B., Schiminovich, D., Kauffmann, G., et al. 2010, MNRAS, 403, 683
2010
-
[12]
2018, MNRAS, 476, 875
Catinella, B., Saintonge, A., Janowiecki, S., et al. 2018, MNRAS, 476, 875
2018
-
[13]
M., Binney, J., et al
Cattaneo, A., Faber, S. M., Binney, J., et al. 2009, Nature, 460, 213
2009
-
[14]
2001, MNRAS, 323, 887 Cid Fernandes, R., Mateus, A., Sodr´e, L., Stasi´nska, G., & Gomes, J
Charlot, S., & Longhetti, M. 2001, MNRAS, 323, 887 Cid Fernandes, R., Mateus, A., Sodr´e, L., Stasi´nska, G., & Gomes, J. M. 2005, MNRAS, 358, 363
2001
-
[16]
2021, PASA, 38, e035
Cortese, L., Catinella, B., & Smith, R. 2021, PASA, 38, e035
2021
-
[17]
A., Schaye, J., Bower, R
Crain, R. A., Schaye, J., Bower, R. G., et al. 2015, MNRAS, 450, 1937
2015
-
[18]
2015, ApJ, 799, 82
Cresci, G., Mainieri, V ., Brusa, M., et al. 2015, ApJ, 799, 82
2015
-
[19]
J., Springel, V ., White, S
Croton, D. J., Springel, V ., White, S. D. M., et al. 2006, MNRAS, 365, 11
2006
-
[20]
Dashyan, G., Choi, E., Somerville, R. S., et al. 2019, MNRAS, 487, 5889 D´enes, H., Kilborn, V . A., & Koribalski, B. S. 2014, MNRAS, 444, 667 DESI Collaboration, Abdul-Karim, M., Adame, A. G., et al. 2025, arXiv e-prints, arXiv:2503.14745 Di Matteo, T., Springel, V ., & Hernquist, L. 2005, Nature, 433, 604
Pith/arXiv arXiv 2019
-
[21]
2024, A&A, 686, A184
Ding, Y ., Zhu, L., Pillepich, A., et al. 2024, A&A, 686, A184
2024
-
[22]
A., Crone Odekon, M., et al
Durbala, A., Finn, R. A., Crone Odekon, M., et al. 2020, AJ, 160, 271
2020
-
[23]
D., Kannappan, S
Eckert, K. D., Kannappan, S. J., Stark, D. V ., et al. 2016, ApJ, 824, 124
2016
-
[24]
L., Brown, T., Catinella, B., & Cortese, L
Ellison, S. L., Brown, T., Catinella, B., & Cortese, L. 2019, MNRAS, 482, 5694
2019
-
[25]
2011, ApJ, 743, 45
Evoli, C., Salucci, P., Lapi, A., & Danese, L. 2011, ApJ, 743, 45
2011
-
[26]
2011, MNRAS, 416, 1739
Fabello, S., Kauffmann, G., Catinella, B., et al. 2011, MNRAS, 416, 1739
2011
-
[27]
2012, MNRAS, 427, 2841
Fabello, S., Kauffmann, G., Catinella, B., et al. 2012, MNRAS, 427, 2841
2012
-
[28]
Fabian, A. C. 2012, ARA&A, 50, 455
2012
-
[29]
1997, A&A, 326, 950
Fioc, M., & Rocca-V olmerange, B. 1997, A&A, 326, 950
1997
-
[30]
2020, Universe, 6, 136 A Statistical Study of HI Gas in AGN-Hosting and Satellite Galaxies from ALFALFA and FASHI 27
Foschini, L. 2020, Universe, 6, 136 A Statistical Study of HI Gas in AGN-Hosting and Satellite Galaxies from ALFALFA and FASHI 27
2020
-
[31]
A., et al
Gatto, L., Storchi-Bergmann, T., Riffel, R. A., et al. 2025, MNRAS, 539, 3229
2025
-
[32]
Giovanelli, R., & Haynes, M. P. 1983, AJ, 88, 881
1983
-
[33]
P., Kent, B
Giovanelli, R., Haynes, M. P., Kent, B. R., et al. 2005, AJ, 130, 2598
2005
-
[34]
E., & Gott, III, J
Gunn, J. E., & Gott, III, J. R. 1972, ApJ, 176, 1
1972
-
[35]
G., & Wang, J
Guo, H., Jones, M. G., & Wang, J. 2022, ApJ, 933, L12
2022
-
[36]
2023, AJ, 165, 144
Guy, J., Bailey, S., Kremin, A., et al. 2023, AJ, 165, 144
2023
-
[37]
P., Giovanelli, R., Kent, B
Haynes, M. P., Giovanelli, R., Kent, B. R., et al. 2018, ApJ, 861, 49
2018
-
[38]
M., Kauffmann, G., Brinchmann, J., et al
Heckman, T. M., Kauffmann, G., Brinchmann, J., et al. 2004, ApJ, 613, 109
2004
-
[39]
W., Tremonti, C
Hogg, D. W., Tremonti, C. A., Blanton, M. R., et al. 2005, ApJ, 624, 162
2005
-
[40]
2020, MNRAS, 493, 1587
Hu, W., Catinella, B., Cortese, L., et al. 2020, MNRAS, 493, 1587
2020
-
[41]
2021, MNRAS, 507, 5580
Hu, W., Cortese, L., Staveley-Smith, L., et al. 2021, MNRAS, 507, 5580
2021
-
[42]
P., Giovanelli, R., & Brinchmann, J
Huang, S., Haynes, M. P., Giovanelli, R., & Brinchmann, J. 2012, ApJ, 756, 113
2012
-
[43]
G., Leisman, L., & Webb, A
Janowiecki, S., Jones, M. G., Leisman, L., & Webb, A. 2019, MNRAS, 490, 566
2019
-
[44]
G., Hess, K
Jones, M. G., Hess, K. M., Adams, E. A. K., & Verdes-Montenegro, L. 2020, MNRAS, 494, 2090
2020
-
[45]
Kannappan, S. J. 2004, ApJ, 611, L89
2004
-
[46]
J., Groves, B., Kauffmann, G., & Heckman, T
Kewley, L. J., Groves, B., Kauffmann, G., & Heckman, T. 2006, MNRAS, 372, 961
2006
-
[47]
J., Heisler, C
Kewley, L. J., Heisler, C. A., Dopita, M. A., & Lumsden, S. 2001, ApJS, 132, 37
2001
-
[48]
Lagos, C. D. P., Cora, S. A., & Padilla, N. D. 2008, MNRAS, 388, 587
2008
-
[49]
G., Ibarra-Medel, H., et al
Lammers, C., Iyer, K. G., Ibarra-Medel, H., et al. 2023, ApJ, 953, 26
2023
-
[50]
W., & Mykytyn, D
Lang, D., Hogg, D. W., & Mykytyn, D. 2016, The Tractor: Probabilistic astronomical source detection and measurement, Astrophysics Source Code Library, record ascl:1604.008, ascl:1604.008
2016
-
[51]
Li, X., Li, C., & Mo, H. J. 2025, ApJ, 980, 145
2025
-
[52]
J., Xiao, T., & Wang, J
Li, X., Li, C., Mo, H. J., Xiao, T., & Wang, J. 2022, ApJ, 941, 48 Łokas, E. L. 2020, A&A, 638, A133
2022
-
[53]
2006, MNRAS, 369, 1021
Mayer, L., Mastropietro, C., Wadsley, J., Stadel, J., & Moore, B. 2006, MNRAS, 369, 1021
2006
-
[54]
1983, ApJ, 264, 24
Merritt, D. 1983, ApJ, 264, 24
1983
-
[55]
1998, ApJ, 495, 139
Moore, B., Lake, G., & Katz, N. 1998, ApJ, 495, 139
1998
-
[56]
R., Leslie, S
Mulcahey, C. R., Leslie, S. K., Jackson, T. M., et al. 2022, A&A, 665, A144
2022
-
[57]
2019, Computational Astrophysics and Cosmology, 6, 2
Nelson, D., Springel, V ., Pillepich, A., et al. 2019, Computational Astrophysics and Cosmology, 6, 2
2019
-
[58]
M., Bluck, A
Piotrowska, J. M., Bluck, A. F. L., Maiolino, R., & Peng, Y . 2022, MNRAS, 512, 1052
2022
-
[59]
M., Jaff´e, Y
Poggianti, B. M., Jaff´e, Y . L., Moretti, A., et al. 2017, Nature, 548, 304
2017
-
[60]
J., & Mulchaey, J
Rasmussen, J., Ponman, T. J., & Mulchaey, J. S. 2006, MNRAS, 370, 453 28 S.-H. Shu, W.-K. Hu, J.-Q. Ge, J.-J. Yu, W.-X. Yang, F.-R. Deng, Y .-G. Wang,
2006
-
[61]
2007, Properties of low mass dwarf galaxies in the ALFALFA survey, PhD thesis, Cornell
Saintonge, A. 2007, Properties of low mass dwarf galaxies in the ALFALFA survey, PhD thesis, Cornell
2007
-
[62]
J., Fabello, S., et al
Saintonge, A., Tacconi, L. J., Fabello, S., et al. 2012, ApJ, 758, 73
2012
-
[63]
2014, Serbian Astronomical Journal, 189, 1
Salim, S. 2014, Serbian Astronomical Journal, 189, 1
2014
-
[64]
M., Charlot, S., et al
Salim, S., Rich, R. M., Charlot, S., et al. 2007, ApJS, 173, 267
2007
-
[65]
1963, Nature, 197, 1040
Schmidt, M. 1963, Nature, 197, 1040
1963
-
[66]
T., Mushotzky, R
Shimizu, T. T., Mushotzky, R. F., Mel´endez, M., Koss, M., & Rosario, D. J. 2015, MNRAS, 452, 1841
2015
-
[67]
C., Norman, C., Nusser, A., & Wyse, R
Silk, J., Begelman, M. C., Norman, C., Nusser, A., & Wyse, R. F. G. 2024, ApJ, 961, L39
2024
-
[68]
2024, A&A, 691, A308
Siudek, M., Pucha, R., Mezcua, M., et al. 2024, A&A, 691, A308
2024
-
[69]
C., Solanes, J
Toribio, M. C., Solanes, J. M., Giovanelli, R., Haynes, M. P., & Martin, A. M. 2011, ApJ, 732, 93
2011
-
[70]
A., Heckman, T
Tremonti, C. A., Heckman, T. M., Kauffmann, G., et al. 2004, ApJ, 613, 898
2004
-
[71]
2023, A&A, 678, A127
Venturi, G., Treister, E., Finlez, C., et al. 2023, A&A, 678, A127
2023
-
[72]
2022, MNRAS, 516, 4293
Wang, B. 2022, MNRAS, 516, 4293
2022
-
[73]
Wang, J., & Wei, J. Y . 2008, ApJ, 679, 86
2008
-
[74]
2024, Nature, 632, 1009
Wang, T., Xu, K., Wu, Y ., et al. 2024, Nature, 632, 1009
2024
-
[75]
E., van Dokkum, P
Whitaker, K. E., van Dokkum, P. G., Brammer, G., & Franx, M. 2012, ApJ, 754, L29
2012
-
[76]
L., Xia, X
Wu, H., Zou, Z. L., Xia, X. Y ., & Deng, Z. G. 1998, A&AS, 132, 181
1998
-
[77]
2026, ApJ, 997, 254
Yan, S., Ma, A., Yu, Q., et al. 2026, ApJ, 997, 254
2026
-
[78]
J., van den Bosch, F
Yang, X., Mo, H. J., van den Bosch, F. C., et al. 2007, ApJ, 671, 153
2007
-
[79]
G., Adelman, J., Anderson, Jr., J
York, D. G., Adelman, J., Anderson, Jr., J. E., et al. 2000, AJ, 120, 1579
2000
-
[80]
2024, Science China Physics, Mechanics, and Astronomy, 67, 219511
Zhang, C.-P., Zhu, M., Jiang, P., et al. 2024, Science China Physics, Mechanics, and Astronomy, 67, 219511
2024
-
[81]
2009, MNRAS, 397, 1243
Zhang, W., Li, C., Kauffmann, G., et al. 2009, MNRAS, 397, 1243
2009
discussion (0)
Sign in with ORCID, Apple, or X to comment. Anyone can read and Pith papers without signing in.