Probing the ubiquity of complex ices in protostars with JWST: the first systematic quantification of weak ice bands between 6.8 and 7.9 micron
Pith reviewed 2026-06-25 21:24 UTC · model grok-4.3
The pith
JWST spectra of 21 protostars show weak complex ice bands at 7.24 and 7.40 microns are common and correlated.
A machine-rendered reading of the paper's core claim, the machinery that carries it, and where it could break.
Core claim
The central claim is that the first systematic JWST survey of the 6.8-7.9 micron region in 21 protostars detects the 7.24 and 7.40 micron bands in most sources; these bands correlate in strength and position, are best reproduced by HCOO- laboratory spectra, yet require additional contributions from molecules such as C2H5OH, CH3CHO, and CH3COCH3 to match observed intensity ratios, indicating that weak complex ice features are potentially ubiquitous.
What carries the argument
The pair of correlated absorption bands at 7.24 and 7.40 microns, assigned as carriers by direct comparison of observed peak positions, widths, and relative strengths to laboratory ice spectra.
If this is right
- The methane ice band at 7.67 microns maintains nearly identical peak position and width in every source examined.
- The 7.24 and 7.40 micron bands appear together whenever either is detected, pointing to a shared formation pathway or carrier.
- Intensity mismatches with single-species lab spectra imply that multiple complex molecules contribute to the same wavelength region.
- Prior infrared facilities missed these weak bands because of insufficient sensitivity and resolution, so the features are now accessible for routine study.
Where Pith is reading between the lines
- Chemical models of early star formation may need to raise predicted abundances of complex ices to match the observed band strengths.
- Higher-resolution JWST observations of additional protostars could test whether the 7.02 micron band follows the same pattern as the correlated pair.
- Laboratory work on mixed ices containing HCOO- plus alcohols and aldehydes could resolve remaining intensity discrepancies and tighten carrier assignments.
Load-bearing premise
Laboratory spectra of pure or mixed ices accurately reproduce the exact peak positions, widths, and intensity ratios seen in the interstellar sources, allowing unambiguous carrier assignment.
What would settle it
New laboratory measurements that reproduce both the 7.24/7.40 micron positions and their exact intensity ratio using only HCOO- without extra species, or new protostellar spectra in which the two bands show no correlation in occurrence or strength.
Figures


read the original abstract
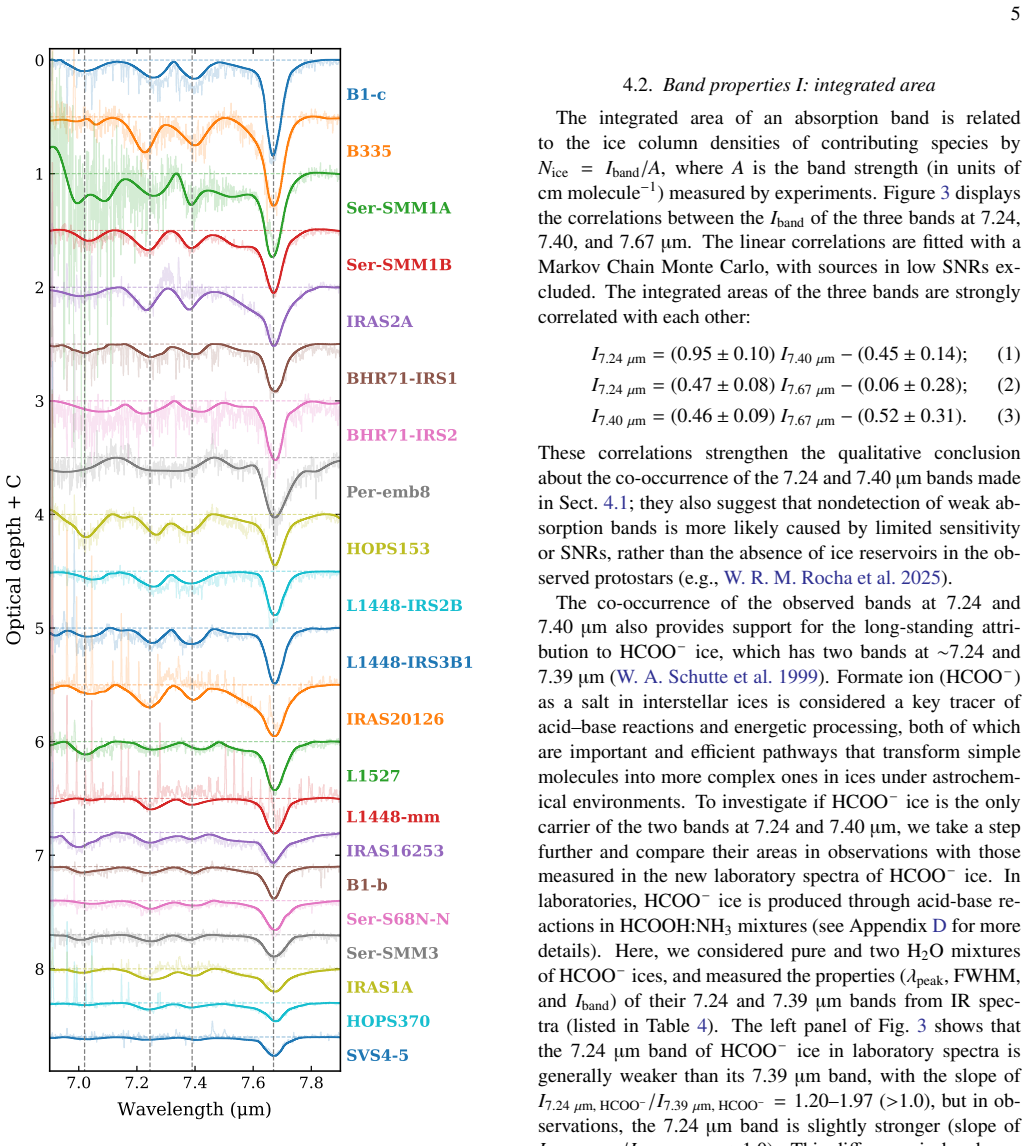
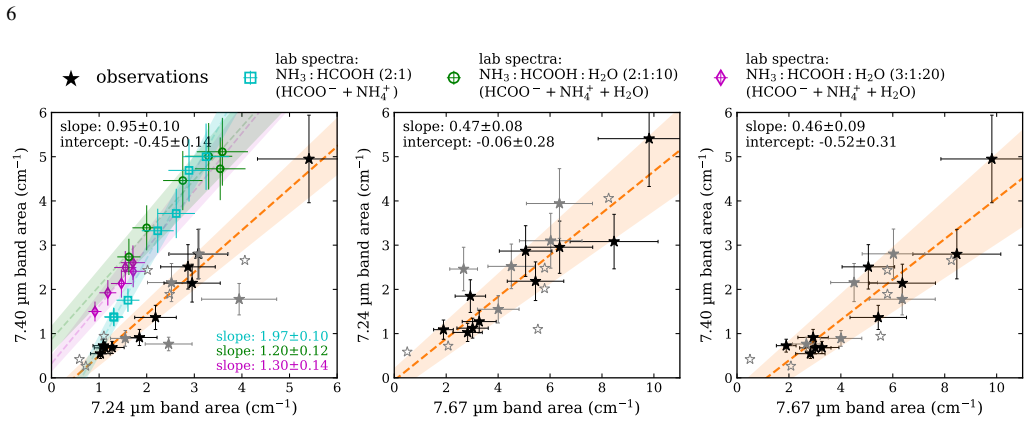
Complex organic molecules (COMs) are the key to understanding the chemical evolution from simple interstellar molecules to potential prebiotic material. Although COMs have been extensively studied in the gas phase toward protostars, their counterparts in ices, where they are thought to form at earlier stages, remain far less constrained. A number of diagnostic features of complex ices lie between 6.8 and 8.8 um, a region known as the "COM ice fingerprint range," but previous infrared facilities lacked the sensitivity and spectral resolution required to quantify the weak bands therein. With the unprecedented sensitivity and resolving power of JWST, these limitations can now be overcome. Here, we present the first large-sample quantitative study of the absorption features at 7.02, 7.24, 7.40, and 7.67 um, using MIRI-MRS spectra of 21 protostars. The CH4 band at 7.67 um is the strongest band and shows remarkably uniform peak positions (7.67-7.68 um) and FWHMs (0.06-0.08 um), suggesting CH4 ice as its dominant carrier. The 7.24 and 7.40 um bands exhibit larger source-to-source variations in peak positions and FWHMs, but their occurrence and intensities are strongly correlated with each other. Comparisons with existing and new laboratory spectra suggest HCOO- as the most likely carrier of these two bands, yet HCOO- cannot fully reproduce their intensity ratios, implying additional contributions from other species such as C2H5OH, CH3CHO, and CH3COCH3. Our results reveal, for the first time, the potential ubiquity of weak features of complex ices in protostars, which have remained largely undetected due to observational limitations.
Editorial analysis
A structured set of objections, weighed in public.
Referee Report
Summary. The paper presents the first large-sample quantitative analysis of weak absorption features at 7.02, 7.24, 7.40, and 7.67 μm in JWST MIRI-MRS spectra toward 21 protostars. The 7.67 μm band is attributed to CH4 ice based on uniform peak positions and FWHMs; the correlated 7.24 and 7.40 μm bands are assigned primarily to HCOO− (with possible contributions from C2H5OH, CH3CHO, CH3COCH3) via comparison to laboratory spectra, despite noted mismatches in intensity ratios. The central conclusion is the potential ubiquity of weak complex-ice features in protostars.
Significance. If the carrier assignments hold after quantitative refinement, the work establishes the first systematic detection of previously undetectable weak complex-ice bands across a protostellar sample, directly constraining the ice-phase formation of COMs at early stages. The reported source-to-source correlations and uniform CH4 properties provide falsifiable observational benchmarks that can be tested with future JWST data or expanded laboratory libraries.
major comments (1)
- [Abstract and results/discussion on 7.24/7.40 μm bands] Abstract and band-assignment discussion: the text states that pure or mixed HCOO− laboratory spectra cannot reproduce the observed intensity ratios of the 7.24 and 7.40 μm bands, yet no quantitative multi-component decomposition, residual analysis, or abundance upper limits are provided to demonstrate that the residual intensity is still carried by complex ices rather than other contributors. This directly affects the robustness of the ubiquity claim for complex ices.
minor comments (2)
- The manuscript would benefit from an explicit table listing measured peak positions, FWHMs, and integrated optical depths for each source and band to allow independent verification of the reported correlations and uniformity.
- Baseline subtraction and data-reduction procedures for the MIRI-MRS spectra are not described in sufficient detail to assess potential systematic effects on the weak-band intensities.
Simulated Author's Rebuttal
We thank the referee for their constructive and detailed review. The single major comment raises a valid point about the need for quantitative support of the band assignments. We address it below and have revised the manuscript to incorporate additional analysis.
read point-by-point responses
-
Referee: Abstract and band-assignment discussion: the text states that pure or mixed HCOO− laboratory spectra cannot reproduce the observed intensity ratios of the 7.24 and 7.40 μm bands, yet no quantitative multi-component decomposition, residual analysis, or abundance upper limits are provided to demonstrate that the residual intensity is still carried by complex ices rather than other contributors. This directly affects the robustness of the ubiquity claim for complex ices.
Authors: We agree that the lack of a quantitative multi-component decomposition limits the strength of the assignment and the ubiquity claim. In the revised manuscript we have added a new subsection performing linear decomposition of the 7.24/7.40 μm region using the available laboratory spectra of HCOO− together with C2H5OH, CH3CHO and CH3COCH3. The fits, residuals, and derived column-density ratios are now shown for the full sample. The residuals after subtracting the best-fit HCOO− component are consistent with the additional COMs, and we report 3σ upper limits on any non-ice contribution. These results are summarized in the abstract and strengthen the conclusion that complex ices are ubiquitous. revision: yes
Circularity Check
No circularity: observational data compared to independent lab spectra
full rationale
The paper derives its ubiquity claim by direct comparison of JWST MIRI-MRS spectra (peak positions, FWHMs, correlations between 7.24/7.40 μm bands) against existing and new laboratory ice spectra for carrier assignment. No equations, fitted parameters, or self-citation chains reduce the reported intensities, correlations, or assignments to quantities defined by the same observational dataset. The text explicitly notes mismatches in intensity ratios and presents the HCOO− assignment as suggestive with possible additional contributors, keeping the derivation self-contained against external benchmarks.
Axiom & Free-Parameter Ledger
axioms (1)
- domain assumption Laboratory spectra of candidate ices (HCOO-, C2H5OH, etc.) accurately reproduce interstellar band positions and relative intensities
Reference graph
Works this paper leans on
-
[1]
2015, MNRAS, 449, L16, doi: 10.1093/mnrasl/slv009
Balucani, N., Ceccarelli, C., & Taquet, V . 2015, MNRAS, 449, L16, doi: 10.1093/mnrasl/slv009
-
[2]
Boogert, A. C. A., Gerakines, P. A., & Whittet, D. C. B. 2015, ARA&A, 53, 541, doi: 10.1146/annurev-astro-082214-122348
work page internal anchor Pith review doi:10.1146/annurev-astro-082214-122348 2015
-
[3]
Boogert, A. C. A., Pontoppidan, K. M., Knez, C., et al. 2008, ApJ, 678, 985, doi: 10.1086/533425
-
[4]
2023, in Astronomical Society of the Pacific Conference Series, V ol
Ceccarelli, C., Codella, C., Balucani, N., et al. 2023, in Astronomical Society of the Pacific Conference Series, V ol. 534, Protostars and Planets VII, ed. S. Inutsuka, Y . Aikawa, T. Muto, K. Tomida, & M. Tamura, 379
2023
-
[5]
Chen, Y ., van Gelder, M. L., Nazari, P., et al. 2023, A&A, 678, A137, doi: 10.1051/0004-6361/202346491
-
[6]
Chen, Y ., Rocha, W. R. M., van Dishoeck, E. F., et al. 2024, A&A, 690, A205, doi: 10.1051/0004-6361/202450706
-
[7]
2021, OpTool: Command-line driven tool for creating complex dust opacities„ Astrophysics Source Code Library, record ascl:2104.010 http://ascl.net/2104.010
Dominik, C., Min, M., & Tazaki, R. 2021, OpTool: Command-line driven tool for creating complex dust opacities„ Astrophysics Source Code Library, record ascl:2104.010 http://ascl.net/2104.010
2021
-
[8]
Federman, S. A., Megeath, S. T., Rubinstein, A. E., et al. 2024, ApJ, 966, 41, doi: 10.3847/1538-4357/ad2fa0
-
[9]
2022, ApJ, 924, 110, doi: 10.3847/1538-4357/ac3834
Fedoseev, G., Qasim, D., Chuang, K.-J., et al. 2022, ApJ, 924, 110, doi: 10.3847/1538-4357/ac3834
-
[10]
Francis, L., van Gelder, M. L., van Dishoeck, E. F., et al. 2024, A&A, 683, A249, doi: 10.1051/0004-6361/202348105
-
[11]
Fuchs, G. W., Cuppen, H. M., Ioppolo, S., et al. 2009, A&A, 505, 629, doi: 10.1051/0004-6361/200810784
-
[12]
Garrod, R. T., Jin, M., Matis, K. A., et al. 2022, ApJS, 259, 1, doi: 10.3847/1538-4365/ac3131
-
[13]
Gibb, E. L., Whittet, D. C. B., Boogert, A. C. A., & Tielens, A. G. G. M. 2004, ApJS, 151, 35, doi: 10.1086/381182
-
[14]
Gieser, C., Rocha, W. R. M., Chen, Y ., et al. 2026, A&A, 709, A235, doi: 10.1051/0004-6361/202558615
-
[15]
Harris, C. R., Millman, K. J., van der Walt, S. J., et al. 2020, Nature, 585, 357, doi: 10.1038/s41586-020-2649-2
-
[16]
Herbst, E., & van Dishoeck, E. F. 2009, ARA&A, 47, 427, doi: 10.1146/annurev-astro-082708-101654
-
[17]
Hudson, R. L., Gerakines, P. A., & Yarnall, Y . Y . 2022, ApJ, 925, 156, doi: 10.3847/1538-4357/ac3e74
-
[18]
Hunter, J. D. 2007, Computing in Science & Engineering, 9, 90, doi: 10.1109/MCSE.2007.55 Jørgensen, J. K., Belloche, A., & Garrod, R. T. 2020, ARA&A, 58, 727, doi: 10.1146/annurev-astro-032620-021927
-
[19]
Law, D. R., E. Morrison, J., Argyriou, I., et al. 2023, AJ, 166, 45, doi: 10.3847/1538-3881/acdddc
-
[20]
2025, Life Sciences in Space Research, doi: https://doi.org/10.1016/j.lssr.2025.10.005
Nazari, P. 2025, Life Sciences in Space Research, doi: https://doi.org/10.1016/j.lssr.2025.10.005
-
[21]
Nazari, P., Meijerhof, J. D., van Gelder, M. L., et al. 2022, A&A, 668, A109, doi: 10.1051/0004-6361/202243788
-
[22]
Nazari, P., Rocha, W. R. M., Rubinstein, A. E., et al. 2024, A&A, 686, A71, doi: 10.1051/0004-6361/202348695
-
[23]
Newville, M., Stensitzki, T., Allen, D. B., & Ingargiola, A. 2014, LMFIT: Non-Linear Least-Square Minimization and Curve-Fitting for Python, 0.8.0 Zenodo, doi: 10.5281/zenodo.11813 Öberg, K. I., Boogert, A. C. A., Pontoppidan, K. M., et al. 2011, ApJ, 740, 109, doi: 10.1088/0004-637X/740/2/109
-
[24]
2020, A&A, 639, A4, doi: 10.1051/0004-6361/202037497
Linnartz, H. 2020, A&A, 639, A4, doi: 10.1051/0004-6361/202037497
-
[25]
Rayalacheruvu, P., Majumdar, L., Rocha, W. R. M., et al. 2025, ApJS, 281, 51, doi: 10.3847/1538-4365/ae112f
-
[26]
2023, Detection and Flagging of Showers and Snowballs in JWST„ Technical Report JWST-STScI-008545
Regan, M. 2023, Detection and Flagging of Showers and Snowballs in JWST„ Technical Report JWST-STScI-008545
2023
-
[27]
Rocha, W. R. M., van Dishoeck, E. F., Ressler, M. E., et al. 2024, A&A, 683, A124, doi: 10.1051/0004-6361/202348427
-
[28]
Rocha, W. R. M., McClure, M. K., Sturm, J. A., et al. 2025, A&A, 693, A288, doi: 10.1051/0004-6361/202451505
-
[29]
A., Boogert, A
Schutte, W. A., Boogert, A. C. A., Tielens, A. G. G. M., et al. 1999, A&A, 343, 966
1999
-
[30]
Simons, M. A. J., Lamberts, T., & Cuppen, H. M. 2020, A&A, 634, A52, doi: 10.1051/0004-6361/201936522
-
[31]
Slavicinska, K., Boogert, A. C. A., Tychoniec, Ł., et al. 2025, A&A, 693, A146, doi: 10.1051/0004-6361/202451383
-
[32]
Tabone, B., Bettoni, G., van Dishoeck, E. F., et al. 2023, Nature Astronomy, 7, 805, doi: 10.1038/s41550-023-01965-3 Terwisscha van Scheltinga, J., Ligterink, N. F. W., Boogert, A. C. A., van Dishoeck, E. F., & Linnartz, H. 2018, A&A, 611, A35, doi: 10.1051/0004-6361/201731998
-
[33]
M., Yang, Y .-L., Gross, R., Sakai, N., & Kaiser, R
Turner, A. M., Yang, Y .-L., Gross, R., Sakai, N., & Kaiser, R. I. 2026, ApJ, 1000, 17, doi: 10.3847/1538-4357/ae3743 van Dishoeck, E. F., Tychoniec, Ł., Rocha, W. R. M., et al. 2025, A&A, 699, A361, doi: 10.1051/0004-6361/202554444 van Gelder, M. L., Francis, L., van Dishoeck, E. F., et al. 2024a, A&A, 692, A197, doi: 10.1051/0004-6361/202451967 van Geld...
-
[34]
Virtanen, P., Gommers, R., Oliphant, T. E., et al. 2020, Nature Methods, 17, 261, doi: 10.1038/s41592-019-0686-2
-
[35]
2002, ApJL, 571, L173, doi: 10.1086/341412
Watanabe, N., & Kouchi, A. 2002, ApJL, 571, L173, doi: 10.1086/341412
-
[36]
Yang, Y .-L., Green, J. D., Pontoppidan, K. M., et al. 2022, ApJL, 941, L13, doi: 10.3847/2041-8213/aca289
-
[37]
Yarnall, Y . Y ., & Hudson, R. L. 2022, ApJL, 931, L4, doi: 10.3847/2041-8213/ac6b32
discussion (0)
Sign in with ORCID, Apple, or X to comment. Anyone can read and Pith papers without signing in.