EvoOptiGraph: Weakness-Driven Coevolution via Graph-Based Structural Generation for Optimization Modeling
Pith reviewed 2026-06-26 05:14 UTC · model grok-4.3
The pith
Representing MILPs as attributed bipartite graphs and evolving them from model weaknesses creates a closed-loop training process that raises LLM accuracy on optimization modeling.
A machine-rendered reading of the paper's core claim, the machinery that carries it, and where it could break.
Core claim
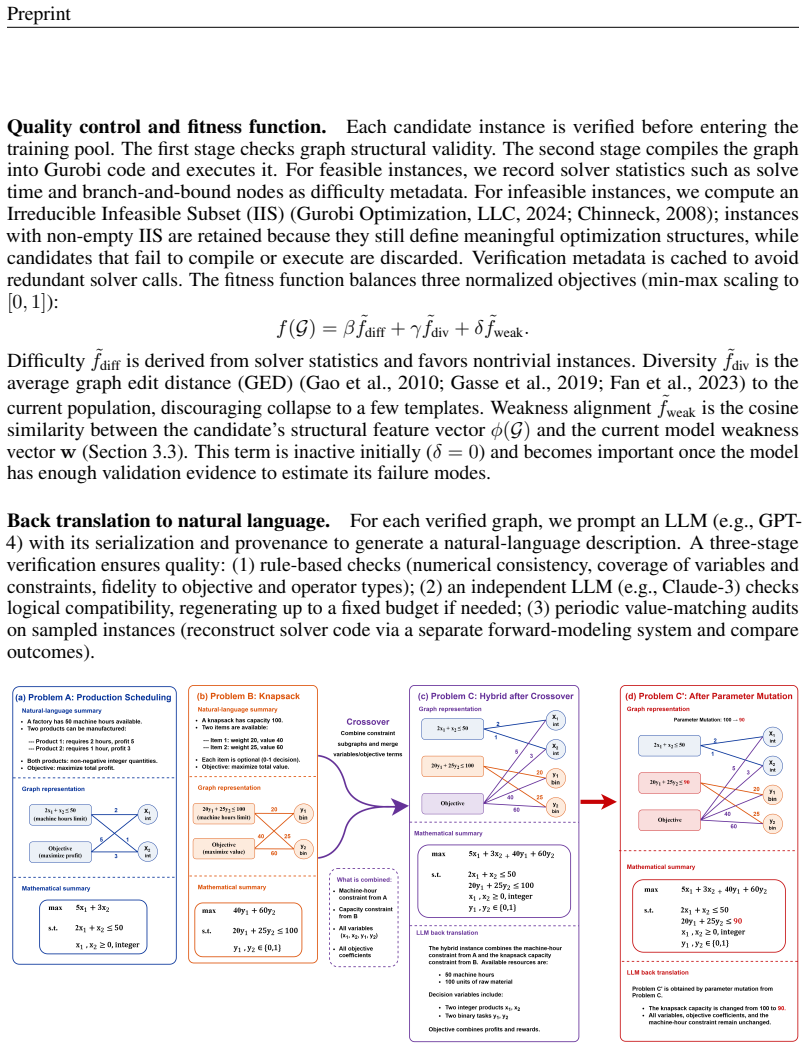
EvoOptiGraph represents each mixed-integer linear program as an attributed bipartite graph and applies validity-preserving evolutionary operators to generate structurally diverse instances. The evolved graphs are converted into solver code and natural language via deterministic compilation and verified back-translation. Training proceeds in two stages: supervised fine-tuning on an initial dataset, followed by reinforcement learning with verifiable rewards where graph-derived weakness signals guide generation of new instances targeting the model's failures, forming a closed loop that continuously updates the training distribution.
What carries the argument
Attributed bipartite graph representation of MILPs combined with validity-preserving evolutionary operators and weakness signals from RLVR that drive instance generation in a closed training loop.
If this is right
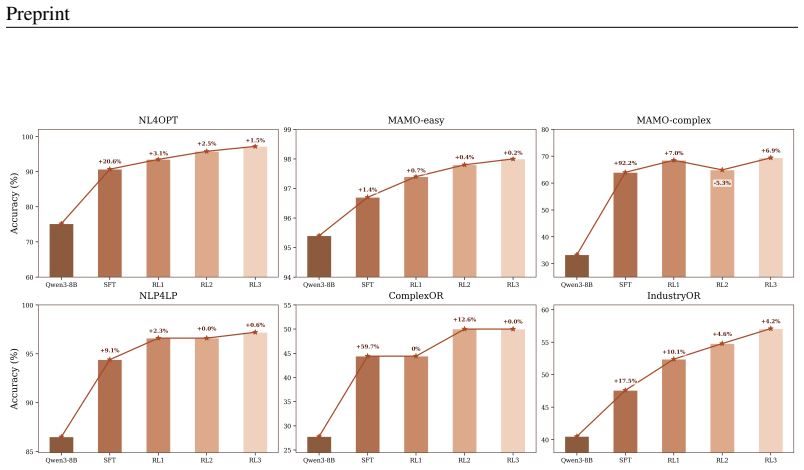
- The model achieves higher accuracy in producing correct natural-language-to-solver-code mappings than larger generalist models and agentic baselines.
- Generated solver code exhibits improved executability on the six public datasets.
- Generalization improves because the training distribution is continuously expanded with instances that expose current model failures.
- The two-stage process of SFT followed by RLVR enables ongoing adaptation without requiring new external data sources.
Where Pith is reading between the lines
- The same graph-evolution loop could be tested on other structured generation tasks such as constraint satisfaction or scheduling problems to check whether the weakness-driven mechanism transfers.
- If the evolutionary operators preserve only a narrow class of structural changes, the closed loop might amplify existing biases in the initial dataset rather than expand coverage.
- A direct test would measure whether performance plateaus once the model's weaknesses stabilize within the graph operators' reachable set.
Load-bearing premise
The validity-preserving evolutionary operators on bipartite graphs and the weakness signals extracted from the model produce new instances that genuinely improve generalization rather than merely fitting the closed-loop training process.
What would settle it
Evaluating the trained model on a fresh set of optimization problems whose structural features lie outside the reach of the described evolutionary operators and finding no gain in generalization accuracy relative to a non-coevolved baseline.
Figures


read the original abstract
Automating optimization modeling from natural language with large language models (LLMs) faces two key challenges. First, training corpora lack structural diversity. Second, data generation pipelines remain static and decoupled from model learning. To address these challenges, we propose EvoOptiGraph, a novel framework where data and model co-evolve, driven by model weaknesses. EvoOptiGraph represents each mixed-integer linear program (MILP) as an attributed bipartite graph and applies validity-preserving evolutionary operators to generate structurally diverse instances. The evolved graphs are converted into solver code and natural language via deterministic compilation and verified back-translation. Training proceeds in two stages: supervised fine-tuning (SFT) on an initial dataset, followed by reinforcement learning with verifiable rewards (RLVR), where graph-derived weakness signals guide the generation of new instances targeting the model's failures. This forms a closed loop that continuously updates the training distribution. Empirical results on six public datasets show that EvoOptiGraph significantly outperforms larger generalist models, agentic methods, and specialized baselines in accuracy, executability, and generalization. These results demonstrate that targeted data-model coevolution is an effective strategy for improving LLMs on optimization modeling tasks.
Editorial analysis
A structured set of objections, weighed in public.
Referee Report
Summary. The manuscript presents EvoOptiGraph, a framework for coevolving LLMs and training data for natural language to MILP modeling. MILPs are represented as attributed bipartite graphs, on which validity-preserving evolutionary operators generate diverse instances. These are compiled to code and NL, and a two-stage training (SFT then RLVR) uses model weakness signals to target failures in a closed loop that updates the training distribution. The key empirical claim is that this leads to significant outperformance over larger generalist models, agentic methods, and specialized baselines on six public datasets in terms of accuracy, executability, and generalization.
Significance. Should the reported gains prove robust to proper held-out evaluation, the work would be significant as it provides a concrete mechanism for addressing data diversity and static generation pipelines in optimization modeling. The graph-based representation and verifiable reward structure are positive elements that could generalize to other structured output tasks.
major comments (2)
- [Abstract] Abstract: The assertion of significant outperformance on six public datasets supplies no information on metrics, statistical tests, baseline implementations, data splits, or controls for overfitting, making it impossible to judge whether the data support the generalization claims.
- [Abstract] Abstract (RLVR stage): The closed loop in which graph-derived weakness signals steer instance generation and retraining creates a risk that measured improvements arise from gradual alignment of the training distribution with the evaluation sets rather than from robust modeling; no explicit held-out test distribution independent of the evolutionary loop is described.
minor comments (2)
- [Abstract] The abstract could specify the concrete metrics (e.g., exact-match accuracy, solver success rate) used for the three reported dimensions.
- A schematic of the closed coevolution loop would clarify the data flow between weakness extraction, graph evolution, compilation, and retraining stages.
Simulated Author's Rebuttal
We thank the referee for the detailed feedback on the abstract and the coevolutionary framework. We address each major comment below.
read point-by-point responses
-
Referee: [Abstract] Abstract: The assertion of significant outperformance on six public datasets supplies no information on metrics, statistical tests, baseline implementations, data splits, or controls for overfitting, making it impossible to judge whether the data support the generalization claims.
Authors: We agree that the abstract is concise and omits these specifics. The full manuscript reports accuracy, executability, and generalization metrics with baseline comparisons, data splits, and statistical controls in the Experiments section. We will revise the abstract to incorporate key quantitative results and evaluation details within length constraints. revision: yes
-
Referee: [Abstract] Abstract (RLVR stage): The closed loop in which graph-derived weakness signals steer instance generation and retraining creates a risk that measured improvements arise from gradual alignment of the training distribution with the evaluation sets rather than from robust modeling; no explicit held-out test distribution independent of the evolutionary loop is described.
Authors: The concern is valid in principle. Weakness signals are derived from a validation split held out from the six public test datasets, and the evolutionary process does not access test distributions. We will add an explicit description of this separation in the methodology section of the revision. revision: yes
Circularity Check
No significant circularity; evaluation on independent public benchmarks.
full rationale
The paper describes a closed-loop coevolution process in which weakness signals from the model guide generation of new MILP instances during RLVR, with the training distribution updated iteratively. However, the central empirical claims of improved accuracy, executability, and generalization are validated on six fixed public datasets. These benchmarks function as external, held-out evaluation points independent of the internal generation loop. No load-bearing step reduces the reported performance gains to a definitional equivalence, a fitted parameter renamed as prediction, or a self-citation chain; the outcome is presented as an empirical result rather than a tautology. This matches the default case of a self-contained derivation against external benchmarks.
Axiom & Free-Parameter Ledger
Reference graph
Works this paper leans on
-
[1]
Inherit the machine-hour constraint from Parent A
-
[2]
Inherit the knapsack capacity constraint from Parent B
-
[3]
This new constraint couples an integer variable and a binary variable
Create a new constraint by combining coefficients from both parents: take the coefficient of x1 from Parent A (2) and the coefficient of y1 from Parent B (20), and form the inequality 2x1 + 20y1 ≤30 , where the right-hand side is randomly generated (30). This new constraint couples an integer variable and a binary variable. The objective is the sum of bot...
2024
-
[4]
Presents a single, realistic scenario (e.g., a company, a logistics operation, a planning task)
-
[5]
Uses <DOM_SUBCLASS> as the PRIMARY framework and core storyline
-
[6]
Naturally weaves in <MIN_SUBCLASS> elements as SECONDARY considerations
-
[7]
The <DOM_SUBCLASS> aspects should be clearly dominant (roughly 60-70% of the problem), while <MIN_SUBCLASS> provides the remaining enrichment
-
[8]
Includes specific numerical parameters (costs, capacities, demands, etc.) to make it concrete
-
[9]
Clearly states what needs to be optimized
-
[10]
Describes all constraints naturally within the narrative
-
[11]
Uses appropriate domain terminology from both fields
-
[12]
Knapsack
Does NOT contain any mathematical formulas or variable names For example, if the dominant type is "Knapsack" and secondary is "Bin Packing", you might describe a purchasing manager who primarily needs to select which products to buy within a budget, and additionally must arrange selected products into shipping containers. ## Required Output: Provide ONLY ...
-
[13]
Count decision variables in LP data vs description - do they match?
-
[14]
For EACH variable: are bounds (lower, upper) correctly stated?
-
[15]
For EACH variable: is the type (integer, binary, continuous) correctly described?
-
[16]
Is the objective function direction (min/max) correct?
-
[17]
For EACH objective coefficient: does the description include the exact value?
-
[18]
Count constraints in LP data vs description - do they match?
-
[19]
For EACH constraint: are ALL coefficients exactly correct?
-
[20]
For EACH constraint: are the right-hand side values (bounds) exactly correct?
-
[21]
Are there any numerical values in the LP data that are missing from the description?
-
[22]
Complete Instance
Are there any numerical values in the description that do NOT appear in the LP data? ## Required Output: If ALL checks pass perfectly: "Complete Instance" If ANY discrepancy exists: "Incomplete Instance: [List EVERY specific discrepancy with exact values from LP data that are wrong or missing]" Prompt for Self-Refinement As an Operations Research Expert, ...
2010
-
[23]
Select correctly and incorrectly solved instances from the validation setV val
-
[24]
Extract thed-dimensional feature vectorϕ(G)for each instance (see Section 3.3 for details)
-
[25]
25 Preprint Figure 6: An Example of t-SNE Feature Visualization In the resulting plot, correctly and incorrectly solved instances are marked with different colors
Apply t-SNE to project the features into two dimensions for visualization. 25 Preprint Figure 6: An Example of t-SNE Feature Visualization In the resulting plot, correctly and incorrectly solved instances are marked with different colors. Figure 6 shows one representative example from a particular run. If the two classes exhibit visible clustering pattern...
discussion (0)
Sign in with ORCID, Apple, or X to comment. Anyone can read and Pith papers without signing in.