Boundary Degree as a Node-level Feature for Epidemic Scenario Identification in Agent-based Cascade Simulations
Pith reviewed 2026-06-30 01:35 UTC · model grok-4.3
The pith
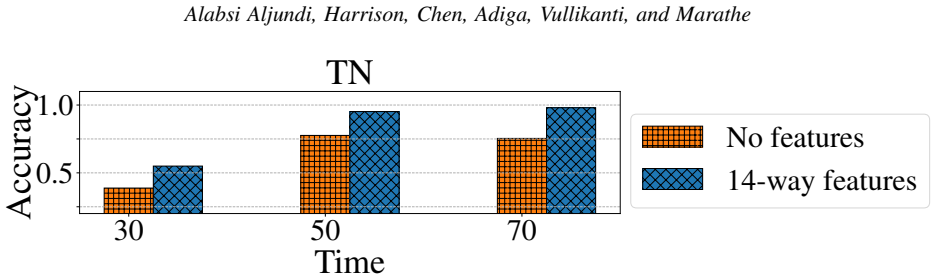
Boundary degree as a per-node feature improves epidemic scenario identification accuracy by 19%.
A machine-rendered reading of the paper's core claim, the machinery that carries it, and where it could break.
Core claim
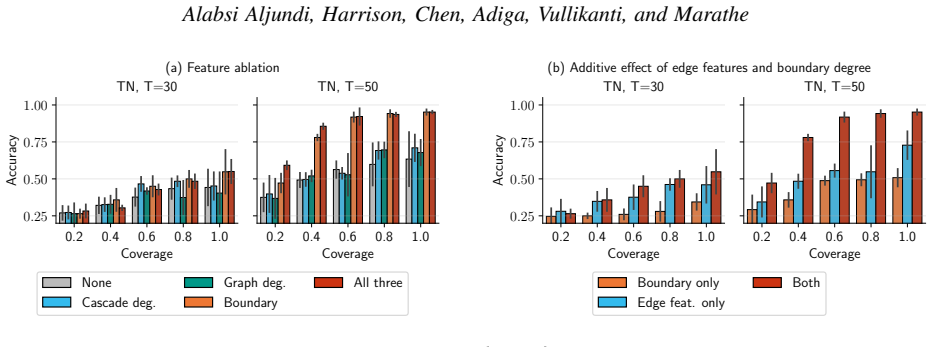
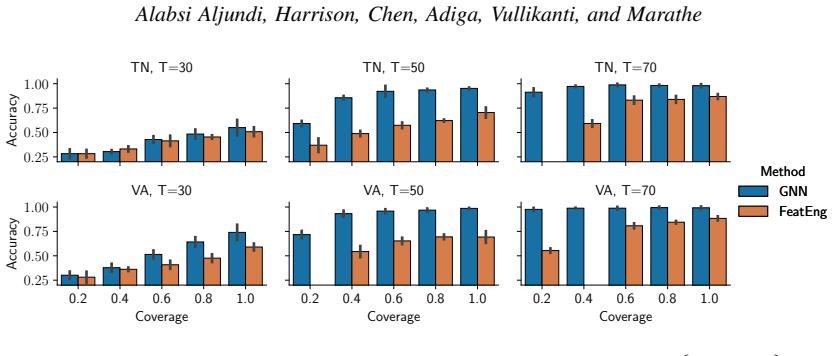
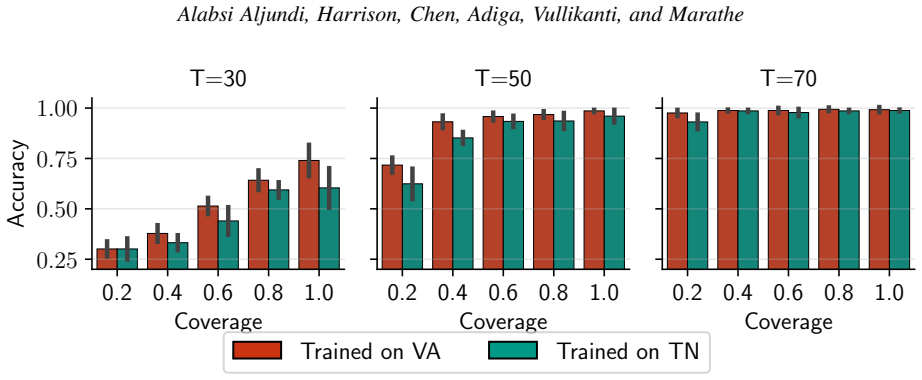
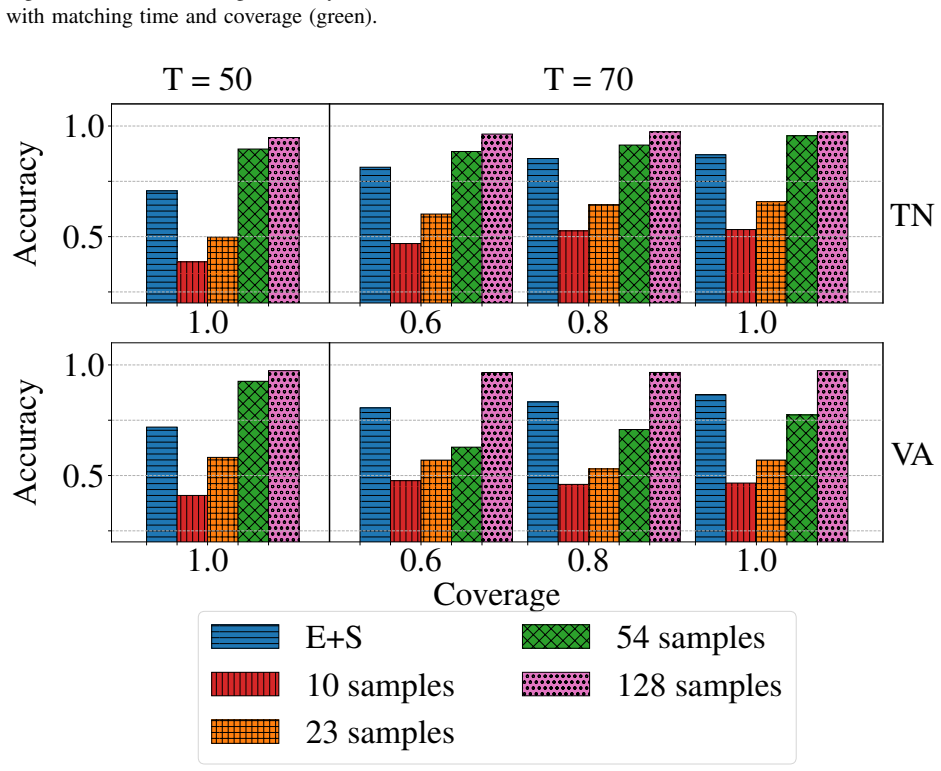
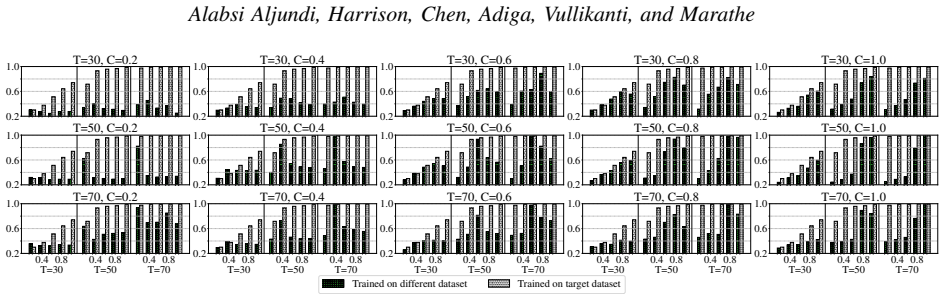
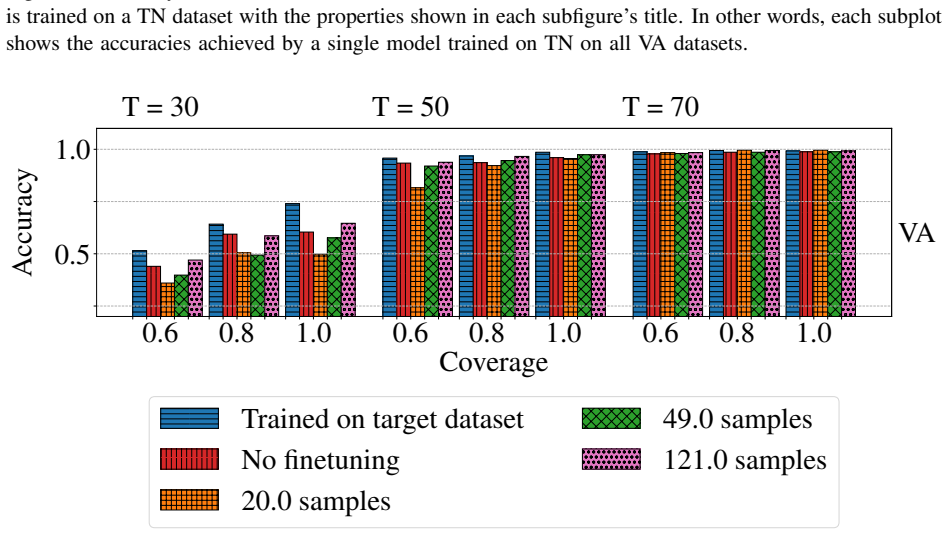
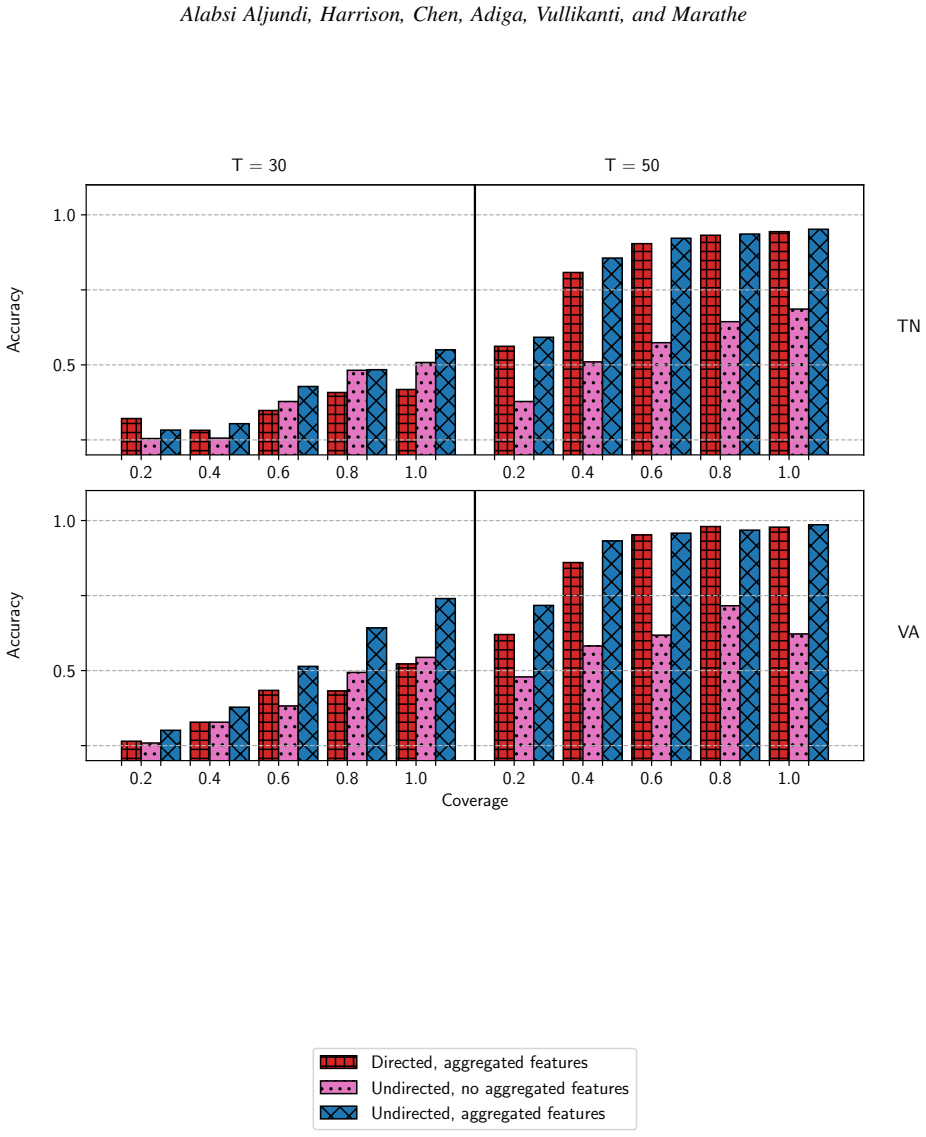
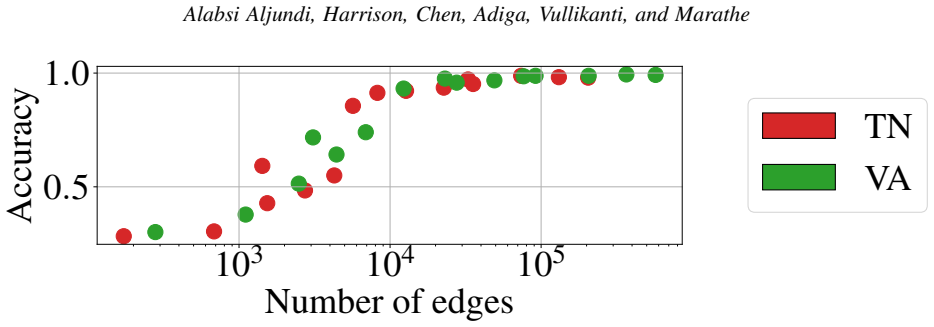
Boundary degree, the number of uninfected contacts of an infected node, serves as an effective per-node feature that raises scenario identification accuracy by 19% in agent-based cascade simulations on Tennessee and Virginia networks. Edge features provide complementary gains with theoretical support, and some epidemic scenarios are provably indistinguishable without this information. Per-node boundary statistics outperform earlier aggregate versions in feature importance.
What carries the argument
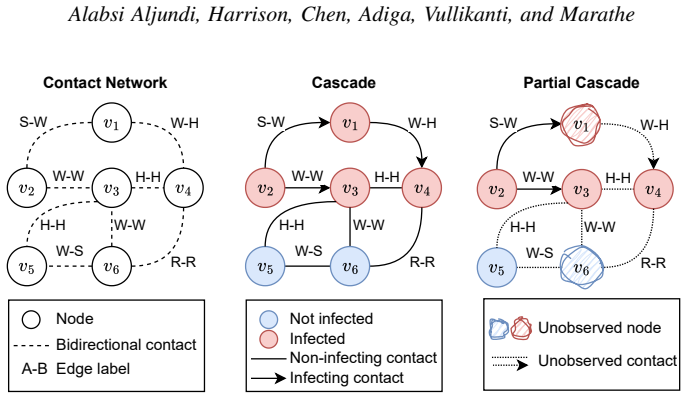
Boundary degree: the count of an infected node's contacts in the underlying contact network that were not infected. It acts as a per-node cascade feature to distinguish epidemic scenarios.
If this is right
- Boundary degree alone improves scenario identification accuracy by 19%.
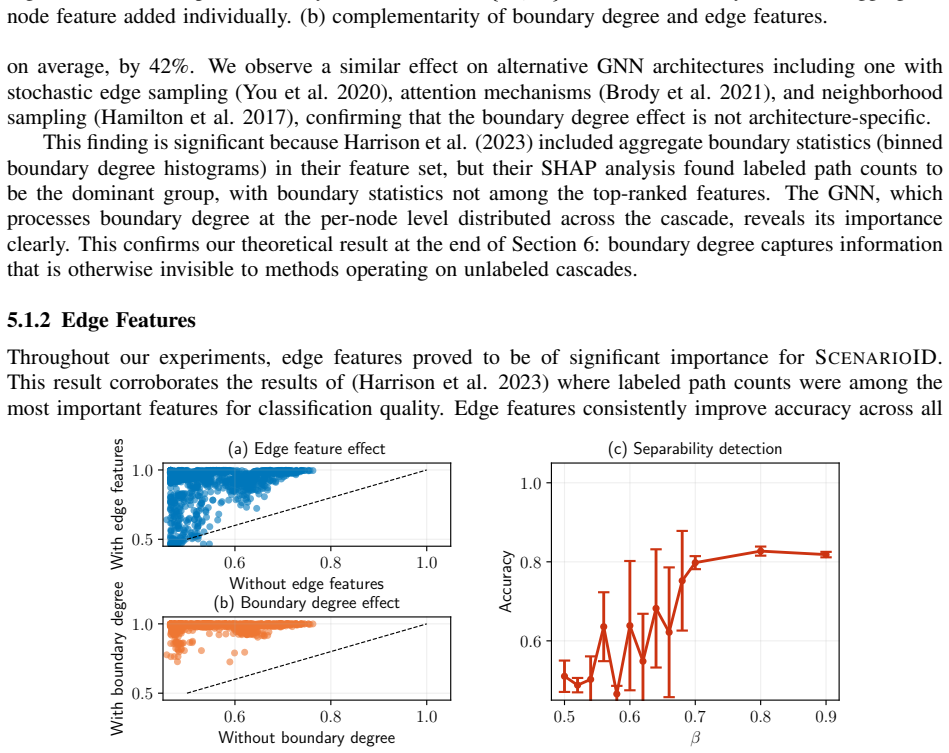
- Edge features consistently improve accuracy across all settings.
- Certain epidemic scenarios are indistinguishable without boundary or edge information.
- Per-node representation of boundary information reveals its importance more clearly than aggregate statistics.
- Contact tracing applications should track contacts with non-infected individuals.
Where Pith is reading between the lines
- Boundary degree could be tested on other types of networks or real outbreak data to see if the accuracy gain holds.
- The feature might help in designing better surveillance systems that collect non-infection contact data.
- Combining boundary degree with machine learning models beyond the ones tested here could yield further gains.
Load-bearing premise
The agent-based cascade simulations on the Tennessee and Virginia contact networks faithfully represent the distinguishable epidemic scenarios used in the identification task.
What would settle it
Running the identification task on actual epidemic data from a real outbreak where the true scenario is known, and checking whether boundary degree still provides a similar accuracy boost.
Figures
read the original abstract
Characterizing the scenario underlying an epidemic from its disease cascade is an important task in simulation analytics. We propose boundary degree, the count of an infected node's contacts in the underlying contact network that were not infected, as a per-node cascade feature for this task. Through systematic ablation on realistic social contact networks of Tennessee and Virginia, we show that boundary degree alone improves scenario identification accuracy by 19%. Edge features, whose importance was observed empirically by prior work, consistently improve accuracy across all settings; we provide theoretical grounding for this observation. These effects are complementary. We prove that certain epidemic scenarios are indistinguishable without boundary or edge information. Prior feature engineering approaches included aggregate boundary statistics, but these were not among the top-ranked feature groups; the per-node representation we propose reveals their importance clearly. Our results suggest that contact tracing applications should track contacts with non-infected individuals, not only transmissions.
Editorial analysis
A structured set of objections, weighed in public.
Referee Report
Summary. The paper proposes boundary degree—the count of an infected node's uninfected contacts in the underlying contact network—as a per-node feature for identifying the epidemic scenario from observed disease cascades generated by agent-based simulations. Using systematic ablation on realistic contact networks of Tennessee and Virginia, it reports that boundary degree alone yields a 19% improvement in scenario identification accuracy. The work also supplies theoretical grounding for the utility of edge features observed in prior studies, proves that certain epidemic scenarios are indistinguishable without boundary or edge information, and notes that aggregate boundary statistics were not top-ranked in earlier feature sets while the per-node version reveals their value. Implications for contact-tracing applications are discussed.
Significance. If the reported accuracy gain is substantiated with full experimental details, boundary degree could become a standard node-level feature in cascade analytics and contact-tracing pipelines, shifting attention from transmissions alone to non-infected contacts. The proof of indistinguishability constitutes a clear theoretical contribution that directly supports the empirical ablation results. The observation that per-node rather than aggregate boundary statistics matter is a useful clarification of prior work.
major comments (3)
- [Abstract and Results] Abstract and the ablation study in the results: the central claim that boundary degree alone improves scenario identification accuracy by 19% is stated without the baseline accuracy value, the classifier or identification algorithm employed, the number of scenarios or simulation runs, the precise definition of accuracy, or any statistical test. These omissions make the magnitude and reliability of the reported gain impossible to evaluate.
- [Methods / Simulation Setup] Simulation setup and network sections: the distinguishability of the epidemic scenarios used for the identification task is load-bearing for the utility claim, yet the manuscript supplies no parameter ranges for the epidemic model (transmission probability, recovery rate, etc.), no sensitivity analysis, and no validation of the generated cascades against observed outbreaks. The proof of indistinguishability is referenced but does not address whether the chosen model parameters artificially enhance separability.
- [Theoretical Analysis] Theoretical section: while a proof that certain scenarios are indistinguishable without boundary or edge information is asserted, the manuscript does not state the precise theorem, the assumptions on the cascade process, or the conditions under which the result holds, preventing assessment of its scope relative to the empirical networks.
minor comments (2)
- [Methods] Notation for boundary degree should be introduced with an explicit equation or definition early in the methods rather than only in prose.
- [Abstract] The abstract's phrasing that 'edge features... consistently improve accuracy across all settings' would benefit from a supporting table or figure reference.
Simulated Author's Rebuttal
We thank the referee for the constructive feedback on clarity and completeness. We address each major comment below and indicate planned revisions.
read point-by-point responses
-
Referee: [Abstract and Results] Abstract and the ablation study in the results: the central claim that boundary degree alone improves scenario identification accuracy by 19% is stated without the baseline accuracy value, the classifier or identification algorithm employed, the number of scenarios or simulation runs, the precise definition of accuracy, or any statistical test. These omissions make the magnitude and reliability of the reported gain impossible to evaluate.
Authors: We agree that the abstract and results section should explicitly include these details to allow proper evaluation. The manuscript contains the classifier, scenario count, run count, accuracy definition, and statistical test in the methods and supplementary material, but we will revise both the abstract and the ablation study presentation in results to state them directly alongside the 19% figure. revision: yes
-
Referee: [Methods / Simulation Setup] Simulation setup and network sections: the distinguishability of the epidemic scenarios used for the identification task is load-bearing for the utility claim, yet the manuscript supplies no parameter ranges for the epidemic model (transmission probability, recovery rate, etc.), no sensitivity analysis, and no validation of the generated cascades against observed outbreaks. The proof of indistinguishability is referenced but does not address whether the chosen model parameters artificially enhance separability.
Authors: The simulation setup section does specify SIR parameters (transmission probability range and recovery rate), but we acknowledge the absence of sensitivity analysis and will add it to demonstrate that the accuracy gain is robust across the parameter space. The cascades are generated synthetically on realistic networks by design; we will clarify that direct validation against specific real outbreaks is outside the paper's scope. The indistinguishability proof is structural and holds independently of specific parameter values. revision: partial
-
Referee: [Theoretical Analysis] Theoretical section: while a proof that certain scenarios are indistinguishable without boundary or edge information is asserted, the manuscript does not state the precise theorem, the assumptions on the cascade process, or the conditions under which the result holds, preventing assessment of its scope relative to the empirical networks.
Authors: We will revise the theoretical section to state the precise theorem, list the assumptions (SIR process on known undirected network, observed infection times, no reinfection), and specify the conditions (identical infection trees but differing boundary structure). This will clarify its general scope and direct applicability to the Tennessee and Virginia networks used empirically. revision: yes
Circularity Check
Minor self-citation on edge features; main empirical result on boundary degree is independent
full rationale
The paper defines boundary degree directly from the contact network and cascade, then reports an ablation study on Tennessee/Virginia networks showing a 19% accuracy gain. No equations, fitted parameters, or predictions reduce by construction to inputs. The claim of theoretical grounding for edge-feature importance references prior work (likely self-citation), but this is not load-bearing for the central boundary-degree result. The indistinguishability proof is presented within the paper itself. This matches the default expectation of no significant circularity.
Axiom & Free-Parameter Ledger
axioms (1)
- domain assumption The Tennessee and Virginia contact networks are realistic and representative for testing epidemic scenario distinguishability.
Reference graph
Works this paper leans on
-
[1]
Synthetic population for USA_VIRGINIA
“Synthetic population for USA_VIRGINIA”. Technical report, Biocomplexity Institute, University of Virginia. https://zenodo.org/records/6505964. Aljundi, A. A., G. Harrison, J. Chen, M. V . Marathe, H. Mortveit, A. Vullikantiet al
-
[2]
Deep learning for supervised classification of spatial epidemics
“Deep learning for supervised classification of spatial epidemics”.Spatial Spatio-temporal Epidemiol.https://doi.org/10.1016/j.sste.2018.08.002. Bedson, J., L. A. Skrip, D. Pedi, S. Abramowitz, S. Carter, M. F. Jalloh,et al
-
[3]
How Attentive are Graph Attention Networks?
“How attentive are graph attention networks?”.arXiv preprint arXiv:2105.14491. Chen, J., S. Hoops, H. S. Mortveit, B. L. Lewis, D. Machi, P. Bhattacharya,et al
work page internal anchor Pith review Pith/arXiv arXiv
-
[4]
Epihiper—A high performance computational modeling framework to support epidemic science
“Epihiper—A high performance computational modeling framework to support epidemic science”.PNAS nexushttps://doi.org/10.1093/pnasnexus/pgae557. Alabsi Aljundi, Harrison, Chen, Adiga, Vullikanti, and Marathe Cheng, Justin and Adamic, Lada A. and Dow, P. Alex and Kleinberg, Jon and Leskovec, Jure
-
[5]
“Can Cascades be Predicted?” https://doi.org/10.1145/2566486.2567997. Chopra, A., A. Rodríguez, J. Subramanian, A. Quera-Bofarull, B. Krishnamurthy, B. A. Prakashet al
-
[6]
Differentiable Agent- based Epidemiology
“Differentiable Agent- based Epidemiology”. InProc. 2023 Int. Conf. Autonomous Agents Multiagent Syst.https://doi.org/10.5555/3545946.3598851. Dehmamy, N., A.-L. Barabási, and R. Yu
-
[7]
Neural Message Passing for Quantum Chemistry
“Neural Message Passing for Quantum Chemistry”. arXiv:1704.01212. Gleeson, James P
work page internal anchor Pith review Pith/arXiv arXiv
-
[8]
Inductive representation learning on large graphs
“Inductive representation learning on large graphs”.Advances in neural information processing systems30. Hamilton, W. L. 2020.Graph representation learning. Morgan & Claypool. Harrison, G., A. Alabsi Aljundi, J. Chen, S. Ravi, A. K. Vullikanti, M. V . Maratheet al
2020
-
[9]
Identifying Complicated Contagion Scenarios from Cascade Data
“Identifying Complicated Contagion Scenarios from Cascade Data”. InProc. 29th ACM Conf. Knowl. Discovery Data Mininghttps://doi.org/10. 1145/3580305.3599841. Holland, P. W., K. B. Laskey, and S. Leinhardt
-
[10]
Cascade2vec: Learning Dynamic Cascade Representation by Recurrent Graph Neural Networks
“Cascade2vec: Learning Dynamic Cascade Representation by Recurrent Graph Neural Networks”.IEEE Accesshttps://doi.org/10.1109/ACCESS.2019.2942853. Ioffe, S., and C. Szegedy
-
[11]
Theory of Graph Neural Networks: Representation and Learning
“Theory of Graph Neural Networks: Representation and Learning”.arXiv:2204.07697https://doi.org/10. 48550/arXiv.2204.07697. Kempe, D., J. Kleinberg, and É. Tardos
-
[12]
Maximizing the spread of influence through a social network
“Maximizing the spread of influence through a social network”. InProc. 9th ACM Conf. Knowl. Discovery Data Mininghttps://doi.org/10.1145/956750.956769. Kermack, W. O., and A. G. McKendrick
-
[13]
A contribution to the mathematical theory of epidemics
“A contribution to the mathematical theory of epidemics”.Proc. Roy. Soc. London Ser . Ahttps://doi.org/10.1098/rspa.1927.0118. Leskovec, Jure
-
[14]
Effective degree network disease models
“Effective degree network disease models” https://doi.org/10.1007/s00285-010-0331-2. Marathe, M., and A. K. S. Vullikanti
-
[15]
“EoN (Epidemics on Networks): a fast, flexible Python package for simulation, analytic approximation, and analysis of epidemics on networks”.J. Open Source Softw.https://doi.org/10.21105/joss.01731. Moon, S. A., J. Chen, B. Espinoza, B. Lewis, M. Marathe, J. Outten,et al
-
[16]
A Dirichlet process model for classifying and forecasting epidemic curves
“A Dirichlet process model for classifying and forecasting epidemic curves”.BMC Infectious Diseaseshttps://doi.org/10.1186/1471-2334-14-12. Paul, S. G., A. Saha, M. Z. Hasan, S. R. H. Noori, and A. Moustafa
-
[17]
Supervised learning and prediction of spatial epidemics
“Supervised learning and prediction of spatial epidemics”.Spatial Spatio-temporal Epidemiol.https://doi.org/10.1016/j.sste.2014.08.003. Prakash, B. Aditya and Vreeken, Jilles and Faloutsos, Christos
-
[18]
Spotting Culprits in Epidemics: How Many and Which Ones?
“Spotting Culprits in Epidemics: How Many and Which Ones?” https://doi.org/10.1109/ICDM.2012.136. Alabsi Aljundi, Harrison, Chen, Adiga, Vullikanti, and Marathe Reiker, T., M. Golumbeanu, A. Shattock, L. Burgert, T. A. Smith, S. Filippi,et al
-
[19]
The perceptron: A probabilistic model for information storage and organization in the brain
“The perceptron: A probabilistic model for information storage and organization in the brain”.Psychol. Rev.https://doi.org/10.1037/h0042519. Verelst, F., L. Willem, and P. Beutels
-
[20]
Behavioural change models for infectious disease transmission: a systematic review (2010–2015)
“Behavioural change models for infectious disease transmission: a systematic review (2010–2015)”.J. Roy. Soc. Interface. Wang, L., J. Chen, and M. Marathe
2010
-
[21]
CCGL: Contrastive Cascade Graph Learning
“CCGL: Contrastive Cascade Graph Learning”.IEEE Trans. Knowl. Data Eng.https://doi.org/10.1109/TKDE.2022.3151829. Ye, Y ., A. Pandey, C. Bawden, D. M. Sumsuzzman, R. Rajput, A. Shoukat,et al
discussion (0)
Sign in with ORCID, Apple, or X to comment. Anyone can read and Pith papers without signing in.