REVIEW 3 major objections 7 minor 40 references
Beyond the Post Hoc User Study: Modeling Visual Decision-Making with Active Inference
T0 review · 3 major / 7 minor · reviewed 2026-07-31 · grok-4.5
Pith's one-line read Active Inference turns dual-process chart reading into executable agents whose distinct failure modes can be simulated before user studies.
desk verdict Solid proof-of-concept that turns Padilla-style dual-process chart reading into runnable Active Inference agents with inspectable failure signatures—useful scaffold, not yet human-validated mechanism discovery. read the letter →
The pith
A machine-rendered reading of the paper's core claim, the machinery that carries it, and where it could break.
The reading
What carries the argument
Discrete-time Active Inference agents cast as POMDPs: hidden states hold task register and working-memory contents (one average memory vs two bar memories), observations are staged cues (relative position, axis tick, segment, feedback), and actions are chosen from a short policy library by minimizing expected free energy that trades epistemic information gain against effort and preference for correct reports.
What would settle it
Run the same two-bar average task with humans and check whether error maps, step/fixation counts, and sensitivity to memory load versus tick salience match the Fast versus Slow predictions; systematic mismatch falsifies the chosen strategy decomposition or its parameters.
Extended reading notes
Core claim
Active Inference can instantiate dual-process strategies for a two-bar average-estimation task as matched Fast (compressed average-first) and Slow (bar-wise sequential) agents, such that hypothesized human vulnerabilities—tick-salience bias for the Fast agent and working-memory decay for the Slow agent—appear as distinct quantitative signatures in accuracy, failure maps, step counts, and belief/fixation traces, providing a formal scaffold for mechanistic hypothesis testing about visualization interpretation.
Load-bearing premise
The hand-built Fast and Slow architectures, staged look-then-report routines, and restricted policy library are adequate stand-ins for how people actually read these charts; if humans use different strategies or cues, the simulated failure signatures will not transfer.
Editorial extensions
If this is right
- Designers could stress-test encodings in simulation for tick-anchoring or memory-load failure before committing to full user studies.
- Empirical work shifts from only grading finished charts to also fitting, refining, or rejecting explicit process models.
- Failure maps, belief trajectories, and fixation sequences become shared quantitative targets across model and human data.
- A later hierarchical arbiter could switch between Fast and Slow policies when uncertainty exceeds a threshold, predicting when a design forces analytic effort.
- Scanpath and virtual-viewer models can propose observation and action vocabularies for new tasks that Active Inference then mechanizes.
Reading between the lines
- If the parameter-fitting pipeline works, visualization toolkits could ship with default agent profiles (high tick bias, low memory retention) as automated design linters.
- The same Fast/Slow split may expose when common encodings (stacked bars, dual axes) systematically push viewers into the more fragile strategy.
- Mismatch between model and eye-tracking would most cleanly revise the observation modalities or policy library rather than abandon the free-energy objective.
- Pairing an inspectable agent engine with a natural-language front end could let non-modelers queue in silico studies without writing POMDP matrices.
Signed reviews
Editorial analysis
A structured set of objections, weighed in public.
Referee Report
Summary. The paper proposes Active Inference as a framework for converting qualitative cognitive theories of visualization interpretation into executable process models, and demonstrates the translation on Padilla et al.'s dual-process account using a two-bar average-estimation task. Two discrete-state POMDP agents are constructed: a Fast (Type 1) agent maintaining a single compressed average memory with a gist–anchor–refine routine, and a Slow (Type 2) agent maintaining two bar-specific memories with sequential bar-wise estimation. Tick-salience bias is placed in the environment but not the agents' likelihood models, and memory decay is implemented as retention/forgetting/diffusion over memory states. Simulations show baseline accuracies of ~0.92 (Fast) vs ~0.98 (Slow), a diagonal-banded pairwise failure map, stronger Slow sensitivity to memory-decay sweeps, and stronger Fast sensitivity to segment tick-bias sweeps, plus inspectable belief and action traces. The authors frame the work strictly as a proof of concept and a call to parameterize, falsify, or refine such agents against human data.
Significance. If the framing holds up, this is a useful methodological contribution to the growing 'virtual viewer' literature: a fully specified, executable, and inspectable instantiation of a dual-process account of chart reading, with mechanism-specific failure signatures (accuracy curves, failure maps, step counts, belief traces) that are in principle falsifiable against human data. Strengths that deserve explicit credit: the appendices give a complete formal specification (cue likelihoods Eqs. 56–61, memory dynamics Eq. 13, full policy libraries Eqs. 91–110) at a level of detail rare in this venue; code is publicly released; the stimulus sweep is exhaustive (9610 runs per model at baseline); and the authors are unusually candid that the Fast/Slow decomposition is a modeling choice, that several results are expected consequences of the architecture rather than discoveries, and that the models are 'tentative mechanisms' pending empirical grounding. The paper does not overclaim predictive validity for human behavior. Its significance is as a scaffold and a call to action, and on those terms it is valuable.
major comments (3)
- [§1.2, Table 1, Figs. 5–8] §1.2 promises a 'matched parameterization' with parameters differing 'only in the architectural and temporal features required by their respective cognitive modes,' enabling a 'controlled computational experiment.' Table 1 does not deliver this control in the dimensions the results depend on. The Slow agent receives a deterministic coarse cue (bar_obs_sigma = 0.0, the σ→0 snap of Eq. 56) while the Fast agent's gist cue carries σ = 0.22, and the Slow agent receives a longer horizon (T=10 vs T=7). These two gifted parameters, not the representational architecture, may drive (a) the baseline gap (0.98 vs 0.92, Fig. 5) — a noise-free bar-top anchor alone yields near-ceiling accuracy regardless of whether memory is bar-wise or compressed — and (b) the diagonal banded failure structure of Fig. 8. Because §§5–6 propose fitting precisely these accuracy curves and failure maps to human data as 'q
- [§4.2–4.3, Figs. 6–7, Eq. (35), Table 1] The perturbation curves are presented as quantitative signatures usable to parameterize or falsify the strategies against human data (§5, §6), but their quantitative content depends on unconstrained preference/effort parameters that are not themselves candidates for the mechanisms under test. The crossing of Fast and Slow accuracy at segment_tick_anchor_bias ≈ 0.5 (Fig. 7) and the accuracy optimum at decay rate ≈ 0.2 (Fig. 6) depend on C_fb = (0, −80, 12) (Eq. 35), c_nr = 0.35, γ = 8.0, mem_sigma = 5.0, and the segment_sigma = 0.045 refinement width. A sensitivity analysis varying these nuisance parameters over a plausible range — showing that the ordinal, mechanism-level signatures (Slow decays faster under ρ_mem sweeps; Fast decays faster under λ_tick sweeps) are robust while only crossing points move — is needed before these curves can serve as identifiable fitting targets. Without it
- [Appendix D.3, Eqs. (101)/(110), Figs. 13–14] The degenerate all-report policy templates ([REPORT r ×4], Eqs. 101 and 110) are included in both policy libraries alongside report-ending templates, with report_action_instant = True and strong feedback preferences. The manuscript does not report how often degenerate or truncated policies are actually selected. Since step counts (Figs. 13–14) and the belief-trace interpretation (§A.2, Fig. 10) are offered as behavioral signatures, the authors should report the empirical distribution over selected template families per condition, and confirm that the deliberation-time effects in Figs. 13–14 are not artifacts of template-library composition (e.g., the Fast library containing shorter paths to report). This is a reporting gap rather than a suspected error, but it is load-bearing for the step-count and trace claims.
minor comments (7)
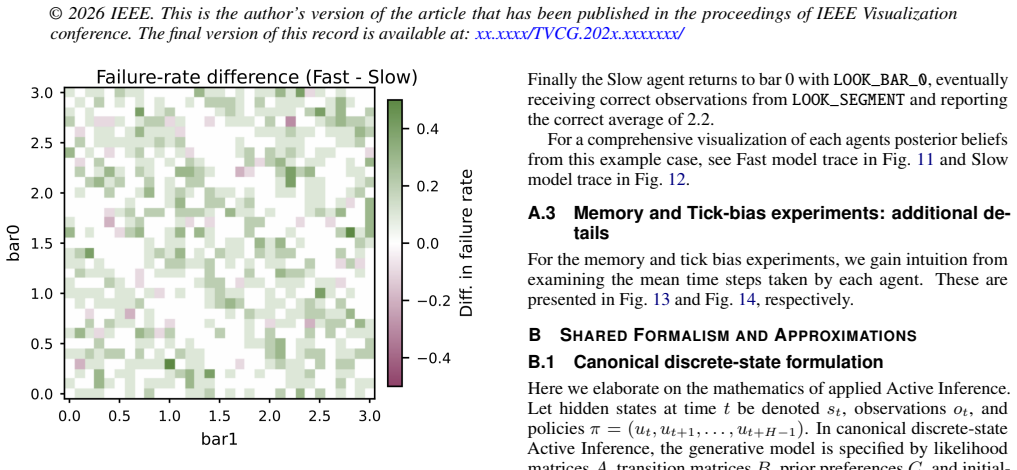
- [Fig. 8 caption vs. §A.1] The Fig. 8 caption states 'Green regions indicate Fast model failure,' while the Appendix A.1 text states 'Red areas indicate bar pairs for which the Fast agent failed... more often than the Slow model.' Please reconcile.
- [Table 1 vs. §4.2] Table 1 lists the default mem_sigma = 0.25, while §4.2 states the decay experiment used mem_sigma = 5.0. Please clarify which values are 'defaults' and flag the override in the table or caption.
- [§2.2, Eq. (6)] Eq. (6) defines B_ij without an action index while the surrounding text describes B(u) as 'the transition matrix induced by action u'; the known-action operator form (Eqs. 25–29) later reintroduces action conditioning. A sentence reconciling the two notations would help readers.
- [Various] Typos/grammar: §1.2 'capture capture'; §3.2 'the hight of each bar'; 'course' used throughout for 'coarse' (course_tick_anchor_bias, 'course initial cue'); Fig. 6 and Fig. 7 captions 'random seems'; §A.2 'Padillaet al.' and 'starts by with the LOOK_PAIR action'; §5 'interpretable timeseries'; §6 'whenwhy the viewer responds'; §2.1 'an architecture that express both' (missing 'es'); Fig. 10 caption 'actions show as the series' and 'the believe average'.
- [Fig. 8] Fig. 8 visualizes only the accuracy difference between models. Since Slow accuracy is near ceiling, absolute per-pair accuracies (available in Fig. 9) would make the diagonal-band claim easier to assess independently of the difference scaling.
- [Abstract, Fig. 1] Abstract and Fig. 1 caption contain spacing artifacts from PDF extraction/typesetting ('Type 1,Fast', 'forin silico', 'in silicoevaluation'); please check the final proofs.
- [Supplemental Materials] The supplemental link is given as '<removed for review>' immediately followed by the live GitHub URL; given the non-anonymous author list this is presumably intentional, but the placeholder should be cleaned up.
Circularity Check
Differential Fast/Slow failure signatures are expected consequences of the encoded architectures (single compressed average vs two bar memories), not independent discoveries; the paper largely admits this.
-
self definitional
[§3.2 Generative process, memory decay, and perceptual bias]
"In the Slow model, tick-salience bias affects one bar-specific estimate at a time. In the Fast model, it affects the compressed average estimate directly. We therefore expect the Fast model to be more susceptible to early anchoring errors, whereas the Slow model should be more susceptible to failures caused by memory load and multi-step integration."
The headline Type-1 vs Type-2 failure contrast is declared as an expectation from how bias and memory are wired into each agent before any simulation. Fast’s single m(avg) receives the biased segment/pair cue directly; Slow’s two bar memories are biased separately and averaged, so cancellation is built in. The later Fig. 7 result that Fast accuracy falls faster under segment_tick_anchor_bias is this definition restated numerically, not an independent prediction.
-
self definitional
[§4.1 Baseline model validation; §5 Discussion]
"The following experiments are hypothesis-driven stress tests of two idealized task strategies, not independent evidence that these agents discover distinct cognitive failures in humans. Because the Fast and Slow agents are constructed around different representational commitments, the purpose of these results is to quantify the inspectable failure modes implied by those commitments. ... These selective vulnerabilities are not surprising post hoc discoveries; they are the expected consequences of the strategy definitions expressed as quantitative predictions."
The paper’s own framing equates the Results with quantifying failure modes already implied by the Fast (compressed average-first) vs Slow (bar-wise sequential) state factorizations. Accuracy curves, failure maps, and selective sensitivity to mem_retention vs segment_tick_anchor_bias are therefore outputs of the input architectural commitments plus where perturbations were applied, not first-principles findings that could have come out otherwise under the same encoding.
1 more flagged steps
-
self definitional
[§3.3–3.4 Slow/Fast hidden states; Eq. 13 memory law; §4.2 Type 2 Failure]
"The Slow model operationalizes Type 2-style processing by maintaining two explicit intermediate estimates, one for each bar. ... The Fast model operationalizes Type 1-style processing by maintaining a single compressed estimate of the average directly... This perturbation is expected to disproportionately affect the Slow strategy because it stores separate intermediate estimates for each bar before combining them into an average."
Slow’s greater sensitivity to memory decay is definitional once the hidden state is xslow=(r,m0,m1) with decay on both memories each step (Eq. 13; transitions 69–70) versus xfast=(r,m_avg) with one memory. The Fig. 6 sharp Slow accuracy drop under rising (1−mem_retention) restates that Slow must retain two intermediates across a longer staged routine; it does not independently establish a Type-2 memory vulnerability beyond the state-space choice.
full rationale
This is a methodology/proof-of-concept paper, not a hidden fit-to-data exercise. No parameters are fitted to human outcomes and then relabeled predictions, and the Active Inference formalism is externally cited (Friston et al.). The load-bearing circularity is milder and architectural: the central quantitative results—that the Fast agent is more vulnerable to tick-salience bias and the Slow agent more vulnerable to working-memory decay—are stated in Methods as design expectations, then recovered in Results as stress-test outcomes, and finally labeled in Discussion as “expected consequences of the strategy definitions.” Differential vulnerability follows by construction from (i) applying environment-side tick pull to a single gist memory versus two bar memories that can partially cancel on averaging, and (ii) decaying two intermediate memories per step versus one. The paper is unusually explicit that the experiments “quantify the inspectable failure modes implied by those commitments” and are “not independent evidence” of human failures, which caps the score: the methodological claim (executable, falsifiable process models) retains independent content, but the showcased mechanism-specific accuracy curves and perturbation signatures do not go beyond what the architectures and perturbation placements already encode. Unmatched sensory noise and time budgets (Table 1) are a confound for attribution, not an additional circularity pattern under this rubric.
Assumptions & free parameters
free parameters (5)
- mem_retention (ρ_mem), mem_forget (ρ_forget), mem_sigma =
baseline ρ_mem=0.97, ρ_forget=0.005, σ_mem=0.25; decay sweep uses mem_sigma=5.0
- course_tick_anchor_bias / segment_tick_anchor_bias (λ_tick) =
baseline 0.0; swept in Type-1 experiment
- pair_obs_sigma / bar_obs_sigma / segment_sigma =
pair 0.22, bar 0.0, segment 0.045
- policy precision γ, non-report cost c_nr, policy_len, trial horizons T =
γ=8.0, c_nr=0.35, policy_len=4
- feedback preferences C_fb = (0, λ−, λ+) =
(0, -80, 12)
assumptions (6)
- domain assumption Bayesian Brain and Free Energy Principle: perception and action minimize variational/expected free energy under a generative model (A,B,C,D).
- domain assumption Padilla et al. dual-process framing can be idealized as two separable strategies (compressed heuristic vs sequential analytic) for this task.
- ad hoc to paper Chart reading is adequately modeled as a discrete known-action POMDP over symbolic cues (rel/axis/segment/feedback) without pixel-level vision.
- ad hoc to paper Restricted hand-designed 4-step policy library approximates human chart-reading routines and suffices for planning.
- ad hoc to paper Tick-salience bias lives in the generative process but not the agent’s likelihood model (unaware bias).
- standard math Standard discrete categorical softmax belief updates and report-targeted epistemic value are valid planning objectives for one-decimal reports.
invented entities (3)
-
Fast agent (x = (r, m_avg) on report grid with LOOK_PAIR routine)
-
Slow agent (x = (r, m0, m1) with bar-wise LOOK_BAR routines)
-
Staged symbolic cue triple (ρ, α, η) plus task register states
Cite this review
Pith. "Pith review of Beyond the Post Hoc User Study: Modeling Visual Decision-Making with Active Inference." pith.science (2026). https://pith.science/paper/UHF7ZZQ4
@misc{pith2026260725131,
  author       = {Pith},
  title        = {Pith review of: Beyond the Post Hoc User Study: Modeling Visual Decision-Making with Active Inference},
  year         = {2026},
  howpublished = {\url{https://pith.science/paper/UHF7ZZQ4}},
  note         = {Machine review of arXiv:2607.25131}
}
read the original abstract
Empirical user studies are essential for evaluating visual encodings and can reveal perceptual and cognitive mechanisms, but they do not by themselves provide causal, predictive accounts of interpretation errors. Evaluations are therefore often post hoc: they measure performance after a design has been specified rather than predicting how attention, uncertainty, memory, and bias may produce accurate or erroneous judgments. To address this mechanistic gap, we translate a cognitive theory of visualization interpretation into executable simulation using Active Inference, a probabilistic framework for perception, learning, and action. We model chart reading as dynamic visual search in which agents update beliefs and choose actions that balance uncertainty reduction against cognitive effort. As a proof of concept, we implement Fast, heuristic (Type 1) and Slow, analytic (Type 2) agents for a bar-chart average-estimation task. The Fast agent is vulnerable to tick-salience bias, whereas the Slow agent is more vulnerable to working-memory decay. Both produce inspectable cognitive traces, including evolving belief uncertainty and fixation sequences. By expressing these hypothesized failure mechanisms as interpretable parameters, the architecture provides a framework for formalizing and testing mechanistic hypotheses about visualization interpretation. Empirical studies can then parameterize, refine, or falsify these simulations, supporting earlier and more predictive in silico evaluation of visualization efficacy.
Figures


Figures from the paper (9 more)




Reference graph
Works this paper leans on
-
[1]
J. R. Anderson, D. Bothell, M. D. Byrne, S. Douglass, C. Lebiere, and Y . Qin. An integrated theory of the mind.Psychological Review, 111(4):1036–1060, 2004. doi:10.1037/0033-295X.111.4.10363
-
[2]
C. D. Brumar, S. Molnar, G. Appleby, K. Potter, and R. Chang. A typology of decision-making tasks for visualization.IEEE Transactions on Visualization and Computer Graphics, 31(10):8536–8551, 2025. doi:10.1109/TVCG.2025.35728422, 3, 9
arXiv 2025
-
[3]
Z. Bylinskii, T. Judd, A. Oliva, A. Torralba, and F. Durand. What do different evaluation metrics tell us about saliency models?IEEE Transactions on Pattern Analysis and Machine Intelligence, 41(3):740– 757, 2019. doi:10.1109/TPAMI.2018.28156013
arXiv 2019
-
[4]
W. S. Cleveland and R. McGill. Graphical perception: Theory, experi- mentation, and application to the development of graphical methods. Journal of the American Statistical Association, 79(387):531–554,
-
[5]
J. S. B. T. Evans and K. E. Stanovich. Dual-process theories of higher cognition: Advancing the debate.Perspectives on Psychological Sci- ence, 8(3):223–241, 2013. doi:10.1177/17456916124606852, 3
-
[6]
S. L. Franconeri, L. M. Padilla, P. Shah, J. M. Zacks, and J. Hullman. The science of visual data communication: What works.Psychological Science in the Public Interest, 22(3):110–161, 2021. doi: 10.1177/ 152910062110519562 10 © 2026 IEEE. This is the author’s version of the article that has been published in the proceedings of IEEE Visualization conferen...
2021
-
[7]
Friston, J
K. Friston, J. Kilner, and L. Harrison. A free energy principle for the brain.Journal of Physiology-Paris, 100(1–3):70–87, 2006. doi: 10. 1016/j.jphysparis.2006.10.0012, 4
2006
-
[8]
K. J. Friston, T. FitzGerald, F. Rigoli, P. Schwartenbeck, and G. Pezzulo. Active Inference: A process theory.Neural Computation, 29(1):1–49,
Show all 40 references
-
[9]
K. J. Friston, R. Rosch, T. Parr, C. Price, and H. Bowman. Deep temporal models and active inference.Neuroscience & Biobehavioral Reviews, 90:486–501, 2018. doi:10.1016/j.neubiorev.2018.04.0045
2018 doi
-
[10]
M. Hegarty. The cognitive science of visual-spatial displays: Implica- tions for design.Topics in Cognitive Science, 3(3):446–474, 2011. doi: 10.1111/j.1756-8765.2011.01150.x2
2011
-
[11]
L. Itti, C. Koch, and E. Niebur. A model of saliency-based visual atten- tion for rapid scene analysis.IEEE Transactions on Pattern Analysis and Machine Intelligence, 20(11):1254–1259, 1998. doi: 10.1109/34. 7305583
1998 doi
-
[12]
Kahneman.Thinking, Fast and Slow
D. Kahneman.Thinking, Fast and Slow. Farrar, Straus and Giroux, New York, 2011. 3
2011
-
[13]
Kahneman and S
D. Kahneman and S. Frederick. Representativeness revisited: Attribute substitution in intuitive judgment. In T. Gilovich, D. Griffin, and D. Kahneman, eds.,Heuristics and Biases: The Psychology of Intuitive Judgment, pp. 49–81. Cambridge University Press, Cambridge, 2002. doi:...
2002
-
[14]
Keren and Y
G. Keren and Y . Schul. Two is not always better than one: A critical evaluation of two-system theories.Perspectives on Psychological Science, 4(6):533–550, 2009. doi:10.1111/j.1745-6924.2009.01164.x2
2009
-
[15]
Y .-S. Kim, L. A. Walls, P. Krafft, and J. Hullman. A Bayesian cognition approach to improve data visualization. InProc. CHI, pp. 682:1–682:14. ACM, New York, 2019. doi:10.1145/3290605.33009123
2019
-
[16]
S. F. Mann, R. Pain, and M. D. Kirchhoff. Free energy: A user’s guide. Biology & Philosophy, 37(4):33, 2022. doi: 10.1007/s10539-022-09864-z 4
2022 doi
-
[17]
D. E. Melnikoff and J. A. Bargh. The mythical number two.Trends in Cognitive Sciences, 22(4):280–293, 2018. doi: 10.1016/j.tics.2018.02. 0012
2018 doi
-
[18]
Murray-Smith, J
R. Murray-Smith, J. H. Williamson, and S. Stein. Active Inference and human–computer interaction.ACM Transactions on Computer-Human Interaction, 32(6):63:1–63:45, 2025. doi:10.1145/37628125
2025 doi
-
[19]
L. M. Padilla, S. H. Creem-Regehr, M. Hegarty, and J. K. Stefanucci. Decision making with visualizations: A cognitive framework across dis- ciplines.Cognitive Research: Principles and Implications, 3(1):29:1– 29:25, 2018. doi:10.1186/s41235-018-0120-92, 3, 5, 9, 10
2018 doi
-
[20]
E. R. Palacios, A. Razi, T. Parr, M. Kirchhoff, and K. Friston. On Markov blankets and hierarchical self-organisation.Journal of Theo- retical Biology, 486:110089, 2020. doi:10.1016/j.jtbi.2019.1100895
2020
-
[21]
Parr and K
T. Parr and K. J. Friston. Working memory, attention, and salience in active inference.Scientific Reports, 7(1):14678, 2017. doi: 10.1038/ s41598-017-15249-05
2017
-
[22]
Parr and K
T. Parr and K. J. Friston. The anatomy of inference: Generative models and brain structure.Frontiers in Computational Neuroscience, 12:90,
-
[23]
T. Parr, G. Pezzulo, and K. J. Friston.Active Inference: The Free Energy Principle in Mind, Brain, and Behavior. MIT Press, Cambridge, MA,
-
[24]
S. Pinker. A theory of graph comprehension. In R. Freedle, ed., Artificial Intelligence and the Future of Testing, pp. 73–126. Psychology Press, New York, 2014. doi:10.4324/9781315808178-42, 3
2014 doi
-
[25]
Pirolli and S
P. Pirolli and S. Card. Information foraging.Psychological Review, 106(4):643–675, 1999. doi:10.1037/0033-295X.106.4.6433
1999 doi
-
[26]
P. Shah, E. G. Freedman, and I. Vekiri. The comprehension of quan- titative information in graphical displays. In P. Shah and A. Miyake, eds.,The Cambridge Handbook of Visuospatial Thinking, pp. 426–
-
[27]
D. Shi, Y . Wang, Y . Bai, A. Bulling, and A. Oulasvirta. Chartist: Task-driven eye movement control for chart reading. InProc. CHI, pp. 1167:1–1167:14. ACM, New York, 2025. doi: 10.1145/3706598. 37131283
2025 doi
-
[28]
S. Shin, S. Chung, S. Hong, and N. Elmqvist. A scanner deeply: Predicting gaze heatmaps on visualizations using crowdsourced eye movement data.IEEE Transactions on Visualization and Computer Graphics, 29(1):396–406, 2023. doi:10.1109/TVCG.2022.32094723
2023
-
[29]
S. Shin, S. Hong, and N. Elmqvist. Perceptual Pat: A virtual human visual system for iterative visualization design. InProc. CHI, pp. 811:1–811:17. ACM, New York, 2023. doi: 10.1145/3544548.3580974 3
2023
-
[30]
Smith, K
R. Smith, K. J. Friston, and C. J. Whyte. A step-by-step tutorial on active inference and its application to empirical data.Journal of Mathematical Psychology, 107:102632, 2022. doi: 10.1016/j.jmp.2021. 1026324
2022 doi
-
[31]
K. E. Stanovich.Who Is Rational? Studies of Individual Differ- ences in Reasoning. Psychology Press, New York, 1999. doi: 10. 4324/97814106034322
1999
-
[32]
D. A. Szafir, R. Borgo, M. Chen, D. J. Edwards, B. Fisher, and L. Padilla.Visualization Psychology. Springer, Cham, 2023. doi: 10.1007/978-3-031-34738-22
2023 doi
-
[33]
Y . Wang, M. Bâce, and A. Bulling. Scanpath prediction on information visualisations.IEEE Transactions on Visualization and Computer Graphics, 30(7):3902–3914, 2024. doi:10.1109/TVCG.2023.32422933
2024
-
[34]
Y . Wang, W. Wang, A. Abdelhafez, M. Elfares, Z. Hu, M. Bâce, and A. Bulling. SalChartQA: Question-driven saliency on information visualisations. InProc. CHI, pp. 763:1–763:14. ACM, New York,
-
[476]
doi: 10.1017/ CBO9780511610448.0122
Cambridge University Press, New York, 2005. doi: 10.1017/ CBO9780511610448.0122
2005
-
[1984]
doi:10.1080/01621459.1984.104780802, 3
1984
-
[2017]
doi:10.1162/NECO_a_009122, 4
-
[2018]
doi:10.3389/fncom.2018.000905
2018
-
[2022]
doi:10.7551/mitpress/12441.001.00014
-
[2024]
Table 1: Default comparison settings used in the main validation scripts
doi:10.1145/3613904.36429423 A ADDITIONALRESULTS A.1 Baseline Validation: Additional Details To make the reported experiments reproducible, Table 1 records the default settings used in the baseline validation experiments. Table 1: Default comparison settings used in the main v...
2026
Reviewed July 31, 2026 · model on record in the stance chip above.
Discussion (0). Continue with ORCID to comment.