Evolution of the disk of pi Aqr: from near-disappearance to a strong maximum
Pith reviewed 2026-05-25 18:57 UTC · model grok-4.3
The pith
The Be disk of pi Aqr nearly vanished in 2014 then recovered to its strongest emission in decades.
A machine-rendered reading of the paper's core claim, the machinery that carries it, and where it could break.
Core claim
A large transition occurred in the Be disk of pi Aqr: the emission nearly disappeared in January 2014, but the disk has recovered with line strengths now reaching levels only seen during the active phase of 1950-1990; in parallel the strong asymmetry responsible for V/R modulation has disappeared.
What carries the argument
The strength and profile asymmetry of emission lines formed in the Be disk, tracked across multiple instruments to reveal transitions in disk presence and structure.
If this is right
- Be disks can lose nearly all detectable emission on timescales of months to years.
- Recovery can restore emission to historical maximum levels within a few years.
- Structural asymmetry in the disk can vanish during the recovery phase.
- Amateur monitoring networks can document full disk loss-and-rebuild cycles.
Where Pith is reading between the lines
- Repeated monitoring of the same star may reveal whether such loss-recovery events recur on decadal timescales.
- The observed loss of asymmetry suggests the disk can return to a more symmetric state once it rebuilds.
- Similar transitions in other Be stars could be caught if comparable amateur data sets exist.
Load-bearing premise
Spectra collected by multiple amateur observers since 2013 are consistent enough in calibration and reduction to allow reliable comparison of emission line strengths and profiles across different instruments and times.
What would settle it
New spectra obtained with a single calibrated professional instrument that show line strengths or V/R behavior inconsistent with the amateur time series from the same epochs.
Figures


read the original abstract
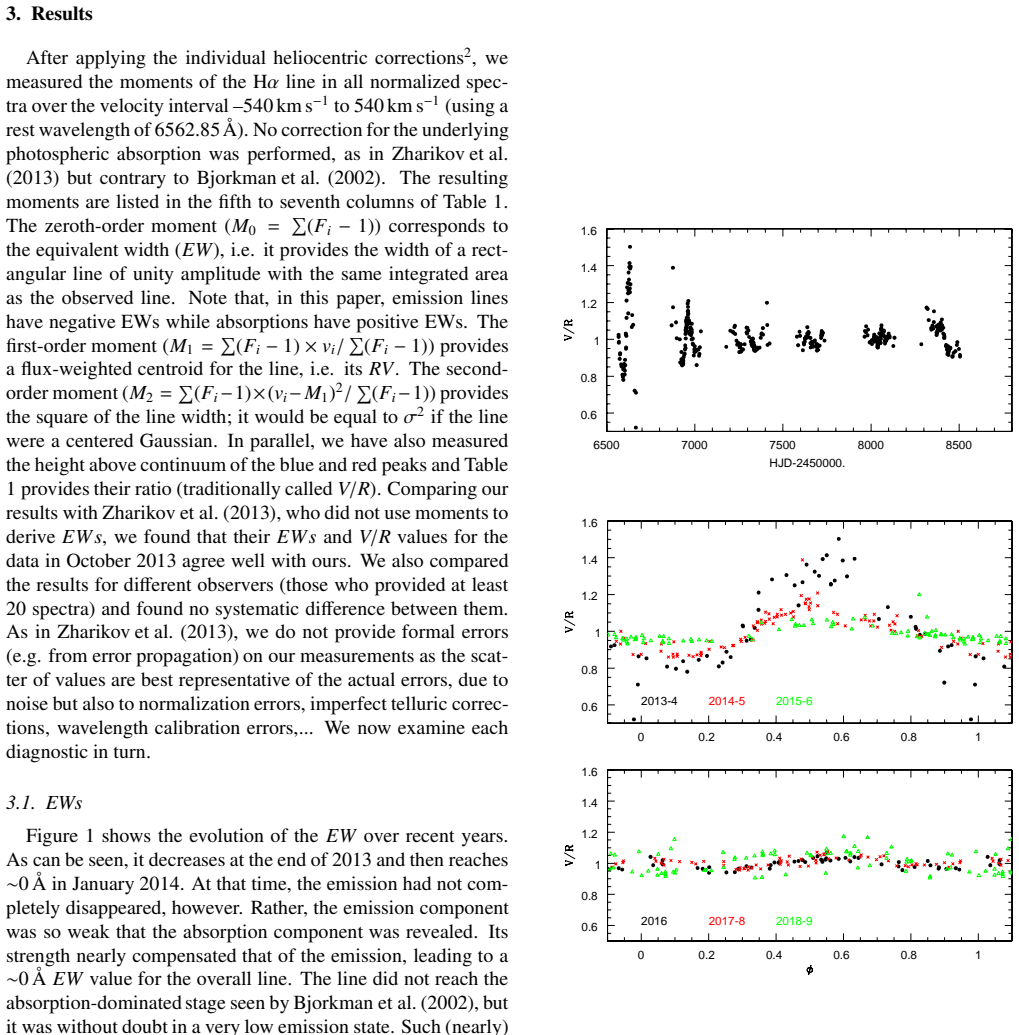
Some Be stars display important variability of the strength of the emission lines formed in their disk. This is notably the case of pi Aqr. We present here the recent evolution of the Be disk in this system thanks to spectra collected by amateur spectroscopists since the end of 2013. A large transition occurred: the emission linked to the Be disk nearly disappeared in January 2014, but the disk has recovered, with a line strength now reaching levels only seen during the active phase of 1950--1990. In parallel to this change in strength occurs a change of disk structure, notably involving the disappearance of the strong asymmetry responsible for the V/R modulation.
Editorial analysis
A structured set of objections, weighed in public.
Referee Report
Summary. The manuscript reports spectroscopic monitoring of the Be star π Aqr by amateur observers since late 2013. It claims that disk-linked emission nearly vanished in January 2014 and has since recovered to line strengths comparable only to the 1950–1990 active phase, accompanied by a structural change that eliminated the strong V/R asymmetry previously responsible for modulation.
Significance. If the quantitative line-strength and profile comparisons are reliable, the work documents a rare, large-amplitude disk transition in a well-studied Be star, extending the known range of disk variability and providing a new anchor point for models of disk dissipation and rebuilding. The long temporal baseline supplied by the amateur network is a clear strength.
major comments (2)
- [§2] §2 (Observations and data reduction): No cross-calibration, overlapping observations, or inter-observer scatter quantification is presented for the spectra obtained with different amateur instruments and reduction pipelines. Because the central claim rests on tracking equivalent widths and V/R ratios across these heterogeneous data sets, the absence of such checks leaves open the possibility that systematic offsets mimic or mask the reported disappearance and recovery.
- [Results] Results section (discussion of January 2014 minimum and subsequent recovery): The quantitative comparison to the 1950–1990 active-phase levels is presented without error bars on the amateur measurements or a table of individual equivalent-width values, making it impossible to assess whether the claimed return to historical maxima is statistically significant.
minor comments (2)
- Figure captions should explicitly state the spectral resolution and typical S/N for each displayed spectrum to allow readers to judge profile reliability.
- The manuscript would benefit from a short table listing the number of spectra per observer/instrument and the date range covered by each.
Simulated Author's Rebuttal
We thank the referee for their constructive review and positive assessment of the work's significance. We address each major comment below, indicating planned revisions to strengthen the manuscript.
read point-by-point responses
-
Referee: [§2] §2 (Observations and data reduction): No cross-calibration, overlapping observations, or inter-observer scatter quantification is presented for the spectra obtained with different amateur instruments and reduction pipelines. Because the central claim rests on tracking equivalent widths and V/R ratios across these heterogeneous data sets, the absence of such checks leaves open the possibility that systematic offsets mimic or mask the reported disappearance and recovery.
Authors: The spectra were drawn from the BeSS database, which compiles amateur observations reduced according to documented standard procedures. While the original manuscript did not quantify inter-observer scatter or present overlapping observations explicitly, the amplitude of the reported changes is large. To address the concern directly, we will revise §2 to add a description of data provenance, include any available overlapping spectra from different observers, and report an estimate of typical scatter. This addition will confirm that systematic offsets do not drive the observed trend. revision: yes
-
Referee: [Results] Results section (discussion of January 2014 minimum and subsequent recovery): The quantitative comparison to the 1950–1990 active-phase levels is presented without error bars on the amateur measurements or a table of individual equivalent-width values, making it impossible to assess whether the claimed return to historical maxima is statistically significant.
Authors: We agree that error bars and tabulated values would improve transparency and allow readers to judge the significance of the recovery. In the revised manuscript we will add error bars (derived from measurement repeatability and S/N where available) to the equivalent-width figures and include a table of individual amateur measurements with references to the 1950–1990 literature values. These changes will make the statistical comparison explicit. revision: yes
Circularity Check
Pure observational report with no derivations or self-referential elements
full rationale
This paper is a pure observational report describing spectral changes in pi Aqr based on amateur-collected data. The abstract and content present no equations, models, fitted parameters, predictions, or derivation chains. Claims rest directly on the presented spectra without any reduction to self-defined inputs or self-citations. The data-consistency assumption noted by the skeptic is a potential methodological weakness but does not constitute circularity under the defined criteria.
Axiom & Free-Parameter Ledger
axioms (1)
- domain assumption Emission lines in Be star spectra form in a circumstellar disk whose strength and asymmetry reflect disk density and structure.
Reference graph
Works this paper leans on
-
[1]
Andrillat, Y., & Fehrenbach, C.\ 1982, A&AS, 48, 93
work page 1982
-
[2]
Bailer-Jones, C. A. L., Rybizki, J., Fouesneau, M., Mantelet, G., & Andrae, R.\ 2018, AJ, 156, 58
work page 2018
-
[3]
Bjorkman, K. S., Miroshnichenko, A. S., McDavid, D., & Pogrosheva, T. M.\ 2002, ApJ, 573, 812
work page 2002
-
[4]
Kenneth Hinkle, Lloyd Wallace, Jeff Valenti, and Dianne Harmer
Hinkle, K., Wallace, L., Valenti, J., & Harmer, D.\ 2000, Visible and Near Infrared Atlas of the Arcturus Spectrum 3727-9300 A ed. Kenneth Hinkle, Lloyd Wallace, Jeff Valenti, and Dianne Harmer. (San Francisco: ASP) ISBN: 1-58381-037-4, 2000.,
work page 2000
-
[5]
(Ed.), SDSU Press (1991), p.23
Horne K., in ``Fundamental Properties of Cataclysmic Variable Stars: 12th North American Workshop on Cataclysmic Variables and Low Mass X-ray Binaries'', Shafter A.W. (Ed.), SDSU Press (1991), p.23
work page 1991
-
[6]
Hummel, W., & Vrancken, M.\ 1995, A&A, 302, 751
work page 1995
- [7]
-
[8]
Naz \'e , Y., Rauw, G., & Cazorla, C.\ 2017, A&A, 602, L5
work page 2017
-
[9]
Neiner, C., de Batz, B., Cochard, F., et al.\ 2011, AJ, 142, 149
work page 2011
-
[10]
M., & Rivinius, T.\ 2003, PASP, 115, 1153
Porter, J. M., & Rivinius, T.\ 2003, PASP, 115, 1153
work page 2003
-
[11]
Rauw, G., Crowther, P. A., Eenens, P. R. J., Manfroid, J., & Vreux, J.-M.\ 2002, A&A, 392, 563
work page 2002
-
[12]
A., De Becker, M., et al.\ 2005, A&A, 432, 985
Rauw, G., Crowther, P. A., De Becker, M., et al.\ 2005, A&A, 432, 985
work page 2005
- [13]
-
[14]
A., Lopes de Oliveira, R., & Motch, C.\ 2016, Advances in Space Research, 58, 782
Smith, M. A., Lopes de Oliveira, R., & Motch, C.\ 2016, Advances in Space Research, 58, 782
work page 2016
-
[15]
A., Wolter, U., Marchev, D., & Petrov, N
Zamanov, R., Stoyanov, K. A., Wolter, U., Marchev, D., & Petrov, N. I.\ 2019, A&A, 622, A173
work page 2019
-
[16]
Zharikov, S. V., Miroshnichenko, A. S., Pollmann, E., et al.\ 2013, A&A, 560, A30
work page 2013
discussion (0)
Sign in with ORCID, Apple, or X to comment. Anyone can read and Pith papers without signing in.