A decade of Gamma-Ray Bursts observed by Fermi-LAT: The 2^(nd) GRB catalog
Pith reviewed 2026-05-25 14:59 UTC · model grok-4.3
The pith
The second Fermi-LAT GRB catalog finds high-energy emission delayed and extended, with some events lasting over 10 ks and no model explaining all observations.
A machine-rendered reading of the paper's core claim, the machinery that carries it, and where it could break.
Core claim
The LAT detected 186 GRBs from 2008 to 2018, with 169 above 100 MeV. The high-energy emission is characterized by delayed onset and longer duration relative to lower energies, with some delays over 1 ks and durations over 10 ks. The detections extend to lower fluences than previously sampled, and the larger set with redshifts enables both observer and rest-frame studies. No current model accounts for all these properties.
What carries the argument
The catalog of 186 LAT-detected GRBs, which tabulates onset times, durations, temporal profiles, and spectra from 100 MeV to 100 GeV for each event.
If this is right
- LAT detection rate has increased compared to the first catalog.
- High-energy delays can exceed 1 ks and durations can exceed 10 ks.
- The sample includes GRBs with lower fluences in addition to the brightest ones.
- More events with redshift measurements permit studies in both observer and rest frames.
- No single theoretical model reproduces the complete set of timing, duration, and spectral results.
Where Pith is reading between the lines
- The long durations imply that particle acceleration or emission processes persist well beyond the initial burst phase.
- Rest-frame analysis could uncover whether the observed delays scale with redshift or are intrinsic.
- Future larger samples might distinguish whether extreme events belong to a distinct subclass of GRBs.
- Multi-messenger data combined with these LAT results could constrain emission mechanisms more tightly.
Load-bearing premise
The measurements of onset delays and durations for the 186 events are not significantly affected by biases in background rejection, localization, or fluence estimation.
What would settle it
An independent analysis of the same LAT dataset that finds most onset delays under 100 seconds or most durations under 1 ks would contradict the reported typical properties.
Figures






read the original abstract
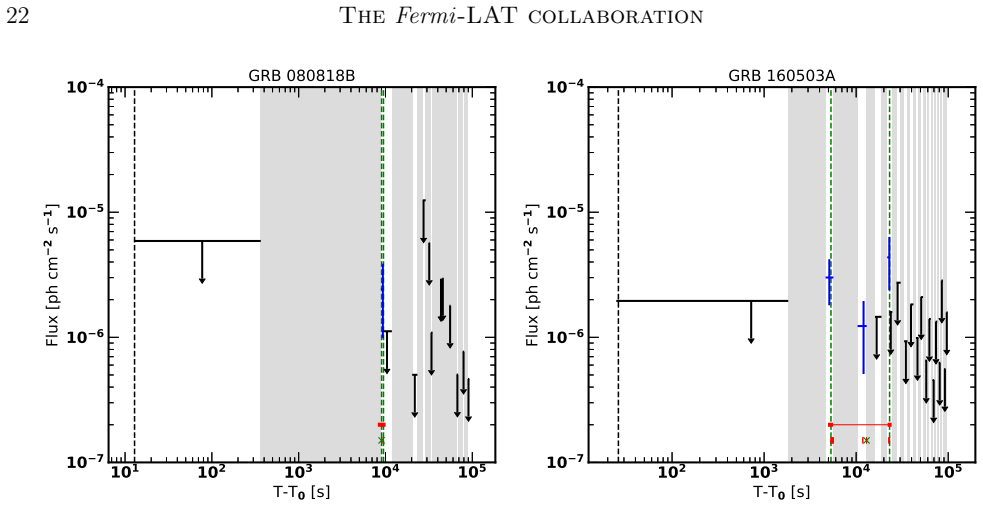
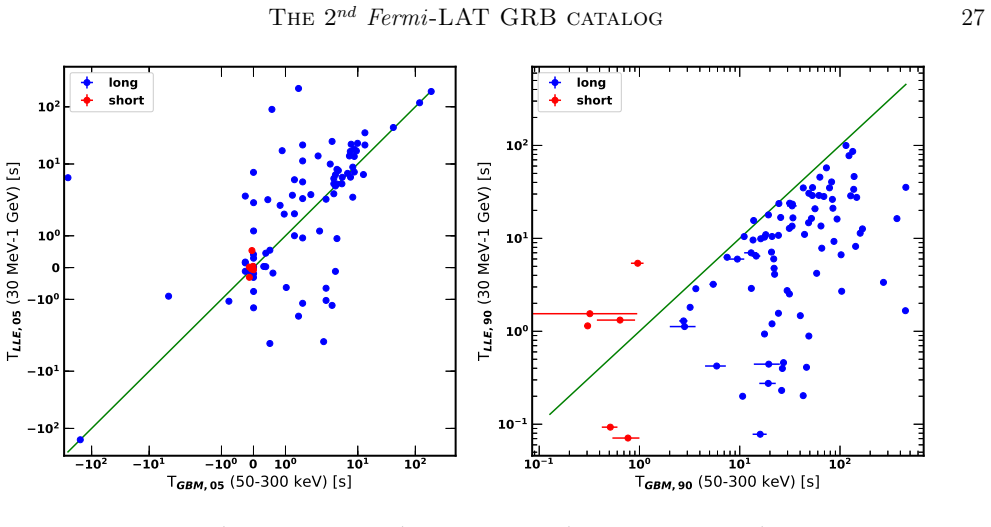
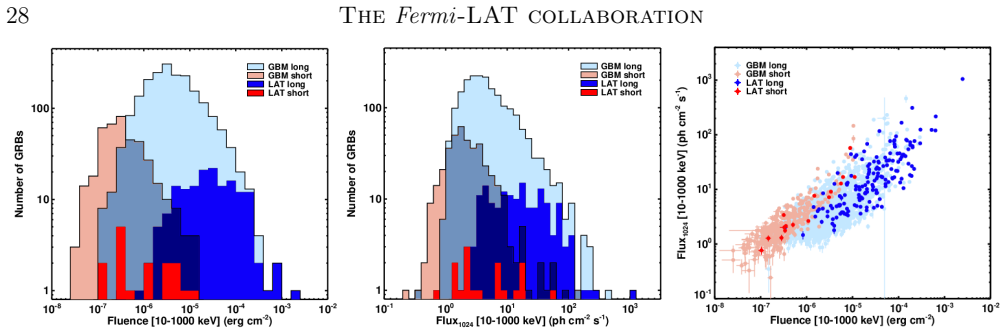
The Large Area Telescope (LAT) aboard the $Fermi$ spacecraft routinely observes high-energy emission from gamma-ray bursts (GRBs). Here we present the second catalog of LAT-detected GRBs, covering the first 10 years of operations, from 2008 August 4 to 2018 August 4. A total of 186 GRBs are found; of these, 91 show emission in the range $30-100\,$MeV (17 of which are seen only in this band) and 169 are detected above 100 MeV. Most of these sources were discovered by other instruments ($Fermi$/GBM, $Swift$/BAT, AGILE, INTEGRAL) or reported by the Interplanetary Network (IPN); the LAT has independently triggered on 4 GRBs. This catalog presents the results for all 186 GRBs. We study onset, duration and temporal properties of each GRB, as well as spectral characteristics in the $100\,$MeV$-100\,$GeV energy range. Particular attention is given to the photons with highest energy. Compared with the first LAT GRB catalog, our rate of detection is significantly improved. The results generally confirm the main findings of the first catalog: the LAT primarily detects the brightest GBM bursts, and the high-energy emission shows delayed onset as well as longer duration. However, in this work we find delays exceeding 1 ks, and several GRBs with durations over 10 ks. Furthermore, the larger number of LAT detections shows that these GRBs cover not only the high-fluence range of GBM-detected GRBs, but also samples lower fluences. In addition, the greater number of detected GRBs with redshift estimates allows us to study their properties in both the observer and rest frames. Comparison of the observational results with theoretical predictions reveals that no model is currently able to explain all results, highlighting the role of LAT observations in driving theoretical models.
Editorial analysis
A structured set of objections, weighed in public.
Referee Report
Summary. The manuscript presents the second Fermi-LAT GRB catalog covering 2008–2018, reporting 186 detected GRBs (169 above 100 MeV), with analyses of onset times, durations, fluences, and spectra in the 100 MeV–100 GeV band. It confirms that LAT detects primarily bright GBM bursts with delayed and extended high-energy emission, but reports new cases with delays >1 ks and durations >10 ks, an expanded fluence range, and the conclusion that no current model accounts for all observations.
Significance. If the reported timing and fluence measurements hold, the doubled sample size relative to the first catalog provides a valuable public resource for statistical studies of high-energy GRB properties in both observer and rest frames, and the explicit statement that no model explains all results usefully constrains theory. The work draws on public Fermi data, supporting reproducibility of the catalog entries.
major comments (2)
- [Data analysis / event selection] Data analysis / event selection section: no quantitative propagation is shown of background-model uncertainties, Earth-albedo leakage, or time-dependent effective-area variations into the onset-delay and duration values, especially for the tail events with delays exceeding 1 ks and durations exceeding 10 ks. These tail measurements are load-bearing for the central claim that high-energy emission properties extend beyond previous catalogs.
- [Results on temporal properties] Results on temporal properties: the reported delays and durations for the full sample of 186 events rest on localization and background rejection whose systematic floor is not assessed; any position-dependent PSF or integration-time-dependent bias would directly shift the headline numbers used to argue that “no model explains all results.”
minor comments (2)
- [Figures] Figure captions for the fluence and duration distributions should explicitly state the energy band and any cuts applied so that the claim of sampling lower fluences than the first catalog can be directly verified.
- [Sample description] The statement that 17 GRBs are seen only in the 30–100 MeV band would benefit from a short table or list of those events to allow readers to assess their contribution to the overall sample.
Simulated Author's Rebuttal
We thank the referee for the constructive comments on our manuscript. We address each major point below and will revise the paper to incorporate additional systematic assessments.
read point-by-point responses
-
Referee: [Data analysis / event selection] Data analysis / event selection section: no quantitative propagation is shown of background-model uncertainties, Earth-albedo leakage, or time-dependent effective-area variations into the onset-delay and duration values, especially for the tail events with delays exceeding 1 ks and durations exceeding 10 ks. These tail measurements are load-bearing for the central claim that high-energy emission properties extend beyond previous catalogs.
Authors: We agree that quantitative propagation of these uncertainties into the reported onset times and durations was not presented. In the revised manuscript we will add a dedicated subsection to the Data analysis section that estimates the contributions from background-model uncertainties, Earth-albedo leakage, and time-dependent effective-area variations, with explicit attention to the events having delays >1 ks and durations >10 ks. This will be done via Monte Carlo realizations of the background and exposure variations. revision: yes
-
Referee: [Results on temporal properties] Results on temporal properties: the reported delays and durations for the full sample of 186 events rest on localization and background rejection whose systematic floor is not assessed; any position-dependent PSF or integration-time-dependent bias would directly shift the headline numbers used to argue that “no model explains all results.”
Authors: We acknowledge that the systematic floor arising from localization accuracy and background rejection was not quantified. The revised Results section on temporal properties will include an assessment of this floor, including estimates of position-dependent PSF variations and integration-time-dependent biases, and will discuss how these affect the headline numbers and the statement that no current model accounts for all observations. revision: yes
Circularity Check
Catalog reports direct measurements; no derivation chain present
full rationale
This is an observational catalog paper that tabulates detected GRBs, reports measured onset times, durations, fluences, and spectra extracted from LAT data after standard processing. No equations, fitted parameters, or predictions are derived from the catalog itself and then re-presented as independent results. The statement that 'no model is currently able to explain all results' is an external comparison, not a self-referential derivation. Self-citations to prior LAT work are present but are not load-bearing for any claimed prediction or uniqueness theorem. The analysis is self-contained against external benchmarks (telescope data) and receives the default non-circularity finding.
Axiom & Free-Parameter Ledger
Reference graph
Works this paper leans on
-
[1]
Abdollahi, S., Ackermann, M., Ajello, M., et al. 2017, ApJ, 846, 34
work page 2017
-
[2]
Acero, F., Ackermann, M., Ajello, M., et al. 2015, ApJS, 218, 23 —. 2016, ApJS, 223, 26
work page 2015
- [3]
-
[4]
Ackermann, M., Ajello, M., Asano, K., et al. 2013a, ApJ, 763, 71 —. 2013b, ApJS, 209, 11 —. 2014, Science, 343, 42
work page 2014
-
[5]
Ackermann, M., Ajello, M., Albert, A., et al. 2016, ApJL, 823, L2
work page 2016
-
[6]
2011, Experimental Astronomy, 32, 193
Actis, M., Agnetta, G., Aharonian, F., et al. 2011, Experimental Astronomy, 32, 193
work page 2011
-
[7]
Ahlgren, B., Larsson, J., Nymark, T., Ryde, F., & Pe’er, A. 2015, MNRAS, 454, L31
work page 2015
- [8]
- [9]
-
[10]
Asano, K., Guiriec, S., & M´ esz´ aros, P. 2009, Astrophys. J. Lett., 705, L191
work page 2009
-
[11]
2013, arXiv e-prints, arXiv:1303.3514
Atwood, W., Albert, A., Baldini, L., et al. 2013a, ArXiv e-prints, arXiv:1303.3514
- [12]
-
[13]
Axelsson, M., Baldini, L., Barbiellini, G., et al. 2012, ApJL, 757, L31
work page 2012
- [14]
-
[15]
L., Axelsson, M., Baldini, L., et al
Band, D. L., Axelsson, M., Baldini, L., et al. 2009, ApJ, 701, 1673
work page 2009
-
[16]
Barthelmy, S. D., Kennea, J., & Racusin, J. 2012, GRB Coordinates Network, Circular Service, No. 13381, #1 (2012), 13381
work page 2012
-
[17]
Barthelmy, S. D., Barbier, L. M., Cummings, J. R., et al. 2005, Space Science Reviews, 120, 143
work page 2005
-
[18]
Beloborodov, A. M. 2002, ApJ, 565, 808 —. 2005, ApJL, 618, L13
work page 2002
-
[19]
Beloborodov, A. M., Hasco¨ et, R., & Vurm, I. 2014, ApJ, 788, 36
work page 2014
-
[20]
1995, Journal of the Royal Statistical Society
Benjamini, Y., & Hochberg, Y. 1995, Journal of the Royal Statistical Society. Series B (Methodological), 57, 289
work page 1995
-
[21]
2014, ApJ, 794, 135 88 The Fermi-LAT collaboration
Hinshaw, G. 2014, ApJ, 794, 135 88 The Fermi-LAT collaboration
work page 2014
-
[22]
Bhat, P. N., Meegan, C. A., von Kienlin, A., et al. 2016, ApJS, 223, 28
work page 2016
-
[23]
2017, in Proceedings of Science, ed
Bissaldi, E., Omodei, N., Vianello, G., Kocevski, D., & on behalf of the Fermi-LAT Collaboration. 2017, in Proceedings of Science, ed. Greiner & McEnery, Vol. 312, 5 Boˇ snjak,ˇZ., Daigne, F., & Dubus, G. 2009, Astronomy and Astrophysics, 498, 677
work page 2017
-
[24]
M., B´ egu´ e, D., Ryde, F., et al
Burgess, J. M., B´ egu´ e, D., Ryde, F., et al. 2016, ApJ, 822, 63
work page 2016
-
[25]
Burrows, D. N., Hill, J. E., Nousek, J. A., et al. 2005, Space Science Reviews, 120, 165
work page 2005
-
[26]
Perley, D. A. 2009, GRB Coordinates Network, 9053 Cherenkov Telescope Array Consortium, T., :,
work page 2009
-
[27]
Science with the Cherenkov Telescope Array
Acharya, B. S., et al. 2017, arXiv e-prints, arXiv:1709.07997 [astro-ph.IM] Chernoff, H. 1954, Ann. Math. Statist., 25, 573
work page internal anchor Pith review Pith/arXiv arXiv 2017
- [28]
-
[29]
Bloom, J. S. 2009, GRB Coordinates Network, 9028
work page 2009
-
[30]
J., & on behalf of the Fermi LAT collaboration
Ciprini, S., Thompson, D. J., & on behalf of the Fermi LAT collaboration. 2013, arXiv e-prints, arXiv:1303.4054
-
[31]
Connaughton, V., Briggs, M. S., Goldstein, A., et al. 2015, ApJS, 216, 32
work page 2015
- [32]
- [33]
-
[34]
Cucchiara, A., & Fox, D. B. 2010, GRB Coordinates Network, Circular Service, No. 10606, #1 (2010), 10606
work page 2010
- [35]
-
[36]
Cummings, J. R., & Palmer, D. M. 2013, GRB Coordinates Network, Circular Service, No. 14257, #1 (2013), 14257
work page 2013
-
[37]
2011, A&A, 526, A110 de Ugarte Postigo, A., Jakobsson, P., Malesani, D., et al
Daigne, F., Boˇ snjak,ˇZ., & Dubus, G. 2011, A&A, 526, A110 de Ugarte Postigo, A., Jakobsson, P., Malesani, D., et al. 2009, GRB Coordinates Network, 8766 de Ugarte Postigo, A., Kann, D. A., Thoene, C. C., et al. 2017, GRB Coordinates Network, Circular Service, No. 20990, #1 (2017), 20990 de Ugarte Postigo, A., Thoene, C. C., Gorosabel, J., et al. 2013a, ...
work page 2011
-
[38]
15187, #1 (2013), 15187 de Ugarte Postigo, A., Xu, D., Malesani, D., &
Service, No. 15187, #1 (2013), 15187 de Ugarte Postigo, A., Xu, D., Malesani, D., &
work page 2013
-
[39]
17822, #1 (2015), 17822 de Ugarte Postigo, A., Campana, S., Th¨ one, C
Network, Circular Service, No. 17822, #1 (2015), 17822 de Ugarte Postigo, A., Campana, S., Th¨ one, C. C., et al. 2013c, A&A, 557, L18 de Ugarte Postigo, A., Fynbo, J. P. U., Thoene, C., et al. 2015b, GRB Coordinates Network, Circular Service, No. 17583, #1 (2015), 17583
work page 2015
- [40]
- [41]
-
[42]
Esposito, J. A., Bertsch, D. L., Chen, A. W., et al. 1999, ApJS, 123, 203
work page 1999
-
[43]
Beardmore, A. P. 2016, GRB Coordinates
work page 2016
- [44]
-
[45]
Galli, M., Marisaldi, M., Fuschino, F., et al. 2013, A&A, 553, A33
work page 2013
- [46]
-
[47]
2013, Frontiers of Physics, 8, 661
Gehrels, N., & Razzaque, S. 2013, Frontiers of Physics, 8, 661
work page 2013
-
[48]
Gehrels, N., Chincarini, G., Giommi, P., et al. 2004, ApJ, 611, 1005
work page 2004
-
[49]
Ghisellini, G., Ghirlanda, G., Nava, L., & Celotti, A. 2010, MNRAS, 403, 926
work page 2010
-
[50]
C., Bouvier, A., Connaughton, V., et al
Gilmore, R. C., Bouvier, A., Connaughton, V., et al. 2013, Experimental Astronomy, 35, 413
work page 2013
-
[51]
Evans, P. A. 2015, GRB Coordinates Network, Circular Service, No. 18403, #1 (2015), 18403
work page 2015
-
[52]
Goldstein, A., Veres, P., Burns, E., et al. 2017, ApJL, 848, L14
work page 2017
-
[53]
Granot, J., Cohen-Tanugi, J., & do Couto e Silva, E. 2008, Astrophys. J., 677, 92
work page 2008
-
[54]
2009, A&A, 498, 89 The 2nd Fermi-LAT GRB catalog 89
Greiner, J., Clemens, C., Kr¨ uhler, T., et al. 2009, A&A, 498, 89 The 2nd Fermi-LAT GRB catalog 89
work page 2009
-
[55]
2012, GRB Coordinates Network, Circular
Gruber, D., Paciesas, W., Pelassa, V., & Chaplin, V. 2012, GRB Coordinates Network, Circular
work page 2012
- [56]
-
[57]
2014, ApJS, 211, 12 Hasco¨ et, R., Daigne, F., Mochkovitch, R., &
Gruber, D., Goldstein, A., Weller von Ahlefeld, V., et al. 2014, ApJS, 211, 12 Hasco¨ et, R., Daigne, F., Mochkovitch, R., &
work page 2014
- [58]
- [59]
- [60]
-
[61]
2017, GRB Coordinates Network, Circular Service, No
Kankare, E., O’Neill, D., Izzo, L., et al. 2017, GRB Coordinates Network, Circular Service, No. 22002, #1-2018 (2017), 22002
work page 2017
- [62]
-
[63]
Kocevski, D., Kennea, J. A., Lien, A. Y., Page, K. L., & Racusin, J. L. 2015, GRB Coordinates
work page 2015
- [64]
-
[65]
Kouveliotou, C., Meegan, C. A., Fishman, G. J., et al. 1993, ApJL, 413, L101
work page 1993
-
[66]
Kruehler, T., Greiner, G., & A., K. D. 2010, GRB Coordinates Network, Circular Service, No. 14500, #1 (2010), 14500
work page 2010
-
[67]
Kruehler, T., Schady, P., Greiner, J., & Tanvir, N. R. 2017, GRB Coordinates Network, Circular Service, No. 20686, #1 (2017), 20686
work page 2017
- [68]
-
[69]
2008, GRB Coordinates Network, 8601
Landsman, W., de Pasquale, M., Kuin, P., et al. 2008, GRB Coordinates Network, 8601
work page 2008
-
[70]
Lebrun, F., Leray, J. P., Lavocat, P., et al. 2003, A&A, 411, L141
work page 2003
-
[71]
Leloudas, G., Fynbo, J. P. U., Schulze, S., et al. 2013, GRB Coordinates Network, Circular
work page 2013
- [72]
- [73]
- [74]
-
[75]
Malesani, D., Goldoni, P., Fynbo, J. P. U., et al. 2009, GRB Coordinates Network, 9942
work page 2009
-
[76]
2016, GRB Coordinates Network, Circular Service, No
Malesani, D., de Ugarte Postigo, A., de Pasquale, M., et al. 2016, GRB Coordinates Network, Circular Service, No. 19708, #1 (2016), 19708
work page 2016
-
[77]
Maselli, A., Melandri, A., Nava, L., et al. 2014, Science, 343, 48
work page 2014
- [78]
- [79]
- [80]
discussion (0)
Sign in with ORCID, Apple, or X to comment. Anyone can read and Pith papers without signing in.