REVIEW 3 major objections 5 minor 1 cited by
Rethinking travel behavior modeling representations through embeddings
T0 review · 3 major / 5 minor · reviewed 2026-08-14 · deepseek-v4-flash
Pith's one-line read Re-representing categorical travel variables as learned low-dimensional embeddings improves out-of-sample mode choice models.
desk verdict Genuinely novel application of embeddings to categorical variables in discrete choice, but the headline out-of-sample gain probably reflects respondent-level train/test leakage. read the letter →
The pith
A machine-rendered reading of the paper's core claim, the machinery that carries it, and where it could break.
The reading
What carries the argument
The Travel Embeddings layer is a softmax-output neural network that takes a one-hot input for each categorical variable, multiplies by an embedding matrix $W$ of size $K \times D$ ($D$ categories in, $K$ embedding coordinates out), and feeds the resulting vector, together with other variables, into the final choice softmax. A second softmax regularizer branch tries to reconstruct the original one-hot vector, penalizing embeddings that throw away too much category identity. All embedding matrices are trained simultaneously on a train split, with the model chosen by development-set likelihood; after estimation the embeddings are projected back to dummy space to recover interpretable category coefficients and $p$-values. MDS plots of the resulting vectors let modelers read closeness between categories as similarity of effects on mode choice.
What would settle it
Using synthetic mode-choice data with known OD effects that are deliberately high-rank (e.g., 178 independent draws with no shared structure), fit the $K=3$ embedding model and a full dummy model; if the embedding still reports most OD coefficients as statistically significant, those significance claims are an artifact of forcing data through a rank-3 linear bottleneck rather than evidence of true structure.
Extended reading notes
Core claim
The central claim is that a categorical variable's effect in a random-utility mode choice model can be carried by a small vector in an embedding space, estimated jointly with the choice model by a neural network with a softmax output, and then projected back to the original dummy-variable coefficient space without losing interpretability. In the Swissmetro experiment, the best embedding model estimates 39 parameters instead of the 232 of the full dummy specification, reaches test pseudo-$R^2$ 0.326, and yields 164 statistically significant OD-pair coefficients; the full dummy model collapses on the test set (pseudo-$R^2$ -0.789), the reduced dummy model reaches 0.307, and PCA reaches 0.308. The paper reads these results as evidence that sharing a latent space lets every observation contribute to every category's estimate, and that supervised, task-specific encodings carry information an unsupervised PCA projection does not.
Load-bearing premise
The load-bearing premise is that the effect of every category—especially each of the 178 origin–destination pairs—can be captured by a point in a three-dimensional Euclidean space, so that Euclidean distance between points faithfully mirrors similarity of the categories' effects on mode choice.
Editorial extensions
If this is right
- High-cardinality categorical variables like OD pairs can enter choice models without the dimensionality explosion that makes dummy-variable estimation fail; the Swissmetro result of 164 significant OD coefficients is the direct evidence.
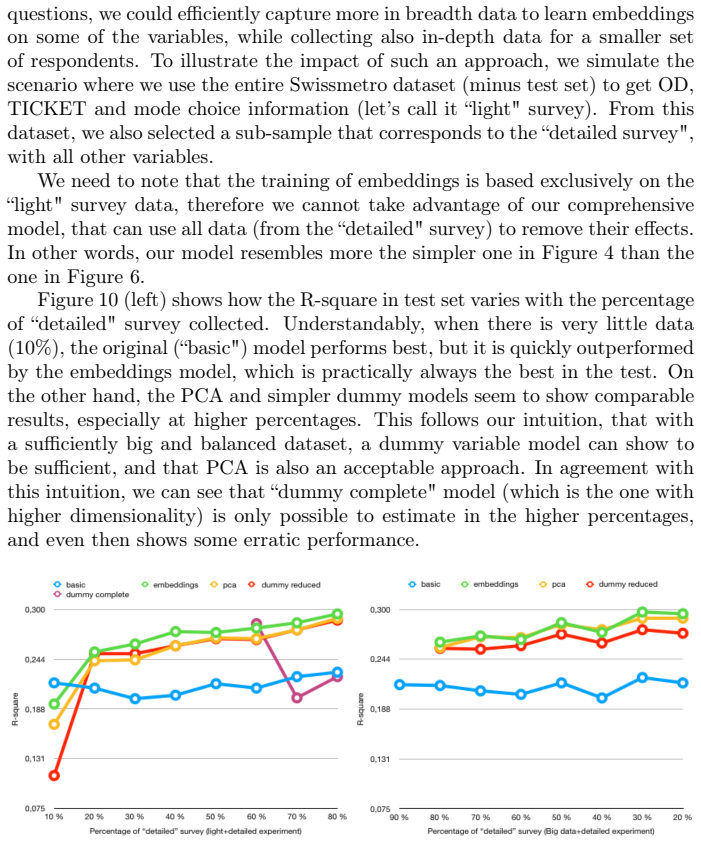
- Survey design can be split into a cheap light part (mode plus OD plus ticket) and a small detailed part; embeddings learned from the light part keep the choice model competitive at detailed-sample percentages as low as 10%.
- Because embeddings are task-specific, the same variable will receive different encodings for different choice problems, unlike PCA or dummy schemes, which are fixed representations.
- Coefficients remain interpretable: by projecting back to the dummy-variable space, the model yields category-level coefficients and significance tests, so the method is not a black box.
- The advantage shrinks as datasets grow; with large, well-balanced samples the paper expects dummy variables to be sufficient.
Reading between the lines
- A testable extension of the paper's logic is that one categorical variable should receive different embeddings for different targets (mode choice versus departure time versus destination choice), and the distances between categories should reshuffle accordingly; this follows from the supervised design but is not demonstrated in the paper.
- The strong OD result suggests a geometric prediction: if OD effects are truly low-rank in $K=3$, the dominant axes should align with major transport corridors or city-pair volumes, a check that the paper's MDS plots only hint at.
- The transferability claim predicts that embeddings trained on one city's or country's travel survey should improve out-of-sample fit in another survey precisely when travel behavior is consistent between them; running that cross-dataset test would settle the community-database vision.
- Because the embedding is a linear projection, it could be inserted into nested or mixed logit specifications as continuous covariates in taste parameters, preserving the projection-to-dummy interpretation; this is a natural next step the paper mentions only as future work.
Signed reviews
Editorial analysis
A structured set of objections, weighed in public.
Referee Report
Summary. The paper proposes 'travel behavior embeddings,' a method that re-represents categorical variables from travel surveys (e.g., origin-destination, ticket type, who pays, age, income) as low-dimensional continuous vectors learned by a neural network, in the spirit of word2vec. The embeddings are trained simultaneously with a regularizer layer, then fed as regressors into a multinomial logit mode-choice model for the Swissmetro dataset. The authors compare out-of-sample performance against dummy-variable encodings (with and without origin-destination effects) and PCA encodings, reporting that their best embeddings model achieves the highest test pseudo-R2 and can estimate statistically significant coefficients for 164 of 178 OD pairs. They also present scenario analyses for efficient survey design and release a Python package, PyTre, with replication code and data.
Significance. If the empirical claims hold, the paper makes a useful methodological contribution by adapting embedding techniques to discrete-choice travel behavior modeling, with the practical benefits of dimensionality reduction and shared latent structure. The open-source package and reproducible notebook are clear strengths, as is the repeated-run design with a development set (300 runs) and the explicit reporting of mean and standard deviation. The projection back into dummy-variable space for interpretability is also a valuable feature. However, the headline result depends on several load-bearing assumptions about the experimental design and the stability of the reported gains; the stated 'up to 20% out-of-sample improvement' is not robustly established by the evidence in the current version.
major comments (3)
- [Section 5.1 (experimental split)] Section 5.1 states that the Swissmetro data consist of 10,469 responses from 1,188 individuals, and then describes the split only as '60% of the dataset (6373 vectors)', '20% (2003 vectors)', and '20% (2003 vectors)'. Because this is a stated-preference panel with repeated choices per person, a row-level random split likely places the same respondents in both the training and test sets. The test-set log-likelihoods in Table 12, which are the basis of the paper's central out-of-sample claims, would then reflect within-person leakage rather than prediction for new travelers, and the pseudo-R2 differences would not measure true out-of-sample generalization. The paper needs either an individual-level split, a clustered evaluation that accounts for repeated observations, or an explicit and defensible justification for treating each choice as independent.
- [Section 5.3 and Table 12 (model selection and reported gains)] The test-set comparison in Table 12 uses the single best embeddings model out of 300 runs, selected by development-set log-likelihood. The reported mean test log-likelihood is -1415.7 with standard deviation 11.3, versus -1427.0 for PCA and -1429.3 for reduced dummies; the 'best' value is -1389.9. The mean improvement over PCA is only about 0.8% and is well within one standard deviation of the run-to-run variation. The headline 'up to 20%' improvement is therefore an extreme-statistic artifact unless the full distribution of test performances and the selection procedure justify it. The authors should report the distribution, compare mean embedding performance against PCA, and, if claiming superiority, provide a statistical test that accounts for the multiple comparisons across the 300 runs.
- [Section 5.2 (Table 3) and Section 5.3 (projected OD coefficients)] The embedding dimensions K in Table 3 are chosen through an 'incremental grid search' whose exact range, criterion, and number of configurations are not specified; this makes it unclear how much model selection is being performed and whether the reported results capitalize on chance. Additionally, the 164 'statistically significant' projected OD coefficients in Table 6 treat the learned embeddings as fixed when applying normal-distribution linear-combination rules, ignoring the sampling variability of the embedding estimates themselves. The p-values are thus conditional on a stochastic, data-driven representation and are likely anticonservative. The authors should either provide a bootstrap procedure that re-estimates embeddings, or clearly state and justify the conditional interpretation.
minor comments (5)
- [Abstract and Section 1] The abstract contains the typo 'model choice model' instead of 'mode choice model,' and Section 1 has 'efects' for 'effects.' These should be corrected.
- [Table 12] The row labeled 'Embeddings (mean)' reports the same training log-likelihood (-4,397.0) as the 'Embeddings (best)' row despite the standard deviation of 10.7; this is either a typo or requires clarification of what the mean was computed over.
- [Section 5.2] The choice of K using the '90% variance explained' PCA rule is mentioned only parenthetically, and the reader is told the results were 'generally worse' but not shown. Since this is a natural data-driven baseline for setting K, a brief summary of those results would improve transparency.
- [Section 5.6] The 'Big Data + detailed survey' simulation (Figure 10, right) is described at a high level, but the exact procedure for splitting the Swissmetro data into 'big data' and 'detailed' portions, and the number of repetitions used, are not specified; error bars or confidence intervals would help interpret the comparisons.
- [References] Reference [1] is given as 'Tech. rep.' without a number or year; the standard Swissmetro report (Bierlaire, Axhausen, and Abay, 2001) should be cited in a complete form.
Circularity Check
No significant circularity: the embeddings are supervised, but the claimed improvements are measured on a held-out test set against independent baselines.
full rationale
The paper's central claim is empirical: embedding encodings of categorical variables improve out-of-sample mode-choice log-likelihood relative to dummy and PCA encodings. This claim is not equivalent to an input by construction. The embeddings and the final MNL are both estimated on the training set, but the reported headline numbers (Table 12: test log-likelihood -1,389.9 for embeddings vs -1,429.3 for reduced dummies and -1,427.0 for PCA) are evaluated on a 20% test split (Section 5.1) that is not used for estimating the embeddings or the choice-model coefficients. The K values come from a grid search on the development set (Section 5.2), and the best of 300 stochastic embedding runs is selected by development-set log-likelihood (Section 5.3); this is ordinary model selection, not a fitted parameter renamed as a prediction, because the test set remains out-of-sample for the reported comparisons. The projection of 164 statistically significant OD coefficients is a linear reparameterization of the low-dimensional embedding coefficients, with significance propagated by the stated normal-rule in Section 3; it is an interpretation of the fitted model, not a separate prediction. The only self-citation ([11], Rodrigues, Markou, and Pereira) is motivational and is not load-bearing for the Swissmetro experiment, which uses open data and external baselines (Swissmetro, PyLogit). No uniqueness theorem is invoked, and no equation is assumed as its own conclusion. A separate validity concern exists: the row-level random split may leak repeated choices from the same 1,188 respondents between folds (Section 5.1 reports only percentages of vectors, not respondent-level separation), and the paper's limitation discussion acknowledges stochasticity but not panel structure. That is an empirical correction issue relevant to the strength of the comparison, but it is not a circularity of definition.
Assumptions & free parameters
free parameters (7)
- Embedding size K for OD =
3
- Embedding size K for TICKET =
5
- Embedding size K for WHO =
1
- Embedding size K for AGE =
3
- Embedding size K for INCOME =
3
- Regularization penalty hyperparameters =
not reported
- Training epochs and optimizer settings =
80 epochs; optimizer not specified
assumptions (6)
- domain assumption Random utility maximization and multinomial logit are appropriate for mode choice analysis.
- ad hoc to paper Categories with similar effects on mode choice are close in a low-dimensional Euclidean embedding space.
- ad hoc to paper A 3-dimensional linear space is sufficient for the mode-choice-relevant variation of 178 OD pairs.
- domain assumption Using the same choice outcome to learn embeddings and to estimate the final choice model, on the same training set, yields a fair comparison.
- domain assumption The 10469 Swissmetro responses from 1188 individuals can be treated as independent observations.
- ad hoc to paper Projected dummy-space coefficients and p-values can be obtained by treating learned embeddings as fixed and applying normal linear-combination rules.
Cite this review
Pith. "Pith review of Rethinking travel behavior modeling representations through embeddings." pith.science (2026). https://pith.science/paper/I2P7AFGG
@misc{pith2026190900154,
  author       = {Pith},
  title        = {Pith review of: Rethinking travel behavior modeling representations through embeddings},
  year         = {2026},
  howpublished = {\url{https://pith.science/paper/I2P7AFGG}},
  note         = {Machine review of arXiv:1909.00154}
}
read the original abstract
This paper introduces the concept of travel behavior embeddings, a method for re-representing discrete variables that are typically used in travel demand modeling, such as mode, trip purpose, education level, family type or occupation. This re-representation process essentially maps those variables into a latent space called the \emph{embedding space}. The benefit of this is that such spaces allow for richer nuances than the typical transformations used in categorical variables (e.g. dummy encoding, contrasted encoding, principal components analysis). While the usage of latent variable representations is not new per se in travel demand modeling, the idea presented here brings several innovations: it is an entirely data driven algorithm; it is informative and consistent, since the latent space can be visualized and interpreted based on distances between different categories; it preserves interpretability of coefficients, despite being based on Neural Network principles; and it is transferrable, in that embeddings learned from one dataset can be reused for other ones, as long as travel behavior keeps consistent between the datasets. The idea is strongly inspired on natural language processing techniques, namely the word2vec algorithm. Such algorithm is behind recent developments such as in automatic translation or next word prediction. Our method is demonstrated using a model choice model, and shows improvements of up to 60\% with respect to initial likelihood, and up to 20% with respect to likelihood of the corresponding traditional model (i.e. using dummy variables) in out-of-sample evaluation. We provide a new Python package, called PyTre (PYthon TRavel Embeddings), that others can straightforwardly use to replicate our results or improve their own models. Our experiments are themselves based on an open dataset (swissmetro).
Figures


Figures from the paper (7 more)


Forward citations
Cited by 1 Pith paper
-
Aligning LLM with human travel choices: a persona-based embedding learning approach
A persona-based embedding learning framework aligns LLM predictions with human travel mode choices, outperforming MNL and few-shot LLM baselines on the Swissmetro dataset.
Reference graph
Works this paper leans on
-
[1]
M. Bierlaire, K. Axhausen, G. Abay, The acceptance of modal innovation: The case of swissmetro, Tech. rep. (2001)
work page 2001
-
[2]
M. E. Ben-Akiva, S. R. Lerman, S. R. Lerman, Discrete choice analysis: theory and application to travel demand, Vol. 9, MIT press, 1985
work page 1985
-
[3]
N.Arora, G.M.Allenby, J.L.Ginter, Ahierarchicalbayesmodelofprimary and secondary demand, Marketing Science 17 (1) (1998) 29–44
work page 1998
-
[4]
M. J. Davis, Contrast coding in multiple regression analysis: Strengths, weaknesses, and utility of popular coding structures, Journal of Data Sci- ence 8 (1) (2010) 61–73
work page 2010
-
[5]
D. Guthrie, B. Allison, W. Liu, L. Guthrie, Y. Wilks, A closer look at skip-gram modelling., in: LREC, 2006, pp. 1222–1225
work page 2006
-
[6]
T. Mikolov, K. Chen, G. Corrado, J. Dean, Efficient estimation of word representations in vector space, arXiv preprint arXiv:1301.3781
-
[7]
Word2vec tutorial - the skip-gram model, http://mccormickml.com/ 2016/04/19/word2vec-tutorial-the-skip-gram-model/ , accessed: 2019-06-30
work page 2016
-
[8]
Fasttext - embeddings for 157 languages,https://fasttext.cc, accessed: 2019-06-19
work page 2019
Show all 15 references
-
[9]
google.com/machine-learning/crash-course/embeddings/ translating-to-a-lower-dimensional-space , accessed: 2019-06- 19
Translating to a lower dimensional space, https://developers. google.com/machine-learning/crash-course/embeddings/ translating-to-a-lower-dimensional-space , accessed: 2019-06- 19
2019
-
[10]
Goldberg, O
Y. Goldberg, O. Levy, word2vec explained: deriving mikolov et al.’s negative-sampling word-embedding method, arXiv preprint arXiv:1402.3722
-
[11]
Rodrigues, I
F. Rodrigues, I. Markou, F. C. Pereira, Combining time-series and textual data for taxi demand prediction in event areas: A deep learning approach, Information Fusion 49 (2019) 120–129
2019
-
[12]
Brathwaite, J
T. Brathwaite, J. L. Walker, Asymmetric, closed-form, finite-parameter models of multinomial choice, Journal of choice modelling 29 (2018) 78– 112
2018
-
[13]
Swissmetro - variable description, http://transp-or.epfl.ch/ documents/technicalReports/CS_SwissmetroDescription.pdf, ac- cessed: 2019-06-19. 28
2019
-
[14]
Inferring dynamic origin-destination flows by transport mode using mobile phone data, Transportation Research Part C: Emerging Technologies 101 (2019) 254 – 275
2019
-
[15]
Nguyen, W
D. Nguyen, W. Luo, T. D. Nguyen, S. Venkatesh, D. Phung, Sqn2vec: Learning sequence representation via sequential patterns with a gap con- straint, in: Joint European Conference on Machine Learning and Knowl- edge Discovery in Databases, Springer, 2018, pp. 569–584. 29
2018
Reviewed August 14, 2026 · model on record in the stance chip above.
Discussion (0). Continue with ORCID to comment.