REVIEW 2 major objections 4 minor 202 references
Fragmentation and filaments at the onset of star and cluster formation: SABOCA 350 $\mu$m view of ATLASGAL selected massive clumps
T0 review · 2 major / 4 minor · reviewed 2026-08-14 · deepseek-v4-flash
Pith's one-line read The most massive fragment inside a clump scales almost one-to-one with clump mass, a sign that self-gravity shapes small-scale structure.
desk verdict A careful, useful census with a genuinely new target list, but the headline self-gravity interpretation of the M_mmf–M_clump correlation is shakier than the abstract lets on. read the letter →
The pith
A machine-rendered reading of the paper's core claim, the machinery that carries it, and where it could break.
The reading
What carries the argument
The load-bearing object is the empirical relation between the most massive fragment mass and the clump mass, $M_{\rm mmf} = 0.31\,M_{\rm clump}^{0.96}$, together with the data chain that produces it. That chain consists of SABOCA 350 μm maps at 8.5 arcsecond resolution, Fourier-combined with Herschel SPIRE 350 μm data to recover extended emission; pixel-by-pixel modified-blackbody SED fits at 10 arcsecond resolution that convert 70-870 μm fluxes into dust temperature, column density, and mass; Gaussclumps, a Gaussian-decomposition source extractor, to define the compact cores; and positional matching to 22-24 μm and 70 μm point-source catalogs to separate star-forming from quiescent cores. The relation carries the self-gravity argument because it ties the parent reservoir to its most massive product across two orders of magnitude in clump mass.
What would settle it
Image the 27 massive quiescent cores with sub-arcsecond interferometry and search for outflow wings, hot-core tracers, or compact continuum sources; widespread detections would falsify the pre-stellar interpretation. A complementary test would re-derive the $M_{\rm mmf}$-$M_{\rm clump}$ correlation after convolving every map to a common physical resolution, since a slope well below 0.96 would weaken the self-gravity claim.
Extended reading notes
Core claim
On the paper's own terms, the central discovery is a scaling law connecting the two ends of the fragmentation hierarchy: inside massive clumps, the most massive fragment obeys $M_{\rm mmf} = 0.31\,M_{\rm clump}^{0.96}$ in the 2-4 kpc distance-limited sample (Spearman coefficient 0.92, p < 0.001), meaning roughly 30 percent of the clump mass is already assembled in its single heaviest core. The same analysis finds that the number of fragments correlates only moderately with clump density (Spearman ~0.41) and with the number of thermal Jeans masses (0.31-0.40), and that typical fragment masses exceed the thermal Jeans mass by 10-100 times. The companion result is a census of 27 quiescent cores with $M > 100\,M_\odot$ at distances below 5 kpc that show no compact 22-24 μm or 70 μm counterparts; the paper presents them as promising candidates for massive pre-stellar cores, while explicitly leaving open the alternative that they are deeply embedded high-mass protostars.
Load-bearing premise
The 27 pre-stellar candidates are defined by the absence of a compact 24 or 70 micron infrared source, yet a deeply embedded massive protostar can be hidden at exactly those wavelengths, so a core without such a counterpart is not guaranteed to be starless.
Editorial extensions
If this is right
- Because the most massive fragment holds roughly 30 percent of the clump mass, the clump mass sets the upper end of the core mass function and, plausibly, the mass of the cluster that forms.
- The scarcity of massive quiescent cores above 100 solar masses (27 in the sample) implies that such dense structures either collapse quickly or quickly become visible in the mid-infrared.
- Fragment spacing is broadly consistent with thermal Jeans lengths, but individual fragments are 10 to 100 times the thermal Jeans mass, so turbulent or self-gravitating support must set the fragment masses.
- Quiescent and star-forming cores have similar masses but different surface densities and temperatures, supporting a picture where the quiescent cores are the same objects at an earlier stage along one evolutionary path.
- The steepening of the mass-radius relation toward smaller scales (slope near 3 rather than 2) points to self-gravity becoming dominant from clump to core scales.
Reading between the lines
- If the $M_{\rm mmf}$-$M_{\rm clump}$ relation holds at fixed physical resolution, it would give observers a predictor: the most massive star in a young cluster could be anticipated from the clump mass, much as the $m_{\rm max}$-$M_{\rm ecl}$ relation anticipates the most massive star from cluster mass; the paper compares the two but does not claim equality.
- Because the sample is selected to be weak or dark at 24 μm, the correlations are measured on an early-stage population; extending the same analysis to more evolved, mid-infrared-bright clumps would show whether the 30 percent fraction changes with evolution.
- Smoothing all maps to a common physical resolution before measuring $M_{\rm mmf}$ would test whether part of the correlation is simply a distance and resolution artifact, since more distant clumps are seen with worse linear resolution.
Signed reviews
Editorial analysis
A structured set of objections, weighed in public.
Referee Report
Summary. This paper reports SABOCA 350 μm observations of 204 ATLASGAL massive clumps, extracts 1120 compact sources with Gaussclumps, and derives clump and core physical properties from pixel-by-pixel SED fitting using Herschel, LABOCA, and SABOCA data. The authors classify cores as star-forming or quiescent using 22/24 μm and 70 μm point-source associations, analyze fragmentation levels as a function of clump properties, and identify 27 massive (>100 M_sun) quiescent cores within 5 kpc as candidate massive pre-stellar cores or deeply embedded high-mass protostars. The main quantitative claims are a moderate correlation of fragment number with clump density and Jeans number, and a strong correlation between the most massive fragment mass and clump mass, log M_mmf = 0.96 log M_clump - 1.18 (Spearman rho = 0.92), which the authors interpret as evidence that self-gravity plays an important role in clump-scale structure formation.
Significance. The paper delivers a valuable observational dataset: a homogeneous 350 μm survey of 204 clumps, SED-based masses and luminosities for 971 cores, and a public machine-readable catalog. The empirical correlations are benchmarked against an independent dendrogram extraction in Appendix C, which strengthens the credibility of the source-extraction-dependent results. The 27 massive quiescent cores constitute a useful target list for high-resolution follow-up with ALMA. However, the physical interpretation of the headline M_mmf–M_clump correlation as evidence for self-gravity is not uniquely supported by the present analysis, because both masses share a common d^2 scaling and the most massive fragment is by construction a sub-structure of the clump. The quiescent classification of the massive cores also carries a contamination risk that the paper itself partly documents. These issues are addressable with additional null tests and more cautious wording, so the paper is suitable for major revision rather than rejection.
major comments (2)
- [Sec. 5.3.1, Fig. 15, Eq. (2), App. C] The headline correlation log M_mmf = 0.96 log M_clump - 1.18 with Spearman rho = 0.92 is interpreted as evidence that self-gravity sets the clump-to-core mass relation, but two built-in effects are not separated. First, Eq. (2) gives both M_clump and M_mmf as M = mu m_H N(H2) A d^2, so even within the 2-4 kpc distance bin both quantities share a common d^2 scaling; a factor of 2 in distance produces a spread of ~0.6 dex in log d^2 and will push a log-log correlation toward a slope near unity even if no intrinsic mass-mass relation exists. The Spearman coefficient is rank-based and does not remove this common scaling. Second, M_mmf is by construction the largest sub-structure inside M_clump; Appendix C itself notes that the relative size difference between parent and child structures 'together lead again to the tight correlation between the mass of the most massive fragment and the parental clump mass,' illustrating the definitional component. The dendrogram cross-check in App. C inherits both the distance scaling and the subset relation, so it does not serve as a null test. To support the self-gravity interpretation, please report a partial Spearman correlation controlling for distance, a narrow-distance-bin fit (e.g., 2.5-3.5 kpc), or a null model in which fragment masses are randomly assigned to clumps of the observed mass function. Without such a test, the claim should be stated as a correlation whose physical origin requires further investigation, not as direct evidence for self-gravity.
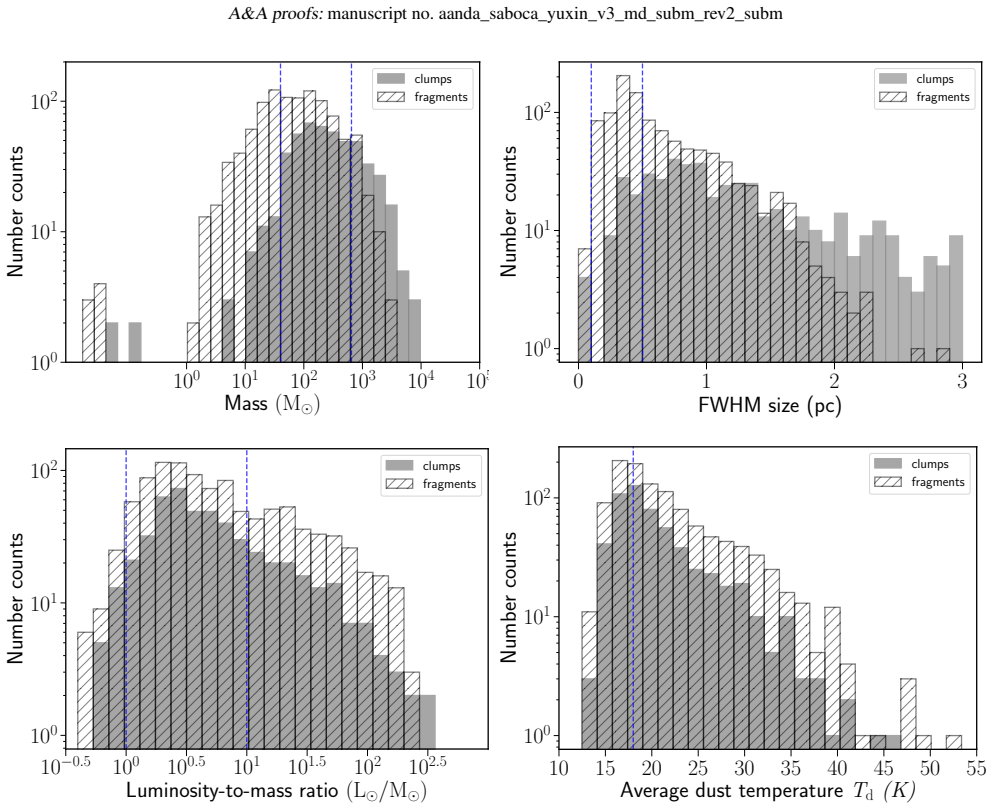
- [Sec. 4.4 and Sec. 5.4, Table 5] The identification of 27 massive quiescent cores as candidates for massive pre-stellar cores rests on the absence of compact 24/22 μm and 70 μm counterparts. This classification criterion is not sufficient to exclude deeply embedded high-mass protostars, which can be invisible at these wavelengths; the paper itself notes in Sec. 5.4 that deeply embedded high-mass protostars have been detected toward mid-infrared quiet massive cores. The ALMA follow-up of two candidates, G333.1298-0.5602 and G333.4659-0.1641, shows that the brightest sub-arcsecond fragments are high-mass protostellar objects rather than pre-stellar cores. If a comparable fraction of the remaining candidates are protostellar, the claim of a population of massive pre-stellar cores would be substantially weakened. Please quantify the possible contamination using the derived 70 μm opacities and the sensitivity limits of the mid-infrared catalogs, clearly mark the ALMA-confirmed sources in Table 5, and adjust the strength of the conclusion accordingly.
minor comments (4)
- [Fig. 15 and Fig. C.3 captions] The fitted relation is written as 'M_fragments = 0.96 log M_clumps - 1.18'; since the horizontal axis is logarithmic, the left-hand side should be log M_mmf (and similarly in Fig. C.3).
- [Sec. 5.3.1 and Fig. 14] The quantity Nmm is used repeatedly but never defined; please define the acronym or replace it with a descriptive symbol such as N_frag.
- [Table 5] The symbols in the SiO and HCO+/H13CO+ columns (a, b, c, d, e, y, '-') are only partially explained in the table notes; please give a complete legend so the table can stand alone.
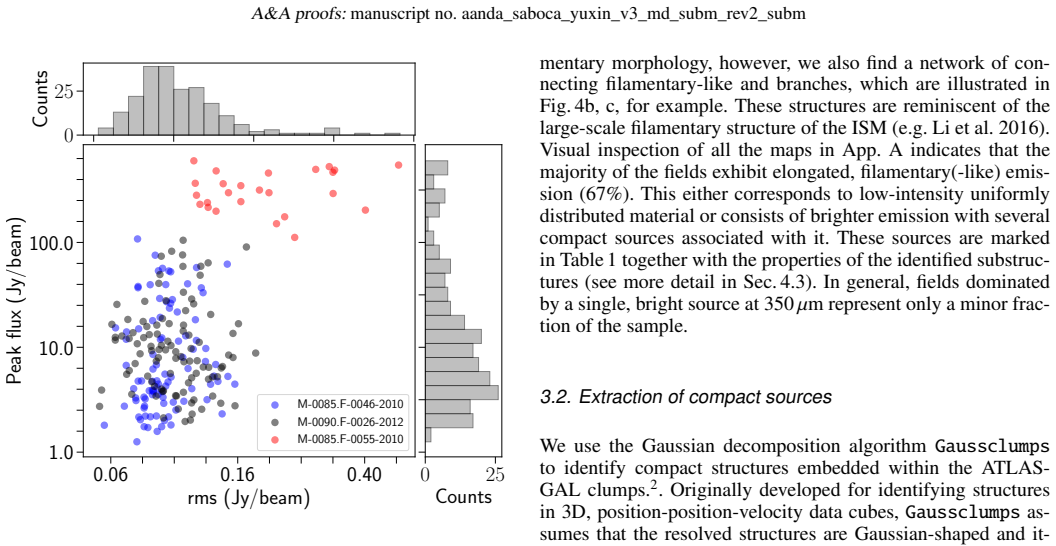
- [Sec. 3.1] The statement that 67% of fields exhibit filamentary(-like) morphology is based on visual inspection; please state this explicitly and, if possible, provide a simple quantitative criterion or acknowledge that the fraction is a visual estimate.
Circularity Check
No significant circularity: the paper's correlations are observational measurements, not fitted inputs renamed as predictions.
full rationale
The paper's headline results are measurements, not fits masquerading as predictions. Clump and fragment masses are independently computed from SED fits to different-resolution maps (Secs. 4.1 and 4.2) using Eq. 2, and the M_mmf-M_clump correlation (Sec. 5.3.1, Fig. 15) is then compared, not used as an input, to theoretical expectations. The paper does not fit a parameter to a subset of data and call the result a prediction; no result is defined in terms of another result; and no load-bearing claim rests on a self-citation. The two Csengeri et al. citations used in Sec. 5.4 actually provide ALMA evidence that some quiescent-core candidates are protostellar, which weakens rather than forces the paper's candidate claim, so self-citation is not being used to impose the conclusion. The distance-limited 2-4 kpc subsample and the independent dendrogram benchmark in App. C are genuine attempts to address resolution, distance, and extraction-method biases. The shared d^2 term in Eq. 2 and the fact that the most massive fragment is a sub-region of the parent clump are legitimate statistical cautions about the physical interpretation of the correlation, but they are not circular derivation: no equation sets M_mmf equal to a fitted function of M_clump, and a Spearman rank correlation is not an algebraic identity forced by the common distance factor. Under the hard rules, this is a no-circularity finding.
Assumptions & free parameters
free parameters (2)
- Gaussclumps stiffness parameters (s0, sc, sa) =
(1, 1, 10)
- Initial FWHM guess for Gaussclumps =
1.1 x beam (9.35 arcsec)
assumptions (7)
- domain assumption Emission from dust can be described by a single-temperature modified blackbody, I_nu = B_nu(T_d)(1 - exp(-tau_nu)) (Eq. 1).
- domain assumption Dust opacity law kappa_nu = 0.1 (nu/1000 GHz)^1.8 cm2/g, gas-to-dust ratio of 100, and mean molecular weight 2.8.
- ad hoc to paper The four bands 160, 250, 350, and 870 micron trace the cold dust component, so the 70 micron flux can be rescaled by the ratio of observed to extrapolated 70 micron flux.
- domain assumption Absence of a compact 24/22 micron or 70 micron counterpart identifies a quiescent core.
- domain assumption Kinematic distances from Urquhart et al. (2018) are accurate.
- domain assumption Thermal Jeans fragmentation estimates computed from clump-averaged temperature and density are the relevant predictor of the observed number of fragments.
- domain assumption The fragmentation temperature is assumed to be 20 K when computing the Jeans number for the stronger correlation.
Cite this review
Pith. "Pith review of Fragmentation and filaments at the onset of star and cluster formation: SABOCA 350 $\mu$m view of ATLASGAL selected massive clumps." pith.science (2026). https://pith.science/paper/ZT5ZOUBM
@misc{pith2026190901011,
  author       = {Pith},
  title        = {Pith review of: Fragmentation and filaments at the onset of star and cluster formation: SABOCA 350 $\mu$m view of ATLASGAL selected massive clumps},
  year         = {2026},
  howpublished = {\url{https://pith.science/paper/ZT5ZOUBM}},
  note         = {Machine review of arXiv:1909.01011}
}
abstract
The structure formation of the dense interstellar material and the fragmentation of clumps into cores is a fundamental step to understand how stars and stellar clusters form. We aim to establish a statistical view of clump fragmentation at sub-parsec scales based on a large sample of massive clumps selected from the ATLASGAL survey. We used the APEX/SABOCA camera at 350 $\mu$m to image clumps at a resolution of 8.$''$5. The majority of the sample consists of massive clumps that are weak or in absorption at 24 $\mu$m. We resolve rich filamentary structures and identify the population of compact sources. We use association with mid-infrared 22-24 $\mu$m and 70 $\mu$m point sources to pin down the star formation activity of the cores. We then statistically assess their physical properties, and the fragmentation characteristics of massive clumps. We find a moderate correlation between the clump fragmentation levels with the clump gas density and the predicted number of fragments with pure Jeans fragmentation scenario; we find a strong correlation between the mass of the most massive fragment and the total clump mass, suggesting that the self-gravity may play an important role in the clumps' small scale structure formation. We identify 27 massive quiescent cores with $M_{\rm core}>100$ M$_{\odot}$ within 5 kpc; these are massive enough to be self-gravitating but do not yet show any sign of star-formation. This sample comprises, therefore, promising candidates of massive pre-stellar cores, or deeply embedded high-mass protostars.
Figures


Figures from the paper (14 more)





Reference graph
Works this paper leans on
-
[1]
, " * write output.state after.block = add.period write newline
ENTRY address archiveprefix author booktitle chapter edition editor howpublished institution eprint journal key month note number organization pages publisher school series title type volume year label extra.label sort.label short.list INTEGERS output.state before.all mid.sentence after.sentence after.block FUNCTION init.state.consts #0 'before.all := #1 ...
-
[2]
write newline
" write newline "" before.all 'output.state := FUNCTION n.dashify 't := "" t empty not t #1 #1 substring "-" = t #1 #2 substring "--" = not "--" * t #2 global.max substring 't := t #1 #1 substring "-" = "-" * t #2 global.max substring 't := while if t #1 #1 substring * t #2 global.max substring 't := if while FUNCTION word.in bbl.in " " * FUNCTION format....
-
[3]
E., Ginsburg , A
Aguirre , J. E., Ginsburg , A. G., Dunham , M. K., et al. 2011, The Astrophysical Journal Supplement Series, 192, 4
2011
-
[4]
2014, Protostars and Planets VI, 27
Andr \'e , P., Di Francesco , J., Ward-Thompson , D., et al. 2014, Protostars and Planets VI, 27
2014
-
[5]
2010, , 518, L102
Andr \'e , P., Men'shchikov , A., Bontemps , S., et al. 2010, , 518, L102
2010
-
[6]
2008, , 490, L27
Andr \'e , P., Minier , V., Gallais , P., et al. 2008, , 490, L27
2008
-
[7]
2016, , 592, A54
Andr \'e , P., Rev \'e ret , V., K \"o nyves , V., et al. 2016, , 592, A54
2016
-
[8]
M., Sip o cz , B
Astropy Collaboration , Price-Whelan , A. M., Sip o cz , B. M., et al. 2018, , 156, 123
2018
Show all 202 references
-
[9]
& Mac Low , M.-M
Ballesteros-Paredes , J. & Mac Low , M.-M. 2002, , 570, 734
2002
-
[10]
C., Ahmadi , A., et al
Beuther , H., Mottram , J. C., Ahmadi , A., et al. 2018, , 617, A100
2018
-
[11]
2010, , 524, A18
Bontemps , S., Motte , F., Csengeri , T., & Schneider , N. 2010, , 524, A18
2010
-
[12]
Butler , M. J. & Tan , J. C. 2012, , 754, 5
2012
-
[13]
2016, , 833, 113
Camacho , V., V \'a zquez-Semadeni , E., Ballesteros-Paredes , J., et al. 2016, , 833, 113
2016
-
[14]
F., Harvey , P
Campbell , M. F., Harvey , P. M., Lester , D. F., & Clark , D. M. 2004, , 600, 254
2004
-
[15]
J., Noriega-Crespo , A., Mizuno , D
Carey , S. J., Noriega-Crespo , A., Mizuno , D. R., et al. 2009, , 121, 76
2009
-
[16]
V., Zhang , Q., Wright , M
Chen , H.-R. V., Zhang , Q., Wright , M. C. H., et al. 2019, , 875, 24
2019
-
[17]
C., Liu , M., et al
Cheng , Y., Tan , J. C., Liu , M., et al. 2018, , 853, 160
2018
-
[18]
1999, , 343, 585
Codella , C., Bachiller , R., & Reipurth , B. 1999, , 343, 585
1999
-
[19]
C., Kritsuk , A
Collins , D. C., Kritsuk , A. G., Padoan , P., et al. 2012, , 750, 13
2012
-
[20]
2011, , 740, L5
Csengeri , T., Bontemps , S., Schneider , N., et al. 2011, , 740, L5
2011
-
[21]
2018, , 617, A89
Csengeri , T., Bontemps , S., Wyrowski , F., et al. 2018, , 617, A89
2018
-
[22]
2017 a , , 601, A60
Csengeri , T., Bontemps , S., Wyrowski , F., et al. 2017 a , , 601, A60
2017
-
[23]
2017 b , , 600, L10
Csengeri , T., Bontemps , S., Wyrowski , F., et al. 2017 b , , 600, L10
2017
-
[24]
2016 a , , 586, A149
Csengeri , T., Leurini , S., Wyrowski , F., et al. 2016 a , , 586, A149
2016
-
[25]
S., Schuller , F., et al
Csengeri , T., Urquhart , J. S., Schuller , F., et al. 2014, , 565, A75
2014
-
[26]
2016 b , , 585, A104
Csengeri , T., Weiss , A., Wyrowski , F., et al. 2016 b , , 585, A104
2016
-
[27]
M., Wright , E
Cutri , R. M., Wright , E. L., Conrow , T., et al. 2012, Explanatory Supplement to the WISE All-Sky Data Release Products , Tech. rep
2012
-
[28]
Donoho, D. L. & Johnstone, I. M. 1994, Biometrika, 81, 425
1994
-
[29]
2013, , 558, A125
Duarte-Cabral , A., Bontemps , S., Motte , F., et al. 2013, , 558, A125
2013
-
[30]
M., Crapsi , A., Evans , Neal J., I., et al
Dunham , M. M., Crapsi , A., Evans , Neal J., I., et al. 2008, The Astrophysical Journal Supplement Series, 179, 249
2008
-
[31]
J., Moore , T
Eden , D. J., Moore , T. J. T., Plume , R., et al. 2017, , 469, 2163
2017
-
[32]
2017, , 471, 100
Elia , D., Molinari , S., Schisano , E., et al. 2017, , 471, 100
2017
-
[33]
& Klessen , R
Federrath , C. & Klessen , R. S. 2013, , 763, 51
2013
-
[34]
2016, , 828, 100
Feng , S., Beuther , H., Zhang , Q., et al. 2016, , 828, 100
2016
-
[35]
B., Rathborne , J
Foster , J. B., Rathborne , J. M., Sanhueza , P., et al. 2013, , 30, e038
2013
-
[36]
2018, , 476, 1445
Galliano , F. 2018, , 476, 1445
2018
-
[37]
2009, , 706, 1036
Galv \'a n-Madrid , R., Keto , E., Zhang , Q., et al. 2009, , 706, 1036
2009
-
[38]
2017, , 603, A33
Giannetti , A., Leurini , S., Wyrowski , F., et al. 2017, , 603, A33
2017
-
[39]
2014, , 570, A65
Giannetti , A., Wyrowski , F., Brand , J., et al. 2014, , 570, A65
2014
-
[40]
2015, , 573, A106
Ginsburg , A., Bally , J., Battersby , C., et al. 2015, , 573, A106
2015
-
[41]
& Mirocha , J
Ginsburg , A. & Mirocha , J. 2011, PySpecKit: Python Spectroscopic Toolkit , Astrophysics Source Code Library
2011
-
[42]
, Schilke , P., et al
G \"u sten , R., Nyman , L. ., Schilke , P., et al. 2006, , 454, L13
2006
-
[43]
Gutermuth , R. A. & Heyer , M. 2015, , 149, 64
2015
-
[44]
2012, , 545, A147
Hennebelle , P. 2012, , 545, A147
2012
-
[45]
W., Gutermuth , R., et al
Heyer , M., Wilson , G. W., Gutermuth , R., et al. 2018, , 473, 2222
2018
-
[46]
Hunter, J. D. 2007, Computing in Science & Engineering, 9, 90
2007
-
[47]
2001, SciPy : Open source scientific tools for Python
Jones, E., Oliphant, T., Peterson, P., et al. 2001, SciPy : Open source scientific tools for Python
2001
-
[48]
2013, , 556, A63
Juvela , M., Montillaud , J., Ysard , N., & Lunttila , T. 2013, , 556, A63
2013
-
[49]
E., Hoare , M
Kalcheva , I. E., Hoare , M. G., Urquhart , J. S., et al. 2018, , 615, A103
2018
-
[50]
& Pillai, T
Kauffmann, J. & Pillai, T. 2010, The Astrophysical Journal Letters, 723, L7
2010
-
[51]
S., Wyrowski , F., Menten , K
Kim , W.-J., Urquhart , J. S., Wyrowski , F., Menten , K. M., & Csengeri , T. 2018, , 616, A107
2018
-
[52]
S., Menten , K
Kim , W.-J., Wyrowski , F., Urquhart , J. S., Menten , K. M., & Csengeri , T. 2017, , 602, A37
2017
-
[53]
S., Csengeri , T., et al
K \"o nig , C., Urquhart , J. S., Csengeri , T., et al. 2017, , 599, A139
2017
-
[54]
Lada , C. J. & Lada , E. A. 2003, Annual Review of Astronomy and Astrophysics, 41, 57
2003
-
[55]
Larson , R. B. 1981, , 194, 809
1981
-
[56]
S., Leurini , S., et al
Li , G.-X., Urquhart , J. S., Leurini , S., et al. 2016, , 591, A5
2016
-
[57]
B., Dale , J
Lin , Y., Liu , H. B., Dale , J. E., et al. 2017, , 840, 22
2017
-
[58]
B., Li , D., et al
Lin , Y., Liu , H. B., Li , D., et al. 2016, , 828, 32
2016
-
[59]
B., Chen , H.-R
Liu , H. B., Chen , H.-R. V., Rom \'a n-Z \'u \ n iga , C. G., et al. 2018, arXiv e-prints, arXiv:1808.07702
2018 arXiv
-
[60]
B., Galv \'a n-Madrid , R., Jim \'e nez-Serra , I., et al
Liu , H. B., Galv \'a n-Madrid , R., Jim \'e nez-Serra , I., et al. 2015, , 804, 37
2015
-
[61]
B., Ho , P
Liu , H. B., Ho , P. T. P., & Zhang , Q. 2010, , 725, 2190
2010
-
[62]
B., Jim \'e nez-Serra , I., Ho , P
Liu , H. B., Jim \'e nez-Serra , I., Ho , P. T. P., et al. 2012 a , , 756, 10
2012
-
[63]
B., Quintana-Lacaci , G., Wang , K., et al
Liu , H. B., Quintana-Lacaci , G., Wang , K., et al. 2012 b , , 745, 61
2012
-
[64]
P., et al
Lo , N., Wiles , B., Redman , M. P., et al. 2015, , 453, 3245
2015
-
[65]
L., Hoare , M
Lumsden , S. L., Hoare , M. G., Urquhart , J. S., et al. 2013, , 208, 11
2013
-
[66]
C., & Barnes , P
Ma , B., Tan , J. C., & Barnes , P. J. 2013, , 779, 79
2013
-
[67]
C., Tafalla , M., et al
Mardones , D., Myers , P. C., Tafalla , M., et al. 1997, , 489, 719
1997
-
[68]
2010, in Proceedings of the 9th Python in Science Conference, ed
McKinney, W. 2010, in Proceedings of the 9th Python in Science Conference, ed. S. van der Walt & J. Millman, 51 -- 56
2010
-
[69]
J., Shirley , Y
Merello , M., Evans , II, N. J., Shirley , Y. L., et al. 2015, , 218, 1
2015
-
[70]
2009, , 501, L1
Minier , V., Andr \'e , P., Bergman , P., et al. 2009, , 501, L1
2009
-
[71]
2008, , 481, 345
Molinari , S., Pezzuto , S., Cesaroni , R., et al. 2008, , 481, 345
2008
-
[72]
2016, , 591, A149
Molinari , S., Schisano , E., Elia , D., et al. 2016, , 591, A149
2016
-
[73]
2010, , 518, L100
Molinari , S., Swinyard , B., Bally , J., et al. 2010, , 518, L100
2010
-
[74]
Moore , T. J. T., Plume , R., Thompson , M. A., et al. 2015, , 453, 4264
2015
-
[75]
2018, , 56, 41
Motte , F., Bontemps , S., & Louvet , F. 2018, , 56, 41
2018
-
[76]
2007, , 476, 1243
Motte , F., Bontemps , S., Schilke , P., et al. 2007, , 476, 1243
2007
-
[77]
2014, , 571, A32
Motte , F., Nguy \^e n Luong , Q., Schneider , N., et al. 2014, , 571, A32
2014
-
[78]
Motte , F., Schilke , P., & Lis , D. C. 2003, , 582, 277
2003
-
[79]
2010, , 518, L77
Motte , F., Zavagno , A., Bontemps , S., et al. 2010, , 518, L77
2010
-
[80]
& Chang , P
Murray , N. & Chang , P. 2015, , 804, 44
2015
-
[81]
Myers , P. C. 2009, , 706, 1341
2009
-
[82]
C., Mardones , D., Tafalla , M., Williams , J
Myers , P. C., Mardones , D., Tafalla , M., Williams , J. P., & Wilner , D. J. 1996, , 465, L133
1996
-
[83]
Naranjo-Romero , R., V \'a zquez-Semadeni , E., & Loughnane , R. M. 2015, , 814, 48
2015
-
[84]
V., et al
Ohashi , S., Sanhueza , P., Chen , H.-R. V., et al. 2016, , 833, 209
2016
-
[85]
Oliphant, T. E. 2006, A guide to NumPy, Vol. 1 (Trelgol Publishing USA)
2006
-
[86]
& Henning , T
Ossenkopf , V. & Henning , T. 1994, , 291, 943
1994
-
[87]
2015, , 453, 3785
Palau , A., Ballesteros-Paredes , J., V \'a zquez-Semadeni , E., et al. 2015, , 453, 3785
2015
-
[88]
M., et al
Palau , A., Fuente , A., Girart , J. M., et al. 2013, , 762, 120
2013
-
[89]
& Fuller , G
Peretto , N. & Fuller , G. A. 2010, , 723, 555
2010
-
[90]
A., Duarte-Cabral , A., et al
Peretto , N., Fuller , G. A., Duarte-Cabral , A., et al. 2013, , 555, A112
2013
-
[91]
S., Mac Low , M.-M., & Banerjee , R
Peters , T., Klessen , R. S., Mac Low , M.-M., & Banerjee , R. 2010, , 725, 134
2010
-
[92]
Planck Collaboration , Abergel , A., Ade , P. A. R., et al. 2011, , 536, A25
2011
-
[93]
E., Henning , T., & Beuther , H
Ragan , S. E., Henning , T., & Beuther , H. 2013, , 559, A79
2013
-
[94]
Rayner , T. S. M., Griffin , M. J., Schneider , N., et al. 2017, , 607, A22
2017
-
[95]
2019, APLpy v2.0: The Astronomical Plotting Library in Python
Robitaille, T. 2019, APLpy v2.0: The Astronomical Plotting Library in Python
2019
-
[96]
W., Pineda , J
Rosolowsky , E. W., Pineda , J. E., Kauffmann , J., & Goodman , A. A. 2008, , 679, 1338
2008
-
[97]
J., Teuben , P
Sault , R. J., Teuben , P. J., & Wright , M. C. H. 1995, in Astronomical Society of the Pacific Conference Series, Vol. 77, Astronomical Data Analysis Software and Systems IV, ed. R. A. Shaw , H. E. Payne , & J. J. E. Hayes , 433
1995
-
[98]
M., Pineau des Forets , G., & Flower , D
Schilke , P., Walmsley , C. M., Pineau des Forets , G., & Flower , D. R. 1997, , 321, 293
1997
-
[99]
2012, in , Vol
Schuller , F. 2012, in , Vol. 8452, Millimeter, Submillimeter, and Far-Infrared Detectors and Instrumentation for Astronomy VI, 84521T
2012
-
[100]
M., Contreras , Y., et al
Schuller , F., Menten , K. M., Contreras , Y., et al. 2009, , 504, 415
2009
-
[101]
2010, The Messenger, 139, 20
Siringo , G., Kreysa , E., De Breuck , C., et al. 2010, The Messenger, 139, 20
2010
-
[102]
2009, , 497, 945
Siringo , G., Kreysa , E., Kov \'a cs , A., et al. 2009, , 497, 945
2009
-
[103]
J., Shetty , R., Beuther , H., Klessen , R
Smith , R. J., Shetty , R., Beuther , H., Klessen , R. S., & Bonnell , I. A. 2013, , 771, 24
2013
-
[104]
& Silk , J
Spaans , M. & Silk , J. 2000, , 538, 115
2000
-
[105]
W., Palla , F., & Ho , P
Stahler , S. W., Palla , F., & Ho , P. T. P. 2000, Protostars and Planets IV, 327
2000
-
[106]
& Guesten , R
Stutzki , J. & Guesten , R. 1990, , 356, 513
1990
-
[107]
E., Shirley , Y
Svoboda , B. E., Shirley , Y. L., Battersby , C., et al. 2016, , 822, 59
2016
-
[108]
C., Beltr \'a n , M
Tan , J. C., Beltr \'a n , M. T., Caselli , P., et al. 2014, Protostars and Planets VI, 149
2014
-
[109]
Tanaka , K. E. I., Tan , J. C., & Zhang , Y. 2017, , 835, 32
2017
-
[110]
S., K \"o nig , C., Giannetti , A., et al
Urquhart , J. S., K \"o nig , C., Giannetti , A., et al. 2018, , 473, 1059
2018
-
[111]
S., Moore , T
Urquhart , J. S., Moore , T. J. T., Csengeri , T., et al. 2014, , 443, 1555
2014
-
[112]
S., Thompson, M
Urquhart, J. S., Thompson, M. A., Moore, T. J. T., et al. 2013, Monthly Notices of the Royal Astronomical Society, 435, 400
2013
-
[113]
L., Nunez-Iglesias , J., et al
van der Walt, S., S ch\"onberger, J. L., Nunez-Iglesias , J., et al. 2014, PeerJ, 2, e453
2014
-
[114]
2017, , 467, 1313
V \'a zquez-Semadeni , E., Gonz \'a lez-Samaniego , A., & Col \' n , P. 2017, , 467, 1313
2017
-
[115]
C., & Zamora-Avil \'e s , M
V \'a zquez-Semadeni , E., Palau , A., Ballesteros-Paredes , J., G \'o mez , G. C., & Zamora-Avil \'e s , M. 2019, arXiv e-prints, arXiv:1903.11247
2019 arXiv
-
[116]
2014, , 439, 3275
Wang , K., Zhang , Q., Testi , L., et al. 2014, , 439, 3275
2014
-
[117]
2011, , 735, 64
Wang , K., Zhang , Q., Wu , Y., & Zhang , H. 2011, , 735, 64
2011
-
[118]
2010, , 709, 27
Wang , P., Li , Z.-Y., Abel , T., & Nakamura , F. 2010, , 709, 27
2010
-
[119]
& Kroupa , P
Weidner , C. & Kroupa , P. 2006, , 365, 1333
2006
-
[120]
2013, , 434, 84
Weidner , C., Kroupa , P., & Pflamm-Altenburg , J. 2013, , 434, 84
2013
-
[121]
2012, , 544, A146
Wienen , M., Wyrowski , F., Schuller , F., et al. 2012, , 544, A146
2012
-
[122]
P., Blitz , L., & McKee , C
Williams , J. P., Blitz , L., & McKee , C. F. 2000, Protostars and Planets IV, 97
2000
-
[123]
Wood , D. O. S. & Churchwell , E. 1989, , 340, 265
1989
-
[124]
& Evans , II, N
Wu , J. & Evans , II, N. J. 2003, , 592, L79
2003
-
[125]
2013, , 559, A133
Ysard , N., Abergel , A., Ristorcelli , I., et al. 2013, , 559, A133
2013
-
[126]
2009, , 696, 268
Zhang , Q., Wang , Y., Pillai , T., & Rathborne , J. 2009, , 696, 268
2009
-
[127]
E., Ginsburg, A
Aguirre, J. E., Ginsburg, A. G., Dunham, M. K., et al.\ 2011, , 192, 4
2011
-
[128]
Andre, P., Ward-Thompson, D., & Barsony, M.\ 2000, Protostars and Planets IV, 59
2000
-
[129]
Andr \'e , P., Men'shchikov, A., Bontemps, S., et al.\ 2010, , 518, L102
2010
-
[130]
Andr \'e , P., Di Francesco, J., Ward-Thompson, D., et al.\ 2014, Protostars and Planets VI, 27
2014
-
[131]
Andre, P., & Montmerle, T.\ 1994, , 420, 837
1994
-
[132]
Bontemps, S., Motte, F., Csengeri, T., & Schneider, N.\ 2010, , 524, A18
2010
-
[133]
R., & Bodenheimer, P.\ 1997, , 289, 497
Burkert, A., Bate, M. R., & Bodenheimer, P.\ 1997, , 289, 497
1997
-
[134]
J., & Tan, J
Butler, M. J., & Tan, J. C.\ 2012, , 754, 5
2012
-
[135]
F., Harvey, P
Campbell, M. F., Harvey, P. M., Lester, D. F., & Clark, D. M.\ 2004, , 600, 254
2004
-
[136]
J., Noriega-Crespo, A., Mizuno, D
Carey, S. J., Noriega-Crespo, A., Mizuno, D. R., et al.\ 2009, , 121, 76
2009
-
[137]
Wood, D. O. S., & Churchwell, E.\ 1989, , 340, 265
1989
-
[138]
Compi \`e gne, M., Verstraete, L., Jones, A., et al.\ 2011, , 525, A103
2011
-
[139]
S., et al.\ 2013, , 549, A45
Contreras, Y., Schuller, F., Urquhart, J. S., et al.\ 2013, , 549, A45
2013
-
[140]
S., Schuller, F., et al.\ 2014, , 565, A75
Csengeri, T., Urquhart, J. S., Schuller, F., et al.\ 2014, , 565, A75
2014
-
[141]
Csengeri, T., Weiss, A., Wyrowski, F., et al.\ 2016, , 585, A104
2016
-
[142]
Csengeri, T., Bontemps, S., Wyrowski, F., et al.\ 2017, , 601, A60
2017
-
[143]
Csengeri, T., Bontemps, S., Wyrowski, F., et al.\ 2017, , 600, L10
2017
-
[144]
Csengeri, T., Bontemps, S., Wyrowski, F., et al.\ 2018, arXiv:1804.06482
2018 arXiv
-
[145]
M., Wright, E
Cutri, R. M., Wright, E. L., Conrow, T., et al.\ 2012, Explanatory Supplement to the WISE All-Sky Data Release Products
2012
-
[146]
M., Crapsi, A., Evans, N
Dunham, M. M., Crapsi, A., Evans, N. J., II, et al.\ 2008, , 179, 249-282
2008
-
[147]
J., Moore, T
Eden, D. J., Moore, T. J. T., Plume, R., et al.\ 2017, , 469, 2163
2017
-
[148]
Elia, D., Molinari, S., Schisano, E., et al.\ 2017, , 471, 100
2017
-
[149]
M., Krumholz, M
Fall, S. M., Krumholz, M. R., & Matzner, C. D.\ 2010, , 710, L142
2010
-
[150]
S., & Schmidt, W.\ 2008, , 688, L79
Federrath, C., Klessen, R. S., & Schmidt, W.\ 2008, , 688, L79
2008
-
[151]
J., Megeath, S
Fischer, W. J., Megeath, S. T., Furlan, E., et al.\ 2017, , 840, 69
2017
-
[152]
Ginsburg, A., Bally, J., Battersby, C., et al.\ 2015, , 573, A106
2015
-
[153]
J., Abergel, A., Abreu, A., et al.\ 2010, , 518, L3
Griffin, M. J., Abergel, A., Abreu, A., et al.\ 2010, , 518, L3
2010
-
[154]
S.\ 2011, , 413, 2741
Girichidis, P., Federrath, C., Banerjee, R., & Klessen, R. S.\ 2011, , 413, 2741
2011
-
[155]
A., & Heyer, M.\ 2015, , 149, 64
Gutermuth, R. A., & Heyer, M.\ 2015, , 149, 64
2015
-
[156]
Hennebelle, P.\ 2012, , 545, A147
2012
-
[157]
W., Gutermuth, R., et al.\ 2018, , 473, 2222
Heyer, M., Wilson, G. W., Gutermuth, R., et al.\ 2018, , 473, 2222
2018
-
[158]
M., Stanke, T., et al.\ 2017, , 600, A141
Kainulainen, J., Stutz, A. M., Stanke, T., et al.\ 2017, , 600, A141
2017
-
[159]
D., Moriarty-Schieven, G., et al.\ 2000, , 545, 327
Johnstone, D., Wilson, C. D., Moriarty-Schieven, G., et al.\ 2000, , 545, 327
2000
-
[160]
Kauffmann, J., & Pillai, T.\ 2010, , 723, L7
2010
-
[161]
C., & Goodman, A
Kauffmann, J., Pillai, T., Shetty, R., Myers, P. C., & Goodman, A. A.\ 2010, , 712, 1137
2010
-
[162]
M., Di Francesco, J., et al.\ 2017, , 838, 114
Kirk, H., Dunham, M. M., Di Francesco, J., et al.\ 2017, , 838, 114
2017
-
[163]
S., Csengeri, T., et al.\ 2017, , 599, A139
K \"o nig, C., Urquhart, J. S., Csengeri, T., et al.\ 2017, , 599, A139
2017
-
[164]
J., & Lada, E
Lada, C. J., & Lada, E. A.\ 2003, , 41, 57
2003
-
[165]
Lee, Y.-N., & Hennebelle, P.\ 2016, , 591, A31
2016
-
[166]
C.\ 2014, , 780, L29
Lim, W., & Tan, J. C.\ 2014, , 780, L29
2014
-
[167]
B., Li, D., et al.\ 2016, , 828, 32
Lin, Y., Liu, H. B., Li, D., et al.\ 2016, , 828, 32
2016
-
[168]
B., Ho, P
Liu, H. B., Ho, P. T. P., & Zhang, Q.\ 2010, , 725, 2190
2010
-
[169]
P., et al.\ 2015, , 453, 3245
Lo, N., Wiles, B., Redman, M. P., et al.\ 2015, , 453, 3245
2015
-
[170]
C., & Barnes, P
Ma, B., Tan, J. C., & Barnes, P. J.\ 2013, , 779, 79
2013
-
[171]
C., Lunttila, T., & Padoan, P.\ 2011, , 530, A101
Malinen, J., Juvela, M., Collins, D. C., Lunttila, T., & Padoan, P.\ 2011, , 530, A101
2011
-
[172]
F., & Tan, J
McKee, C. F., & Tan, J. C.\ 2003, , 585, 850
2003
-
[173]
E., & Pudritz, R
McLaughlin, D. E., & Pudritz, R. E.\ 1997, , 476, 750
1997
-
[174]
J., II, Shirley, Y
Merello, M., Evans, N. J., II, Shirley, Y. L., et al.\ 2015, , 218, 1
2015
-
[175]
Molinari, S., Pezzuto, S., Cesaroni, R., et al.\ 2008, , 481, 345
2008
-
[176]
Molinari, S., Swinyard, B., Bally, J., et al.\ 2010, , 518, L100
2010
-
[177]
Molinari, S., Schisano, E., Elia, D., et al.\ 2016, , 591, A149
2016
-
[178]
Motte, F., Bontemps, S., Schilke, P., et al.\ 2007, , 476, 1243
2007
-
[179]
Motte, F., Nguy \^e n Luong, Q., Schneider, N., et al.\ 2014, , 571, A32
2014
-
[180]
Motte, F., Bontemps, S., & Louvet, F.\ 2017, arXiv:1706.00118
2017 arXiv
-
[181]
R., Hoare, M
Purcell, C. R., Hoare, M. G., Cotton, W. D., et al.\ 2013, , 205, 1
2013
-
[182]
Schuller, F.\ 2012, , 8452, 84521T
2012
-
[183]
A., & Ercolano, B.\ 2009, , 696, 2234
Shetty, R., Kauffmann, J., Schnee, S., Goodman, A. A., & Ercolano, B.\ 2009, , 696, 2234
2009
-
[184]
Siringo, G., Kreysa, E., De Breuck, C., et al.\ 2010, The Messenger, 139, 20
2010
-
[185]
Stutzki, J., & Guesten, R.\ 1990, , 356, 513
1990
-
[186]
V., et al.\ 2016, , 833, 209
Ohashi, S., Sanhueza, P., Chen, H.-R. V., et al.\ 2016, , 833, 209
2016
-
[187]
M., et al.\ 2013, , 762, 120
Palau, A., Fuente, A., Girart, J. M., et al.\ 2013, , 762, 120
2013
-
[188]
M., et al.\ 2014, , 785, 42
Palau, A., Estalella, R., Girart, J. M., et al.\ 2014, , 785, 42
2014
-
[189]
Planck Collaboration, Abergel, A., Ade, P. A. R., et al.\ 2011, , 536, A25
2011
-
[190]
Ragan, S., Henning, T., Krause, O., et al.\ 2012, , 547, A49
2012
-
[191]
Schaller, G., Schaerer, D., Meynet, G., & Maeder, A.\ 1992, , 96, 269
1992
-
[192]
M., Contreras, Y., et al.\ 2009, , 504, 415
Schuller, F., Menten, K. M., Contreras, Y., et al.\ 2009, , 504, 415
2009
-
[193]
W., Palla, F., & Ho, P
Stahler, S. W., Palla, F., & Ho, P. T. P.\ 2000, Protostars and Planets IV, 327
2000
-
[194]
W., Shu, F
Stahler, S. W., Shu, F. H., & Taam, R. E.\ 1980, , 241, 637
1980
-
[195]
Toci, C., Galli, D., Verdini, A., Del Zanna, L., & Landi, S.\ 2018, , 474, 1288
2018
-
[196]
S., Moore, T
Urquhart, J. S., Moore, T. J. T., Csengeri, T., et al.\ 2014, , 443, 1555
2014
-
[197]
S., K \"o nig, C., Giannetti, A., et al.\ 2018, , 473, 1059
Urquhart, J. S., K \"o nig, C., Giannetti, A., et al.\ 2018, , 473, 1059
2018
-
[198]
, K., Zhang, Q., Wu, Y., & Zhang, H.\ 2011, , 735, 64
2011
-
[199]
N.,& Stewart, J
Cox, A. N.,& Stewart, J. N. 1969,
1969
-
[200]
Tscharnuter W. M. 1987,
1987
-
[201]
1992, in ASP Conf
Terlevich, R. 1992, in ASP Conf. Ser. 31,
1992
-
[202]
/appendix1_sm/
Zheng, W., Davidsen, A. F., Tytler, D. & Kriss, G. A. appendix SABOCA maps app:sab_maps_all python import os directory = r"./appendix1_sm/" extension = ".pdf" files = [file for file in os.listdir(directory) if file.lower().endswith(extension)] for i, file in enumerate(files[::...
Reviewed August 14, 2026 · model on record in the stance chip above.
Discussion (0). Continue with ORCID to comment.