Mass ratio estimates for overcontact binaries using the derivatives of light curves
Pith reviewed 2026-05-24 05:44 UTC · model grok-4.3
The pith
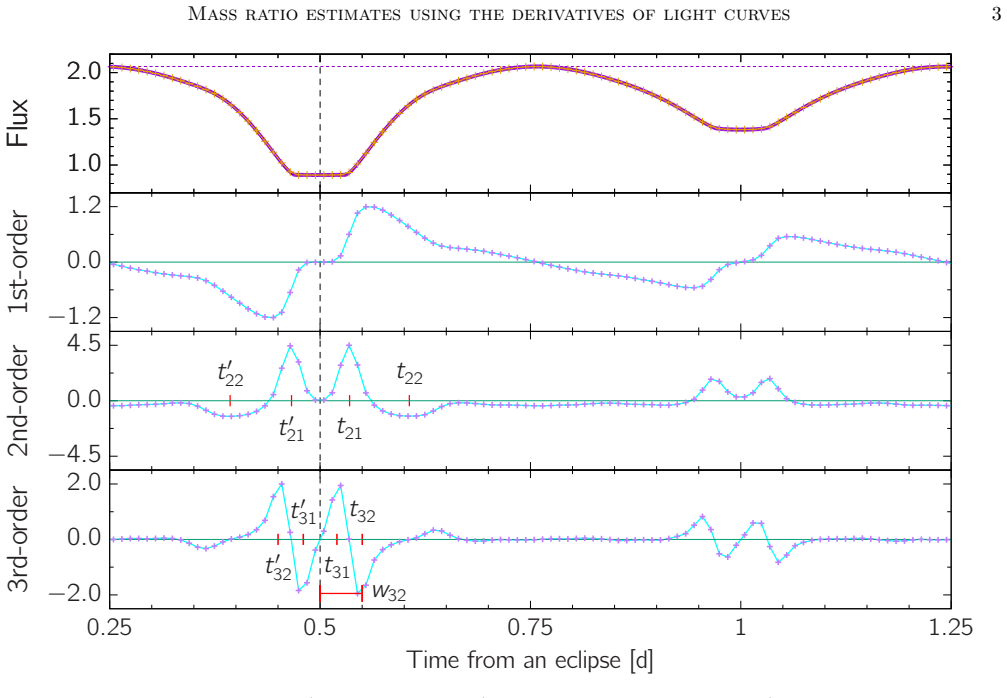
Photometric mass ratios of overcontact binaries are estimated directly from the time interval between extrema in the third derivative of the light curve.
A machine-rendered reading of the paper's core claim, the machinery that carries it, and where it could break.
Core claim
The photometric mass ratio of an overcontact binary is encoded in the time interval between two local extrema in the third derivative of its light curve, allowing a direct estimation with associated uncertainty that does not require iterative procedures or additional parameters.
What carries the argument
The time interval between two local extrema in the third derivative of the light curve, which carries the information about the mass ratio.
If this is right
- Mass ratios can be estimated quickly for many overcontact binaries detected in photometric surveys.
- The estimates come with uncertainty values that allow direct comparison to spectroscopic results.
- No iterative procedure is needed, simplifying analysis for large numbers of individual systems.
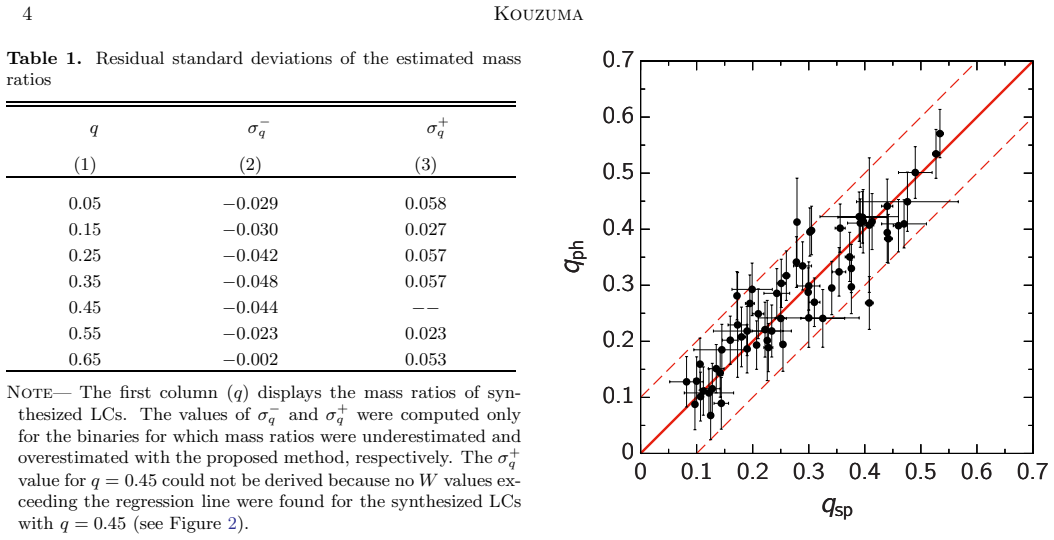
- The method shows agreement with independent spectroscopic determinations within uncertainties for most tested cases.
Where Pith is reading between the lines
- The approach could supply initial mass ratio values for thousands of systems in future survey catalogs.
- If the third-derivative feature proves robust across datasets, it might aid in preliminary classification of binary types.
- Testing the interval measurement on synthetic light curves with known mass ratios would provide an independent check on accuracy.
Load-bearing premise
The time interval between two local extrema in the third derivative of the light curve alone encodes the photometric mass ratio for overcontact binaries with sufficient accuracy and without requiring iterative modeling or additional parameters.
What would settle it
A large sample where estimated mass ratios deviate from spectroscopic values by more than the stated uncertainties in substantially more than one-third of cases.
Figures


read the original abstract
The photometric mass ratios of eclipsing binaries are usually estimated by light-curve modeling with an iterative method. We propose a new method for estimating the photometric mass ratio of an overcontact binary using the derivatives of a light curve, which provides a reasonable uncertainty value. The method mainly requires only the time interval value between two local extrema found in the third derivative of a light curve, with no need of an iterative procedure. We applied the method to a sample of real overcontact binary data and compared the estimated mass ratios with their spectroscopically determined values. The comparison showed that our estimated mass ratios for $\sim $67% of the samples agreed with their spectroscopic mass ratios within the estimated uncertainties, and the errors for 95% of them are within $\pm 0.1$. Our method should be useful for estimating mass ratios for numerous overcontact eclipsing binaries found with existing and future surveys, as well as for the light-curve analysis of each system.
Editorial analysis
A structured set of objections, weighed in public.
Referee Report
Summary. The paper proposes a derivative-based method to estimate photometric mass ratios of overcontact binaries from the time interval between local extrema in the third derivative of the light curve. This non-iterative approach is applied to real systems and compared to spectroscopic mass ratios, reporting agreement within uncertainties for ~67% of the sample and errors within ±0.1 for 95%.
Significance. If the time-interval measure proves independent of other parameters, the method could enable rapid mass-ratio estimates for large photometric surveys without full light-curve modeling. The empirical comparison provides initial support, but the absence of controlled tests limits claims of broad applicability.
major comments (2)
- [Abstract] Abstract: the headline agreement rates (67% within uncertainties; 95% within ±0.1) rest on the untested premise that the measured time interval between third-derivative extrema is a function of q alone. No synthetic-light-curve experiments are described in which q is fixed while inclination, temperature ratio, and fill-out factor are varied across plausible ranges.
- [Abstract] Abstract: the manuscript provides no derivation of the mass-ratio relation from the third-derivative interval, no error-propagation steps, and no discussion of selection effects or how the empirical mapping was constructed from the sample.
minor comments (1)
- The abstract would be clearer if it stated the sample size used for the spectroscopic comparison.
Simulated Author's Rebuttal
We thank the referee for the detailed review and constructive suggestions. We address each major comment below and will revise the manuscript accordingly to strengthen the validation and documentation of the method.
read point-by-point responses
-
Referee: [Abstract] Abstract: the headline agreement rates (67% within uncertainties; 95% within ±0.1) rest on the untested premise that the measured time interval between third-derivative extrema is a function of q alone. No synthetic-light-curve experiments are described in which q is fixed while inclination, temperature ratio, and fill-out factor are varied across plausible ranges.
Authors: We agree that the current validation is limited to empirical comparisons with real systems and does not include controlled synthetic tests. In revision we will add a dedicated section presenting synthetic light-curve experiments in which q is held fixed while inclination, temperature ratio, and fill-out factor are varied over representative ranges. These tests will quantify the sensitivity of the third-derivative interval to parameters other than q and will be used to refine the reported uncertainties. revision: yes
-
Referee: [Abstract] Abstract: the manuscript provides no derivation of the mass-ratio relation from the third-derivative interval, no error-propagation steps, and no discussion of selection effects or how the empirical mapping was constructed from the sample.
Authors: The mass-ratio relation is constructed empirically by correlating the measured time intervals with spectroscopically determined q values from the sample. We will expand the methods and discussion sections to (i) detail the fitting procedure used to obtain the empirical mapping, (ii) provide the explicit error-propagation steps from the measured time interval to the estimated q, and (iii) discuss sample selection effects and their possible influence on the reported agreement statistics. A first-principles analytic derivation is not available; the method remains data-driven, but we will add a brief physical motivation based on the morphology of overcontact light curves. revision: partial
Circularity Check
No circularity; photometric estimator validated against independent spectroscopic mass ratios
full rationale
The paper defines a photometric estimator from the time interval between third-derivative extrema and directly compares the resulting q values to spectroscopically determined mass ratios on the same objects. Spectroscopic q is an external observable independent of the light-curve derivatives. No equation or procedure is shown to be defined in terms of its own output, no fitted mapping is relabeled as a first-principles prediction, and no self-citation chain is required to close the argument. The reported agreement statistics therefore constitute an external check rather than a tautology.
Axiom & Free-Parameter Ledger
Lean theorems connected to this paper
-
IndisputableMonolith/Cost/FunctionalEquation.leanwashburn_uniqueness_aczel unclear?
unclearRelation between the paper passage and the cited Recognition theorem.
We propose a new method for estimating the photometric mass ratio of an overcontact binary using the derivatives of a light curve... the time interval value between two local extrema found in the third derivative of a light curve
-
IndisputableMonolith/Foundation/RealityFromDistinction.leanreality_from_one_distinction unclear?
unclearRelation between the paper passage and the cited Recognition theorem.
A regression analysis for the correlation yielded q = 0.056W − 0.261
What do these tags mean?
- matches
- The paper's claim is directly supported by a theorem in the formal canon.
- supports
- The theorem supports part of the paper's argument, but the paper may add assumptions or extra steps.
- extends
- The paper goes beyond the formal theorem; the theorem is a base layer rather than the whole result.
- uses
- The paper appears to rely on the theorem as machinery.
- contradicts
- The paper's claim conflicts with a theorem or certificate in the canon.
- unclear
- Pith found a possible connection, but the passage is too broad, indirect, or ambiguous to say the theorem truly supports the claim.
Reference graph
Works this paper leans on
-
[1]
1970, Vistas in Astronomy, 12, 217, 10.1016/0083-6656(70)90041-3
Binnendijk , L. 1970, Vistas in Astronomy, 12, 217, 10.1016/0083-6656(70)90041-3
-
[2]
E., Kochoska, A., Hey, D., et al
Conroy , K. E., Kochoska , A., Hey , D., et al. 2020, , 250, 34, 10.3847/1538-4365/abb4e2
- [3]
-
[4]
2021, , 254, 10, 10.3847/1538-4365/abeb23
Latkovi \'c , O., C eki , A., & Lazarevi \'c , S. 2021, , 254, 10, 10.3847/1538-4365/abeb23
-
[5]
Lightkurve Collaboration , Cardoso , J. V. d. M., Hedges , C., et al. 2018, Lightkurve: Kepler and TESS time series analysis in Python , Astrophysics Source Code Library. 1812.013
work page 2018
-
[6]
Lucy , L. B. 1968, , 153, 877, 10.1086/149712
-
[7]
1992, , 394, 592, 10.1086/171611
Mazeh , T., & Goldberg , D. 1992, , 394, 592, 10.1086/171611
- [8]
-
[9]
Pribulla , T., Kreiner , J. M., & Tremko , J. 2003, Contributions of the Astronomical Observatory Skalnate Pleso, 33, 38
work page 2003
-
[10]
Rucinski , S. M. 2001, , 122, 1007, 10.1086/321153
-
[11]
2022, Galaxies, 10, 8, 10.3390/galaxies10010008
Terrell , D. 2022, Galaxies, 10, 8, 10.3390/galaxies10010008
-
[12]
Terrell , D., & Wilson , R. E. 2005, , 296, 221, 10.1007/s10509-005-4449-4
-
[13]
1990, , 242, 79, 10.1093/mnras/242.1.79
Trimble , V. 1990, , 242, 79, 10.1093/mnras/242.1.79
-
[14]
Wilson , R. E. 1994, , 106, 921, 10.1086/133464
discussion (0)
Sign in with ORCID, Apple, or X to comment. Anyone can read and Pith papers without signing in.