A Large-Scale Neutral Comparison Study of Survival Models on Low-Dimensional Data
Pith reviewed 2026-05-24 00:14 UTC · model grok-4.3
The pith
No survival model significantly outperforms the Cox proportional hazards model on low-dimensional right-censored data.
A machine-rendered reading of the paper's core claim, the machinery that carries it, and where it could break.
Core claim
In this neutral comparison on single-event right-censored low-dimensional data, no method significantly outperforms the Cox proportional hazards model for either tuning measure; therefore the Cox model remains a simple and robust choice sufficient for most practitioners.
What carries the argument
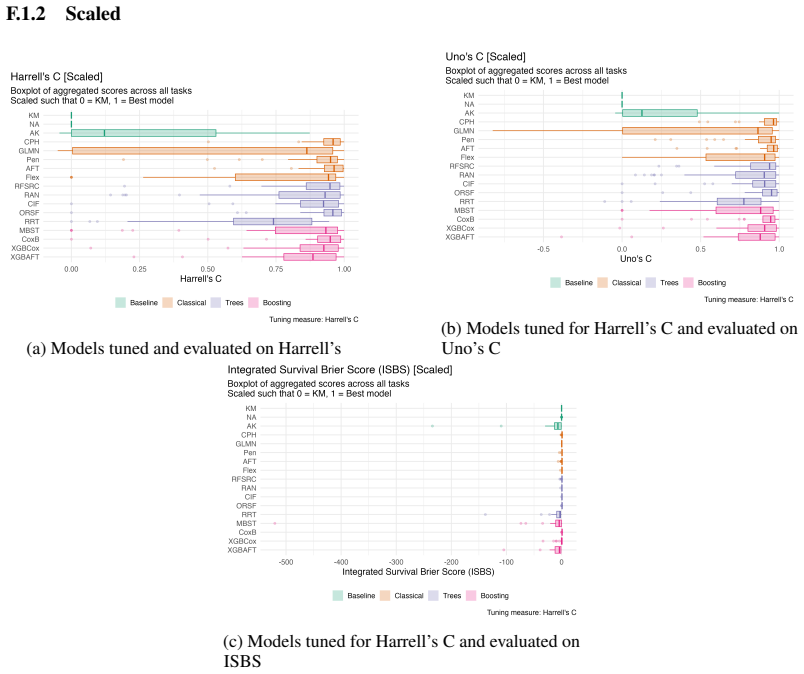
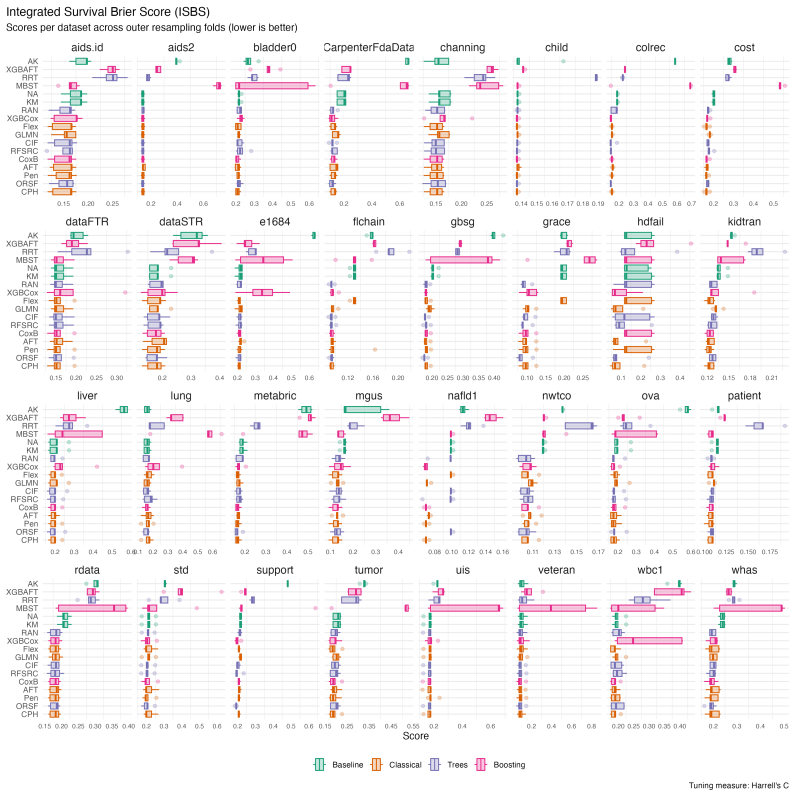
Large-scale benchmark that tunes and evaluates 19 models across 34 datasets using C-index and Integrated Survival Brier Score tuning plus six downstream metrics.
If this is right
- Oblique random survival forests and likelihood-based boosting achieve the best average ranks for overall predictive performance.
- Boosting, tree-based methods, and parametric models rank highest on discrimination.
- The Cox model is sufficient for predictive tasks in the standard low-dimensional right-censored setting.
- Results support using the Cox model as a default unless domain-specific evidence shows otherwise.
Where Pith is reading between the lines
- The conclusion may not extend to high-dimensional, competing-risks, or time-varying covariate settings.
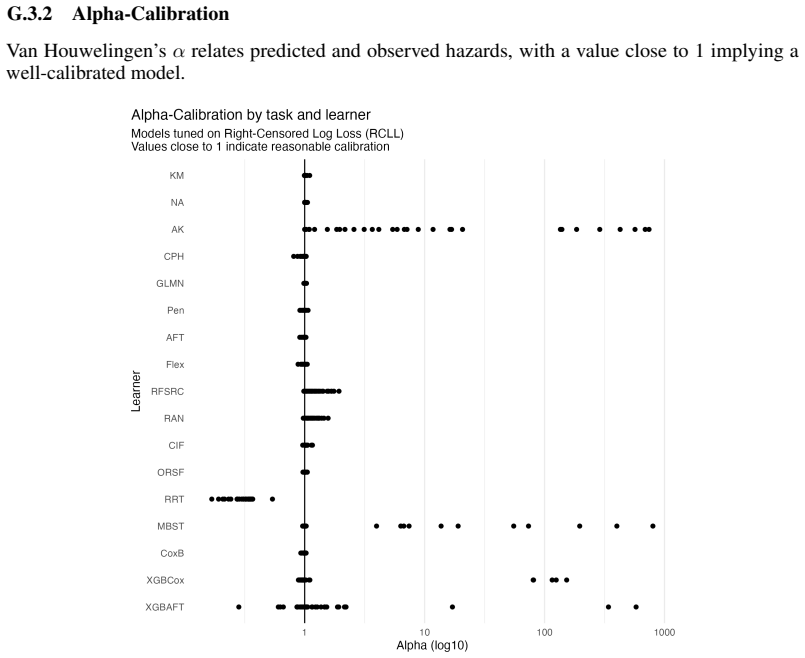
- Different calibration or time-dependent metrics could alter the ranking of methods.
- The benchmark supplies a reusable reference set for testing future survival models under the same protocol.
Load-bearing premise
The 34 chosen datasets together with the selected tuning and evaluation protocol form a representative sample of typical low-dimensional right-censored survival problems.
What would settle it
A new collection of low-dimensional right-censored datasets or an alternative metric set on which at least one non-Cox model shows statistically significant improvement after identical tuning.
Figures


read the original abstract
This work presents the first large-scale neutral benchmark experiment focused on single-event, right-censored, low-dimensional survival data. Benchmark experiments are essential in methodological research to scientifically compare new and existing model classes through proper empirical evaluation. Existing benchmarks in the survival literature are smaller in scale regarding the number of used datasets and extent of empirical evaluation. They often lack appropriate tuning or evaluation procedures, while other comparison studies focus on qualitative reviews rather than quantitative comparisons. This comprehensive study aims to fill the gap by neutrally evaluating a broad range of methods and providing generalizable guidelines for practitioners. We benchmark 19 models, ranging from classical statistical approaches to many common machine learning methods, on 34 publicly available datasets. The benchmark tunes models using both a discrimination measure (Harrell's C-index) and a scoring rule (Integrated Survival Brier Score), and evaluates them across six metrics covering discrimination, calibration, and overall predictive performance. Despite superior average ranks in overall predictive performance from individual learners like oblique random survival forests and likelihood-based boosting, and better discrimination rankings from multiple boosting- and tree-based methods as well as parametric survival models, no method significantly outperforms the commonly used Cox proportional hazards model for either tuning measure. We conclude that for predictive purposes in the standard survival analysis setting of low-dimensional, right-censored data, the Cox Proportional Hazards model remains a simple and robust method, sufficient for most practitioners. All code, data, and results are publicly available on GitHub https://github.com/slds-lmu/paper_2023_survival_benchmark
Editorial analysis
A structured set of objections, weighed in public.
Referee Report
Summary. The paper presents the first large-scale neutral benchmark of 19 survival models (classical statistical to ML) on 34 publicly available low-dimensional, right-censored, single-event datasets. Models are tuned separately using Harrell's C-index and Integrated Survival Brier Score, then evaluated on six metrics spanning discrimination, calibration, and overall performance. The central empirical result is that, despite some methods showing better average ranks, no method significantly outperforms the Cox proportional hazards model under either tuning protocol. The authors conclude that Cox PH remains a simple, robust, and sufficient choice for most practitioners in this setting. All code, data, and results are released publicly on GitHub.
Significance. If the central null result generalizes, the study supplies a valuable, large-scale empirical anchor for the survival-analysis literature: it indicates that, in the standard low-dimensional right-censored regime, gains from more complex learners are not statistically detectable under proper tuning and multiple metrics. The explicit public release of code, data, and full results is a clear strength that supports reproducibility and secondary analyses.
major comments (3)
- [Abstract / dataset section] Abstract and dataset description: the claim that results support the broad conclusion that 'Cox PH remains ... sufficient for most practitioners' is load-bearing on the assumption that the 34 datasets constitute a representative sample of low-dimensional right-censored problems. The manuscript provides no sampling frame, inclusion/exclusion criteria, or analysis of selection effects (e.g., publication bias toward datasets where linear PH models already perform well), nor does it report the empirical distribution of censoring rates, event frequencies, or covariate correlations across the collection.
- [Results / statistical analysis] Results section (statistical testing): the statement that 'no method significantly outperforms' the Cox model requires explicit description of the paired statistical test, the exact significance threshold, and any correction for multiple comparisons across 19 models and 6 metrics. Without these details the reported lack of significance cannot be verified and directly affects the central claim.
- [Methods / evaluation protocol] Evaluation protocol: the paper tunes on C-index or ISBS and evaluates on six metrics, yet does not report sensitivity of the ranking conclusions to the choice of tuning measure or to the handling of ties and censoring in the C-index. Because the null result is asserted for 'either tuning measure,' this omission is material to the robustness of the headline finding.
minor comments (1)
- [Abstract] The GitHub repository link is given but the manuscript does not state the exact commit or tag corresponding to the results reported in the paper.
Simulated Author's Rebuttal
We thank the referee for the constructive comments, which help clarify the scope and robustness of our benchmark. We address each major point below and indicate where revisions will be made.
read point-by-point responses
-
Referee: [Abstract / dataset section] Abstract and dataset description: the claim that results support the broad conclusion that 'Cox PH remains ... sufficient for most practitioners' is load-bearing on the assumption that the 34 datasets constitute a representative sample of low-dimensional right-censored problems. The manuscript provides no sampling frame, inclusion/exclusion criteria, or analysis of selection effects (e.g., publication bias toward datasets where linear PH models already perform well), nor does it report the empirical distribution of censoring rates, event frequencies, or covariate correlations across the collection.
Authors: We agree that a more explicit description of dataset selection strengthens the interpretation. The 34 datasets comprise all publicly available low-dimensional (p typically < 50), right-censored, single-event survival datasets meeting minimum size and completeness criteria that we could locate from standard repositories (UCI, OpenML, R packages, and published studies). We will add a dedicated subsection detailing the exact inclusion/exclusion criteria, a table or figure summarizing the empirical distributions of censoring rates, event frequencies, and pairwise covariate correlations, and a brief discussion of potential selection effects. This addition will better qualify the scope of our conclusions without altering the central empirical findings. revision: yes
-
Referee: [Results / statistical analysis] Results section (statistical testing): the statement that 'no method significantly outperforms' the Cox model requires explicit description of the paired statistical test, the exact significance threshold, and any correction for multiple comparisons across 19 models and 6 metrics. Without these details the reported lack of significance cannot be verified and directly affects the central claim.
Authors: The methods section already specifies the use of paired Wilcoxon signed-rank tests on per-dataset metric differences with a nominal threshold of 0.05; no multiplicity correction was applied because the primary interest is the direct comparison against Cox rather than an exhaustive ranking. However, we acknowledge that these details are not restated in the results narrative. We will insert a concise paragraph in the results section that repeats the test procedure, threshold, and rationale for the correction choice, along with a note that all pairwise p-values versus Cox remain above 0.05 under both tuning regimes. revision: yes
-
Referee: [Methods / evaluation protocol] Evaluation protocol: the paper tunes on C-index or ISBS and evaluates on six metrics, yet does not report sensitivity of the ranking conclusions to the choice of tuning measure or to the handling of ties and censoring in the C-index. Because the null result is asserted for 'either tuning measure,' this omission is material to the robustness of the headline finding.
Authors: The headline null result is already shown to hold under both tuning protocols separately. We will add a short sensitivity paragraph (or supplementary table) confirming that the ranking order versus Cox is stable when the C-index is replaced by its tie-adjusted variant and when censoring is handled via the standard inverse-probability weighting in the Brier score. A exhaustive grid of every possible tie/censoring variant is beyond the scope of the current study, but the two primary tuning measures already bracket the main practical choices. revision: partial
Circularity Check
No circularity: purely empirical benchmark with no derivations or self-referential fits
full rationale
This is an empirical benchmark study that directly evaluates 19 survival models on 34 public datasets using standard tuning (C-index, ISBS) and six evaluation metrics. No derivation chain, first-principles result, or prediction exists that could reduce to the paper's own inputs by construction. No self-definitional steps, fitted inputs renamed as predictions, or load-bearing self-citations are present; conclusions follow from observed performance ranks and significance tests on external data. The representativeness concern raised by the skeptic is a generalizability issue, not circularity under the enumerated patterns.
Axiom & Free-Parameter Ledger
axioms (2)
- domain assumption The 34 publicly available datasets are representative of typical low-dimensional, single-event, right-censored survival problems.
- domain assumption The dual tuning (C-index and ISBS) plus six-metric evaluation protocol provides an unbiased comparison across model classes.
Reference graph
Works this paper leans on
-
[1]
Nonparametric Inference for a Family of Counting Processes
Odd Aalen. “Nonparametric Inference for a Family of Counting Processes”. In: The Annals of Statistics 6.4 (1978), pp. 701–726
work page 1978
-
[2]
Nearest Neighbor Estimation of a Bivariate Distribution Under Random Censoring
Michael G Akritas. “Nearest Neighbor Estimation of a Bivariate Distribution Under Random Censoring”. en. In: Ann. Statist. 22.3 (1994), pp. 1299–1327. ISSN : 0090-5364. DOI: 10. 1214 / aos / 1176325630. URL: https : / / projecteuclid . org : 443 / euclid . aos / 1176325630
work page 1994
-
[3]
Alina M Allen et al. “Nonalcoholic fatty liver disease incidence and impact on metabolic burden and death: A 20 year-community study.” eng. In:Hepatology (Baltimore, Md.) 67.5 (Apr. 2018), pp. 1726–1736. ISSN : 1527-3350 (Electronic). DOI: 10.1002/hep.29546
-
[4]
Per Kragh Andersen et al. “Introduction”. In:Statistical Models Based on Counting Processes. Springer Series in Statistics. New York, NY: Springer US, 1993, pp. 1–44. DOI: https: //doi.org/10.1007/978-1-4612-4348-9
-
[5]
Peter C. Austin, Frank E. Harrell Jr, and David van Klaveren. “Graphical Calibration Curves and the Integrated Calibration Index (ICI) for Survival Models”. In:Statistics in Medicine 39.21 (2020), pp. 2714–2742. ISSN : 1097-0258. DOI: 10.1002/sim.8570
-
[6]
Countdown Regression: Sharp and Calibrated Survival Predictions
Anand Avati et al. “Countdown Regression: Sharp and Calibrated Survival Predictions”. In: Proceedings of The 35th Uncertainty in Artificial Intelligence Conference. Uncertainty in Artificial Intelligence. PMLR, Aug. 6, 2020, pp. 145–155. URL: https://proceedings. mlr.press/v115/avati20a.html (visited on 05/21/2024)
work page 2020
-
[7]
Survival Regression with Accelerated Failure Time Model in XGBoost
Avinash Barnwal, Hyunsu Cho, and Toby Hocking. “Survival Regression with Accelerated Failure Time Model in XGBoost”. In:Journal of Computational and Graphical Statistics31.4 (Oct. 2, 2022), pp. 1292–1302. ISSN : 1061-8600. DOI: 10.1080/10618600.2022.2067548
-
[8]
Advanced Research Computing Center
Beartooth Computing Environment, x86_64 cluster. Advanced Research Computing Center. University of Wyoming, Laramie, WY. 2024. DOI: {https : / / doi . org / 10 . 15786 / M2FY47}
work page 2024
-
[9]
mlr3tuningspaces: Search Spaces for ’mlr3’
Marc Becker. mlr3tuningspaces: Search Spaces for ’mlr3’. GitHub, 2024. URL: https : //github.com/mlr-org/mlr3extralearners
work page 2024
-
[10]
pammtools: Piece-wise exponential Additive Mixed Modeling tools
Andreas Bender and Fabian Scheipl. “pammtools: Piece-wise exponential Additive Mixed Modeling tools”. In: arXiv:1806.01042 [stat] (2018). URL: http://arxiv.org/abs/1806. 01042
work page internal anchor Pith review Pith/arXiv arXiv 2018
-
[11]
Penalized estimation of complex, non-linear exposure-lag-response associations
Andreas Bender et al. “Penalized estimation of complex, non-linear exposure-lag-response associations”. In: Biostatistics 20.2 (Feb. 2018), pp. 315–331. ISSN : 1465-4644. DOI: 10. 1093/biostatistics/kxy003 . URL: https://doi.org/10.1093/biostatistics/ kxy003
-
[12]
Allowing for Mandatory Covariates in Boosting Estimation of Sparse High-Dimensional Survival Models
Harald Binder and Martin Schumacher. “Allowing for Mandatory Covariates in Boosting Estimation of Sparse High-Dimensional Survival Models”. In: BMC Bioinformatics 9.1 (Jan. 10, 2008), p. 14. ISSN : 1471-2105. DOI: 10.1186/1471-2105-9-14 . 10
-
[13]
mlr3pipelines - Flexible Machine Learning Pipelines in R
Martin Binder et al. “mlr3pipelines - Flexible Machine Learning Pipelines in R”. In: Journal of Machine Learning Research 22.184 (2021), pp. 1–7. URL: http://jmlr.org/papers/ v22/21-0281.html
work page 2021
-
[14]
Hyperparameter Optimization: Foundations, Algorithms, Best Practices, and Open Challenges
Bernd Bischl et al. “Hyperparameter Optimization: Foundations, Algorithms, Best Practices, and Open Challenges”. In:WIREs Data Mining and Knowledge Discovery13.2 (2023), e1484. ISSN : 1942-4795. DOI: 10.1002/widm.1484
-
[15]
Paul Blanche, Jean-François Dartigues, and Hélène Jacqmin-Gadda. “Estimating and Com- paring Time-Dependent Areas under Receiver Operating Characteristic Curves for Censored Event Times with Competing Risks”. In: Statistics in Medicine 32.30 (2013), pp. 5381–5397. ISSN : 1097-0258. DOI: 10.1002/sim.5958
-
[16]
A Plea for Neutral Com- parison Studies in Computational Sciences
Anne-Laure Boulesteix, Sabine Lauer, and Manuel J. A. Eugster. “A Plea for Neutral Com- parison Studies in Computational Sciences”. In: PLOS ONE 8.4 (Apr. 24, 2013), e61562. ISSN : 1932-6203. DOI: 10.1371/journal.pone.0061562
-
[17]
Classification and Regression Trees
Leo Breiman, ed. Classification and Regression Trees. 1. CRC Press repr. Boca Raton, Fla.: Chapman & Hall/CRC, 1998. 358 pp. ISBN : 978-0-412-04841-8
work page 1998
-
[18]
Design and Analysis of Two-Phase Studies with Binary Outcome Applied to Wilms Tumour Prognosis
N. E. Breslow and N. Chatterjee. “Design and Analysis of Two-Phase Studies with Binary Outcome Applied to Wilms Tumour Prognosis”. In:Journal of the Royal Statistical Society Series C: Applied Statistics 48.4 (Dec. 1, 1999), pp. 457–468. ISSN : 0035-9254. DOI: 10. 1111/1467-9876.00165
-
[19]
Göran Broström. eha: Event History Analysis. R package version 2.9.0. 2021. URL: http: //ehar.se/r/eha/
work page 2021
-
[20]
Boosting With the L2 Loss: Regression and Classification
Peter Bühlmann and Bin Yu. “Boosting With the L2 Loss: Regression and Classification”. In: Journal of the American Statistical Association 98.462 (June 1, 2003), pp. 324–339. ISSN : 0162-1459. DOI: 10.1198/016214503000125
-
[21]
smcure: Fit Semiparametric Mixture Cure Models
Chao Cai et al. smcure: Fit Semiparametric Mixture Cure Models. R package version 2.0
-
[22]
URL: https://CRAN.R-project.org/package=smcure
-
[23]
Supplemental Materials to Bayesian Methods for Data Analysis, 3rd Edition
Bradley P. Carlin and Thomas A. Louis. “Supplemental Materials to Bayesian Methods for Data Analysis, 3rd Edition”. In: (Oct. 2, 2018). DOI: 10.13020/D6N10N
-
[24]
Groups, the Media, Agency Waiting Costs, and FDA Drug Approval
Daniel P. Carpenter. “Groups, the Media, Agency Waiting Costs, and FDA Drug Approval”. In: American Journal of Political Science 46.3 (2002), pp. 490–505. ISSN : 00925853, 15405907. URL: http://www.jstor.org/stable/3088394
-
[25]
An Empirical Comparison of Supervised Learning Algorithms
Rich Caruana and Alexandru Niculescu-Mizil. “An Empirical Comparison of Supervised Learning Algorithms”. In: Proceedings of the 23rd International Conference on Machine Learning - ICML ’06. The 23rd International Conference. Pittsburgh, Pennsylvania: ACM Press, 2006, pp. 161–168. ISBN : 978-1-59593-383-6. DOI: 10.1145/1143844.1143865
-
[26]
Tianqi Chen and Carlos Guestrin. “XGBoost: A Scalable Tree Boosting System”. In:Proceed- ings of the 22nd ACM SIGKDD International Conference on Knowledge Discovery and Data Mining. KDD ’16. New York, NY , USA: Association for Computing Machinery, Aug. 13, 2016, pp. 785–794. ISBN : 978-1-4503-4232-2. DOI: 10.1145/2939672.2939785
-
[27]
D. R. Cox. “Partial Likelihood”. In: Biometrika 62.2 (Aug. 1, 1975), pp. 269–276. ISSN : 0006-3444. DOI: 10.1093/biomet/62.2.269
-
[28]
Statistical comparisons of classifiers over multiple data sets
Janez Demšar. “Statistical comparisons of classifiers over multiple data sets”. In:Journal of Machine learning research 7.1 (2006), pp. 1–30
work page 2006
-
[29]
Time to default in credit scoring using survival analysis: A benchmark study
Lore Dirick, Gerda Claeskens, and Bart Baesens. “Time to default in credit scoring using survival analysis: A benchmark study”. In: Journal of the Operational Research Society 68.6 (2017), pp. 652–665. ISSN : 14769360. DOI: 10.1057/s41274-016-0128-9
-
[30]
doi: 10.1016/j.mayocp.2012.03.009
Angela Dispenzieri et al. “Use of nonclonal serum immunoglobulin free light chains to predict overall survival in the general population”. eng. In: Mayo Clinic proceedings 87.6 (June 2012), pp. 517–523. ISSN : 1942-5546. DOI: 10.1016/j.mayocp.2012.03.009. URL: https://www.ncbi.nlm.nih.gov/pubmed/22677072%20https://www.ncbi.nlm. nih.gov/pmc/articles/PMC3538473/
-
[31]
SurvSet: An Open-Source Time-to-Event Dataset Repository
Erik Drysdale. “SurvSet: An Open-Source Time-to-Event Dataset Repository”. Mar. 6, 2022. arXiv: 2203.03094 [cs, stat] . URL: http://arxiv.org/abs/2203.03094 (visited on 03/12/2022)
-
[32]
Sebastian Fischer, Michel Lang, and Marc Becker. “Large-Scale Benchmarking”. In:Applied Machine Learning Using mlr3 in R . Ed. by Bernd Bischl et al. CRC Press, 2024. URL: https://mlr3book.mlr-org.com/large-scale_benchmarking.html. 11
work page 2024
-
[33]
Y . Foucher et al. RISCA: Causal Inference and Prediction in Cohort-Based Analyses. R package version 1.0.4. 2023. URL: https://CRAN.R-project.org/package=RISCA
work page 2023
-
[34]
Jerome Friedman. “Stochastic Gradient Boosting”. In: Computational Statistics & Data Analysis 38 (Mar. 1999), pp. 367–378. DOI: 10.1016/S0167-9473(01)00065-2
-
[35]
Roman Garnett. Bayesian Optimization. Cambridge University Press, 2023
work page 2023
-
[36]
Ekavi N Georgousopoulou et al. “Comparisons between Survival Models in Predicting Cardiovascular Disease Events : Application in the ATTICA Study ( 2002-2012 ).” In: Journal of Statistics Applications & Probability 4.2 (2015), pp. 203–210
work page 2002
-
[37]
L1 Penalized Estimation in the Cox Proportional Hazards Model
Jelle J. Goeman. “L1 Penalized Estimation in the Cox Proportional Hazards Model”. In: Biometrical Journal 52.1 (2010), pp. 70–84. ISSN : 1521-4036. DOI: 10 . 1002 / bimj . 200900028
work page 2010
-
[38]
Performance Evaluation of Support Vector Regression Models for Survival Analysis: A Simulation Study
Shahrbanoo Goli et al. “Performance Evaluation of Support Vector Regression Models for Survival Analysis: A Simulation Study”. In:International Journal of Advanced Computer Science and Applications 7.6 (2016). ISSN : 21565570, 2158107X. DOI: 10.14569/IJACSA. 2016.070650
-
[39]
Assessment and Comparison of Prognostic Classification Schemes for Survival Data
E. Graf et al. “Assessment and Comparison of Prognostic Classification Schemes for Survival Data”. In: Statistics in Medicine 18.17-18 (Sept. 15, 1999), pp. 2529–2545. ISSN : 0277-
work page 1999
-
[40]
1002 / (sici ) 1097 - 0258(19990915 / 30 ) 18 : 17 / 18<2529 :: aid - sim274>3.0.co;2-5
DOI: 10 . 1002 / (sici ) 1097 - 0258(19990915 / 30 ) 18 : 17 / 18<2529 :: aid - sim274>3.0.co;2-5. pmid: 10474158
-
[41]
frailtyHL: Frailty Models via Hierarchical Likelihood
Il Do Ha et al. frailtyHL: Frailty Models via Hierarchical Likelihood. R package version 2.3
-
[42]
URL: https://CRAN.R-project.org/package=frailtyHL
-
[43]
Comparison of Survival Models for Analyzing Prognostic Factors in Gastric Cancer Patients
Danial Habibi et al. “Comparison of Survival Models for Analyzing Prognostic Factors in Gastric Cancer Patients”. In: Asian Pacific journal of cancer prevention : APJCP 19.3 (2018), pp. 749–753. ISSN : 2476-762X. DOI: 10.22034/APJCP.2018.19.3.749 . URL: http://www.ncbi.nlm.nih.gov/pubmed/29582630%7B%5C%%7D0Ahttp://www. pubmedcentral.nih.gov/articlerender....
-
[44]
Effective Ways to Build and Evaluate Individual Survival Distributions
Humza Haider et al. “Effective Ways to Build and Evaluate Individual Survival Distributions”. In: Journal of Machine Learning Research 21.85 (2020), pp. 1–63. ISSN : 1533-7928. URL: http://jmlr.org/papers/v21/18-772.html (visited on 05/21/2024)
work page 2020
-
[45]
Evaluating the yield of medical tests
Frank E. Harrell, Robert M. Califf, and David B. Pryor. “Evaluating the yield of medical tests”. In: JAMA 247.18 (May 1982), pp. 2543–2546. ISSN : 0098-7484. URL: http://dx. doi.org/10.1001/jama.1982.03320430047030
-
[46]
Large-Scale Benchmark Study of Survival Prediction Methods Using Multi-Omics Data
Moritz Herrmann et al. “Large-Scale Benchmark Study of Survival Prediction Methods Using Multi-Omics Data”. In:Briefings in Bioinformatics 22.3 (May 1, 2021), bbaa167. ISSN : 1477-4054. DOI: 10.1093/bib/bbaa167
-
[47]
Applied survival analysis regres- sion modeling of time-to-event data
David W Hosmer, Stanley Lemeshow, and Susanne May. Applied survival analysis regres- sion modeling of time-to-event data. eng. 2nd ed. Wiley series in probability and statistics. Hoboken, N.J.: Wiley-Interscience, 2008
work page 2008
-
[48]
Applied survival analysis: regression modeling of time-to-event data
David W Hosmer Jr, Stanley Lemeshow, and Susanne May. Applied survival analysis: regression modeling of time-to-event data. V ol. 618. John Wiley & Sons, 2011
work page 2011
-
[49]
Unbiased Recursive Partitioning: A Conditional Inference Framework
Torsten Hothorn, Kurt Hornik, and Achim Zeileis. “Unbiased Recursive Partitioning: A Conditional Inference Framework”. In: Journal of Computational and Graphical Statistics 15.3 (Sept. 1, 2006), pp. 651–674. ISSN : 1061-8600. DOI: 10.1198/106186006X133933
-
[50]
Validation, Calibration, Revision and Combination of Prognostic Survival Models
Hans C. van Houwelingen. “Validation, Calibration, Revision and Combination of Prognostic Survival Models”. In: Statistics in Medicine 19.24 (2000), pp. 3401–3415. ISSN : 1097-0258. DOI: 10.1002/1097-0258(20001230)19:24<3401::AID-SIM554>3.0.CO;2-2
-
[51]
By Hemant Ishwaran et al. “Random survival forests”. In:The Annals of Statistics 2.3 (2008), pp. 841–860. DOI: 10.1214/08-AOAS169. arXiv: arXiv:0811.1645v1
work page internal anchor Pith review Pith/arXiv arXiv doi:10.1214/08-aoas169 2008
-
[52]
Accelerated and Interpretable Oblique Random Survival Forests
Byron C. Jaeger et al. “Accelerated and Interpretable Oblique Random Survival Forests”. In: Journal of Computational and Graphical Statistics 33.1 (Jan. 2, 2024), pp. 192–207. ISSN : 1061-8600. DOI: 10.1080/10618600.2023.2231048
-
[53]
Acute Stroke With Atrial Fibrillation
Henrik Stig Jørgensen et al. “Acute Stroke With Atrial Fibrillation”. In:Stroke 27.10 (Oct. 1, 1996), pp. 1765–1769. DOI: 10.1161/01.STR.27.10.1765
-
[54]
John D. Kalbfleisch and Ross L. Prentice. The Statistical Analysis of Failure Time Data. John Wiley & Sons, Jan. 25, 2011. 464 pp. ISBN : 978-1-118-03123-0. 12
work page 2011
-
[55]
Nonparametric Estimation from Incomplete Observations
E. L. Kaplan and Paul Meier. “Nonparametric Estimation from Incomplete Observations”. In: Journal of the American Statistical Association 53.282 (1958), pp. 457–481. ISSN : 01621459. DOI: 10.2307/2281868
-
[56]
Comparison of Cox Regression With Other Methods for Determining Prediction Models and Nomograms
Michael W. Kattan. “Comparison of Cox Regression With Other Methods for Determining Prediction Models and Nomograms”. In: The Journal of Urology. Part 2 of 2 170 (6, Supple- ment Dec. 1, 2003), S6–S10. ISSN : 0022-5347. DOI: 10.1097/01.ju.0000094764.56269. 2d
-
[57]
The Index of Prediction Accuracy: An Intuitive Measure Useful for Evaluating Risk Prediction Models
Michael W. Kattan and Thomas A. Gerds. “The Index of Prediction Accuracy: An Intuitive Measure Useful for Evaluating Risk Prediction Models”. In: Diagnostic and Prognostic Research 2.1 (May 4, 2018), p. 7. ISSN : 2397-7523. DOI: 10.1186/s41512-018-0029-2
- [58]
-
[59]
Katzman, Uri Shaham, Alexander Cloninger, Jonathan Bates, Tingting Jiang, and Yuval Kluger
Jared L Katzman et al. “DeepSurv: personalized treatment recommender system using a Cox proportional hazards deep neural network”. In: BMC Medical Research Methodology 18.1 (2018), p. 24. ISSN : 1471-2288. DOI: 10.1186/s12874-018-0482-1 . URL: https: //doi.org/10.1186/s12874-018-0482-1
-
[60]
John M Kirkwood et al. “Interferon alfa-2b adjuvant therapy of high-risk resected cutaneous melanoma: the Eastern Cooperative Oncology Group Trial EST 1684.” In:Journal of clinical oncology 14.1 (1996), pp. 7–17
work page 1996
-
[61]
Survival analysis: techniques for censored and truncated data
John P Klein and Melvin L Moeschberger. Survival analysis: techniques for censored and truncated data. 2nd ed. Springer Science & Business Media, 2003. ISBN : 0387216456
work page 2003
-
[62]
Roger Koenker. quantreg: Quantile Regression. R package version 5.86. 2021. URL: https: //www.r-project.org
work page 2021
-
[63]
Explained Residual Variation, Explained Risk, and Goodness of Fit
Edward L Korn and Richard Simon. “Explained Residual Variation, Explained Risk, and Goodness of Fit”. In: The American Statistician 45.3 (Dec. 1991), pp. 201–206. ISSN : 00031305. DOI: 10.2307/2684290. URL: http://www.jstor.org/stable/2684290
-
[64]
Håvard Kvamme. pycox. 2018. URL: https://pypi.org/project/pycox/
work page 2018
-
[65]
"Benign" monoclonal gammopathy–after 20 to 35 years of follow-up
R A Kyle. “"Benign" monoclonal gammopathy–after 20 to 35 years of follow-up.” eng. In: Mayo Clinic proceedings 68.1 (Jan. 1993), pp. 26–36. ISSN : 0025-6196 (Print). DOI: 10.1016/s0025-6196(12)60015-9
-
[66]
Good Parameters and Implementations for Combined Multiple Recursive Random Number Generators
Pierre L’Ecuyer. “Good Parameters and Implementations for Combined Multiple Recursive Random Number Generators”. In: Operations Research 47.1 (Feb. 1999), pp. 159–164. ISSN : 0030-364X. DOI: 10.1287/opre.47.1.159 . URL: https://pubsonline.informs. org/doi/abs/10.1287/opre.47.1.159
-
[67]
Batchtools: Tools for R to Work on Batch Systems
Michel Lang, Bernd Bischl, and Dirk Surmann. “Batchtools: Tools for R to Work on Batch Systems”. In: Journal of Open Source Software2.10 (Feb. 22, 2017), p. 135.ISSN : 2475-9066. DOI: 10.21105/joss.00135
-
[68]
mlr3: A modern object-oriented machine learning framework in R
Michel Lang et al. “mlr3: A modern object-oriented machine learning framework in R”. In: Journal of Open Source Software 4.44 (2019), p. 1903. DOI: 10.21105/joss.01903. URL: https://joss.theoj.org/papers/10.21105/joss.01903
-
[69]
Michel Lang et al. mlr3tuning: Tuning for ’mlr3’. 2023. URL: https://cran.r-project. org/package=mlr3tuning
work page 2023
-
[70]
Review of statistical methods for survival analysis using genomic data
Seungyeoun Lee and Heeju Lim. “Review of statistical methods for survival analysis using genomic data”. eng. In: Genomics & informatics 17.4 (Dec. 2019), e41–e41. ISSN : 1598- 866X. DOI: 10.5808/GI.2019.17.4.e41 . URL: https://pubmed.ncbi.nlm.nih. gov/31896241%20https://www.ncbi.nlm.nih.gov/pmc/articles/PMC6944043/
-
[71]
Lee, Changhee et al. DeepHit. 2019. URL: https://github.com/chl8856/DeepHit
work page 2019
-
[72]
D. Y . Lin. “On the Breslow estimator”. In:Lifetime Data Analysis 13.4 (2007), pp. 471–480. ISSN : 13807870. DOI: 10.1007/s10985-007-9048-y
-
[73]
C L Loprinzi et al. “Prospective evaluation of prognostic variables from patient-completed questionnaires. North Central Cancer Treatment Group.” eng. In:Journal of clinical oncology : official journal of the American Society of Clinical Oncology12.3 (Mar. 1994), pp. 601–607. ISSN : 0732-183X (Print). DOI: 10.1200/JCO.1994.12.3.601
-
[74]
Comparison of Proportional Hazards Models and Neural Networks for Reliability Estimation
James T. Luxhoj and Huan-Jyh Shyur. “Comparison of Proportional Hazards Models and Neural Networks for Reliability Estimation”. In: Journal of Intelligent Manufacturing 8.3 (May 1, 1997), pp. 227–234. ISSN : 1572-8145. DOI: 10.1023/A:1018525308809. 13
-
[75]
Relative survival analysis in R
M. Pohar and J. Stare. “Relative survival analysis in R”. In:Computer methods and programs in biomedicine 81 (3 2006), pp. 272–278. DOI: 10.1016/j.cmpb.2006.01.004
-
[76]
Evaluating Random Forests for Survival Analysis using Prediction Error Curves
Ulla B Mogensen, Hemant Ishwaran, and Thomas A Gerds. Evaluating Random Forests for Survival Analysis using Prediction Error Curves. 2014
work page 2014
-
[77]
Statistical Comparison of Survival Models for Analysis of Cancer Data
Bijan Moghimi-Dehkordi et al. “Statistical Comparison of Survival Models for Analysis of Cancer Data”. In:Asian Pacific journal of cancer prevention: APJCP9.3 (2008), pp. 417–420. ISSN : 2476-762X. pmid: 18990013
work page 2008
-
[78]
General Semiparametric Shared Frailty Model: Estimation and Simulation with frailtySurv
John V . Monaco, Malka Gorfine, and Li Hsu. “General Semiparametric Shared Frailty Model: Estimation and Simulation with frailtySurv”. In: Journal of Statistical Software 86.4 (2018), pp. 1–42. DOI: 10.18637/jss.v086.i04
-
[79]
A Comparison of Cox Proportional Hazards and Artificial Neural Network Models for Medical Prognosis
Lucila Ohno-Machado. “A Comparison of Cox Proportional Hazards and Artificial Neural Network Models for Medical Prognosis”. In:Computers in Biology and Medicine27.1 (Jan. 1, 1997), pp. 55–65. ISSN : 0010-4825. DOI: 10.1016/S0010-4825(96)00036-4
-
[80]
Modeling medical prognosis: survival analysis techniques
Lucila Ohno-Machado. “Modeling medical prognosis: survival analysis techniques.” eng. In: Journal of biomedical informatics 34.6 (Dec. 2001), pp. 428–439. ISSN : 1532-0464 (Print). DOI: 10.1006/jbin.2002.1038
discussion (0)
Sign in with ORCID, Apple, or X to comment. Anyone can read and Pith papers without signing in.