Cosmic Ray Ionization of Low-Excitation Lines in Active Galactic Nuclei and Starburst Galaxies
Pith reviewed 2026-05-23 08:28 UTC · model grok-4.3
The pith
Cosmic ray ionization creates a secondary low-ionization layer that enhances low-excitation lines and reproduces observed positions in BPT diagrams for AGN and starbursts.
A machine-rendered reading of the paper's core claim, the machinery that carries it, and where it could break.
Core claim
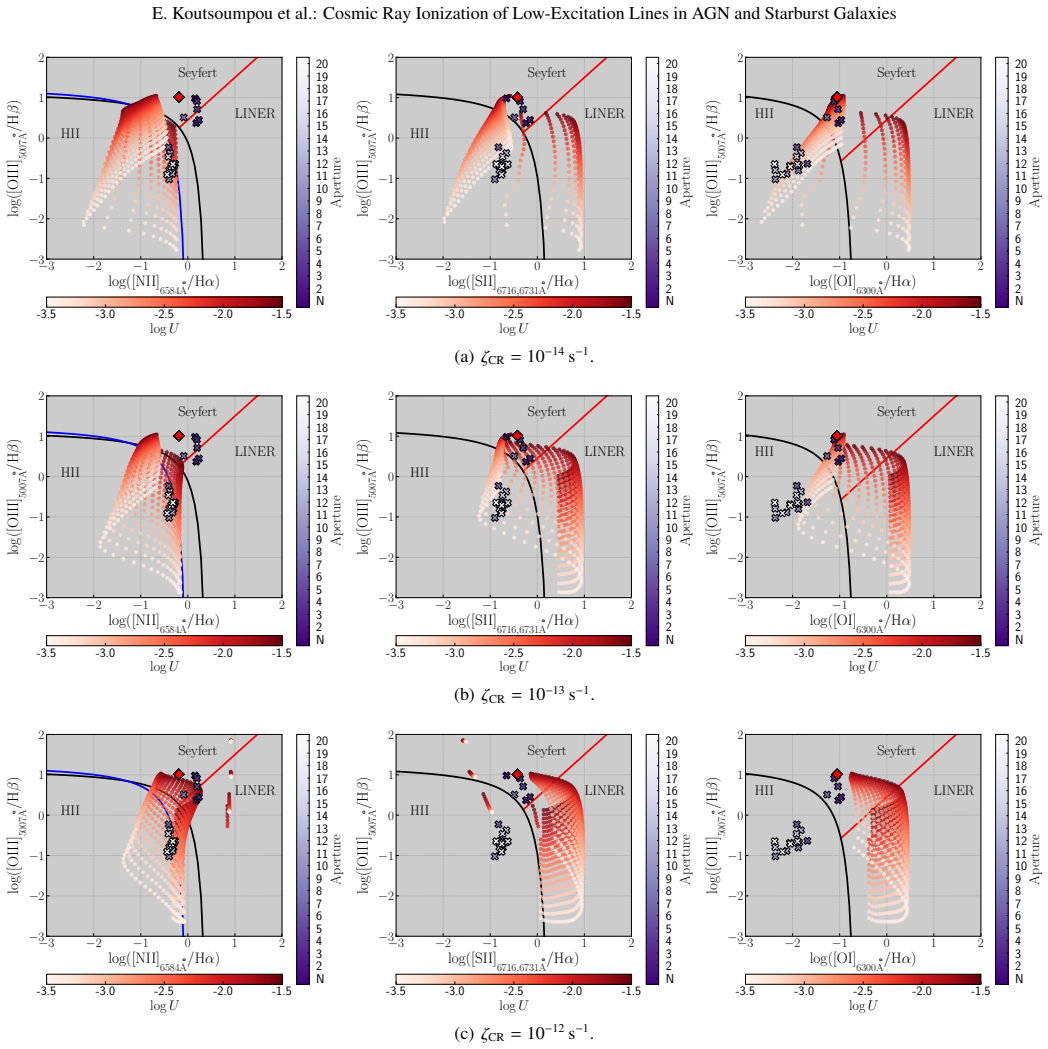
Cosmic ray ionization rates of 10^{-13} s^{-1} and higher form a secondary low-ionization layer in nebular gas that boosts emission from low-excitation lines, allowing AGN simulations to reproduce Seyfert loci in BPT diagrams at solar metallicities and star-formation simulations to explain LINER line ratios.
What carries the argument
The secondary low-ionization layer produced by cosmic ray ionization beyond the photoionization front, which increases the contribution of low-excitation transitions to the total emission.
If this is right
- AGN photoionization models that include high cosmic ray rates match observed Seyfert positions in BPT diagrams at solar metallicities.
- Star formation models with high cosmic ray rates can account for line ratios in the LINER domain of diagnostic diagrams.
- Line-ratio based estimates of metallicity and ionization parameter are altered once cosmic ray ionization is included.
- New maximum starburst boundaries on BPT diagrams can separate regions dominated by AGN photoionization from those influenced by star formation plus high cosmic ray rates.
Where Pith is reading between the lines
- Cosmic ray effects may need to be included when interpreting line ratios in other environments with dense molecular gas near supernova activity or outflows.
- The secondary layer could reconcile some discrepancies between pure photoionization predictions and observations in composite systems.
- Future observations targeting depth-dependent line ratios might directly test for the presence of this extra ionization component.
Load-bearing premise
The CLOUDY code accurately represents the combined thermal, ionization, and chemical effects of photoionization plus cosmic rays on the gas without missing important processes that would change the secondary layer.
What would settle it
Detection or non-detection of the predicted extra low-ionization emission component in regions with independently measured cosmic ray ionization rates above 10^{-13} s^{-1}, such as in the narrow-line region of Centaurus A or NGC 1068.
Figures





read the original abstract
Cosmic rays (CRs) can significantly impact dense molecular clouds in galaxies, heating the interstellar medium (ISM) and altering its chemistry, ionization, and thermal properties. Their influence is particularly relevant in environments with high CR rates, such as starburst galaxies with supernova remnants or jets and outflows in active galactic nuclei (AGN). CRs transfer energy to the ionized phase of the ISM far from the ionization source, preventing gas cooling and driving large-scale winds. In this work, we use CLOUDY to explore the effect of CRs on nebular gas, a relatively underexplored area, mainly focused on cold molecular gas. Our models cover a broad range of density ($1 - 10^4\,\rm{cm^{-3}}$), ionization parameter ($-3.5 \leq \log U \leq -1.5$), and CR ionization rate ($10^{-16}\, \rm{s^{-1}} - 10^{-12}\, \rm{s^{-1}}$). These are compared to MUSE observations of two AGN, Centaurus A and NGC 1068, and the starburst NGC 253. We find that CR rates $\gtrsim 10^{-13}\, \rm{s^{-1}}$, typical of AGN and strong starburst galaxies, can significantly alter the thermal structure of the ionized gas by forming a deep secondary low-ionization layer beyond the photoionization-dominated region. This enhances emission from low-ionization transitions, such as [\ion{N}{ii}], [\ion{S}{ii}], and [\ion{O}{i}], affecting line-ratio diagnostics, metallicity, and ionization estimates. Unlike pure photoionization models, AGN simulations with high CR ionization rates reproduce the Seyfert loci in BPT diagrams without requiring super-solar metallicities for the narrow-line region. Additionally, star formation simulations with high CR ionization rates can explain line ratios in the LINER domain. We propose new maximum starburst boundaries for BPT diagrams to distinguish regions dominated by AGN photoionization from those that could be explained by star formation plus high CR ionization rates.
Editorial analysis
A structured set of objections, weighed in public.
Referee Report
Summary. The manuscript uses CLOUDY to model the effects of cosmic-ray ionization rates (10^{-16} to 10^{-12} s^{-1}) on nebular gas across densities 1–10^4 cm^{-3} and log U from -3.5 to -1.5. It claims that rates ≳10^{-13} s^{-1} (typical of AGN and strong starbursts) produce a deep secondary low-ionization layer that enhances [N II], [S II], and [O I] emission, allowing solar-metallicity AGN models to reproduce observed Seyfert loci in BPT diagrams without super-solar narrow-line-region metallicities and star-formation models to reach the LINER domain; revised maximum-starburst boundaries are proposed. The models are compared to MUSE data for Centaurus A, NGC 1068, and NGC 253.
Significance. If the modeling holds, the work supplies a physically motivated alternative to super-solar metallicity explanations for BPT positions in high-CR environments and could revise metallicity and ionization diagnostics for AGN and starburst narrow-line regions. The broad parameter grid and direct comparison to three galaxies provide directional support for the claim.
major comments (2)
- [Results/comparison to observations] The comparison to MUSE observations of Centaurus A, NGC 1068, and NGC 253 is described only qualitatively; no quantitative fit statistics (reduced χ², residual distributions, or line-ratio offsets with uncertainties) are reported, so the degree to which the high-CR models actually reproduce the observed loci versus pure-photoionization models remains unquantified.
- [Methods/modeling setup] The central result—that CR rates ≳10^{-13} s^{-1} produce a secondary low-ionization zone whose extra low-ionization-line emissivity shifts the models onto the Seyfert and LINER loci—depends on CLOUDY correctly computing ionization balance, secondary-electron heating, and net cooling in the partially ionized transition region; no validation against other codes, no exploration of additional cooling channels (e.g., enhanced molecular or fine-structure lines), and no sensitivity tests to CR penetration depth are presented.
minor comments (1)
- [Abstract] The abstract sentence “a relatively underexplored area, mainly focused on cold molecular gas” is ambiguous; clarify whether the clause modifies the present work or the existing literature.
Simulated Author's Rebuttal
We thank the referee for the constructive report and the recommendation for major revision. We address each major comment below, indicating where we agree and will revise the manuscript.
read point-by-point responses
-
Referee: The comparison to MUSE observations of Centaurus A, NGC 1068, and NGC 253 is described only qualitatively; no quantitative fit statistics (reduced χ², residual distributions, or line-ratio offsets with uncertainties) are reported, so the degree to which the high-CR models actually reproduce the observed loci versus pure-photoionization models remains unquantified.
Authors: We agree that quantitative statistics would strengthen the comparison. In the revised manuscript we will add reduced χ² values for the key line ratios ([N II]/Hα, [S II]/Hα, [O I]/Hα), mean offsets, and uncertainties, computed for both the high-CR and pure-photoionization models against the MUSE data for the three galaxies. revision: yes
-
Referee: The central result—that CR rates ≳10^{-13} s^{-1} produce a secondary low-ionization zone whose extra low-ionization-line emissivity shifts the models onto the Seyfert and LINER loci—depends on CLOUDY correctly computing ionization balance, secondary-electron heating, and net cooling in the partially ionized transition region; no validation against other codes, no exploration of additional cooling channels (e.g., enhanced molecular or fine-structure lines), and no sensitivity tests to CR penetration depth are presented.
Authors: CLOUDY is the standard code for such nebular modeling and its CR implementation follows published treatments; the code already incorporates a broad set of atomic and molecular cooling channels. We will add a paragraph in the methods section explicitly stating these assumptions, noting the lack of cross-code validation and the uniform CR rate approximation, and acknowledging that sensitivity tests to penetration depth lie outside the present scope. Full validation against other codes would require substantial additional effort. revision: partial
Circularity Check
No circularity: forward modeling with CLOUDY compared to external observations
full rationale
The paper runs CLOUDY grids over stated ranges of density, log U, and CR ionization rate, then directly compares the resulting line ratios to MUSE data on Centaurus A, NGC 1068, and NGC 253. No equation or result is defined in terms of itself, no parameter is fitted to the target BPT loci and then re-predicted, and no load-bearing claim rests on a self-citation chain. The central finding (high CR rates shift models onto observed loci) is an output of the simulation, not a tautology. This is standard self-contained forward modeling against independent data.
Axiom & Free-Parameter Ledger
axioms (2)
- domain assumption CLOUDY correctly computes the ionization and thermal balance when an additional cosmic-ray ionization rate is supplied as input.
- domain assumption The observed line ratios in the three galaxies can be directly compared to single-zone or simple multi-zone models without significant aperture or geometric effects.
Lean theorems connected to this paper
-
IndisputableMonolith/Cost/FunctionalEquation.leanwashburn_uniqueness_aczel unclear?
unclearRelation between the paper passage and the cited Recognition theorem.
We use Cloudy photoionization models... CR ionization rate (10^{-16} s^{-1} to 10^{-12} s^{-1})... AGN models... SF models... BPT diagrams
-
IndisputableMonolith/Foundation/RealityFromDistinction.leanreality_from_one_distinction unclear?
unclearRelation between the paper passage and the cited Recognition theorem.
high CR rates ≳10^{-13} s^{-1}... secondary low-ionization layer... enhances [N II], [S II], [O I]
What do these tags mean?
- matches
- The paper's claim is directly supported by a theorem in the formal canon.
- supports
- The theorem supports part of the paper's argument, but the paper may add assumptions or extra steps.
- extends
- The paper goes beyond the formal theorem; the theorem is a base layer rather than the whole result.
- uses
- The paper appears to rely on the theorem as machinery.
- contradicts
- The paper's claim conflicts with a theorem or certificate in the canon.
- unclear
- Pith found a possible connection, but the passage is too broad, indirect, or ambiguous to say the theorem truly supports the claim.
Reference graph
Works this paper leans on
-
[1]
, " * write output.state after.block = add.period write newline
ENTRY address archiveprefix author booktitle chapter edition editor howpublished institution eprint journal key month note number organization pages publisher school series title type volume year label extra.label sort.label short.list INTEGERS output.state before.all mid.sentence after.sentence after.block FUNCTION init.state.consts #0 'before.all := #1 ...
-
[2]
" write newline "" before.all 'output.state := FUNCTION n.dashify 't := "" t empty not t #1 #1 substring "-" = t #1 #2 substring "--" = not "--" * t #2 global.max substring 't := t #1 #1 substring "-" = "-" * t #2 global.max substring 't := while if t #1 #1 substring * t #2 global.max substring 't := if while FUNCTION word.in bbl.in " " * FUNCTION format....
-
[3]
Abazajian , K. N., Adelman-McCarthy , J. K., Ag \"u eros , M. A., et al. 2009, , 182, 543
work page 2009
-
[4]
Allen , M. G., Groves , B. A., Dopita , M. A., Sutherland , R. S., & Kewley , L. J. 2008, , 178, 20
work page 2008
-
[5]
C., Kim , C.-G., & Jiang , Y.-F
Armillotta , L., Ostriker , E. C., Kim , C.-G., & Jiang , Y.-F. 2024, , 964, 99
work page 2024
-
[6]
Asplund , M., Grevesse , N., Sauval , A. J., & Scott , P. 2009, , 47, 481
work page 2009
-
[7]
Bacon , R., Piqueras , L., Conseil , S., Richard , J., & Shepherd , M. 2016, MPDAF: MUSE Python Data Analysis Framework , Astrophysics Source Code Library, record ascl:1611.003
work page 2016
-
[8]
Bacon, Roland , Brinchmann, Jarle , Conseil, Simon , et al. 2023, A&A, 670, A4
work page 2023
- [9]
- [10]
-
[11]
Barbosa, F. K. B., Storchi-Bergmann, T., McGregor, P., Vale, T. B., & Rogemar Riffel, A. 2014, Monthly Notices of the Royal Astronomical Society, 445, 2353–2370
work page 2014
- [12]
-
[13]
Baron, D. & Netzer, H. 2019, Monthly Notices of the Royal Astronomical Society, 486, 4290
work page 2019
- [14]
-
[15]
Behrens, E., Mangum, J. G., Holdship, J., et al. 2022, The Astrophysical Journal, 939, 119
work page 2022
-
[16]
Bicknell, G. V., Sutherland, R. S., van Breugel, W. J. M., et al. 2000, The Astrophysical Journal, 540, 678
work page 2000
-
[17]
1997, Astrophysics and Space Science, 248, 177–190
Bland-Hawthorn, J., Lumsden, S., Voit, G., Cecil, G., & Weisheit, J. 1997, Astrophysics and Space Science, 248, 177–190
work page 1997
- [18]
-
[19]
Breitschwerdt , D., McKenzie , J. F., & Voelk , H. J. 1991, , 245, 79
work page 1991
-
[20]
2013, Monthly Notices of the Royal Astronomical Society, 432, 2112
Brinchmann, J., Charlot, S., Kauffmann, G., et al. 2013, Monthly Notices of the Royal Astronomical Society, 432, 2112
work page 2013
-
[21]
Brinchmann, J., Charlot, S., White, S. D. M., et al. 2004, Monthly Notices of the Royal Astronomical Society, 351, 1151
work page 2004
- [22]
-
[23]
Buck , T., Pfrommer , C., Pakmor , R., Grand , R. J. J., & Springel , V. 2020, , 497, 1712
work page 2020
-
[24]
2001, Publications of the ASP, 113, 1449
Calzetti , D. 2001, Publications of the ASP, 113, 1449
work page 2001
-
[25]
Carilli , C. L., Holdaway , M. A., Ho , P. T. P., & de Pree , C. G. 1992, , 399, L59
work page 1992
-
[26]
Carvalho , S. P., Dors , O. L., Cardaci , M. V., et al. 2020, , 492, 5675
work page 2020
-
[27]
Cecil , G., Bland , J., & Tully , R. B. 1990, , 355, 70
work page 1990
- [28]
- [29]
- [30]
- [31]
-
[32]
2006, Proceedings of the National Academy of Science, 103, 12269
Dalgarno , A. 2006, Proceedings of the National Academy of Science, 103, 12269
work page 2006
-
[33]
De Robertis , M. M. & Osterbrock , D. E. 1986, , 301, 98
work page 1986
-
[34]
Dopita , M. A. 1976, , 209, 395
work page 1976
-
[35]
Dopita , M. A. & Evans , I. N. 1986, , 307, 431
work page 1986
-
[36]
Dopita , M. A. & Sutherland , R. S. 1995, , 455, 468
work page 1995
-
[37]
Dors , O. L. 2021, , 507, 466
work page 2021
-
[38]
Dors , O. L., Contini , M., Riffel , R. A., et al. 2021, , 501, 1370
work page 2021
-
[39]
L., Maiolino , R., Cardaci , M
Dors , O. L., Maiolino , R., Cardaci , M. V., et al. 2020, , 496, 3209
work page 2020
-
[40]
Dors, O. L., Monteiro, A. F., Cardaci, M. V., Hägele, G. F., & Krabbe, A. C. 2019, Monthly Notices of the Royal Astronomical Society, 486, 5853
work page 2019
-
[41]
L., Valerdi, M., Freitas-Lemes, P., et al
Dors, O. L., Valerdi, M., Freitas-Lemes, P., et al. 2022, Monthly Notices of the Royal Astronomical Society, 514, 5506–5527
work page 2022
-
[42]
Dufour , R. J. & van den Bergh , S. 1978, , 226, L73
work page 1978
-
[43]
2023, astropy/specutils: v1.12.0
Earl, N., Tollerud, E., O'Steen, R., et al. 2023, astropy/specutils: v1.12.0
work page 2023
-
[44]
Eilek, J. A. 2014, New Journal of Physics, 16, 045001
work page 2014
-
[45]
Evans , I. N. & Dopita , M. A. 1985, , 58, 125
work page 1985
- [46]
-
[47]
Ferguson , J. W., Korista , K. T., Baldwin , J. A., & Ferland , G. J. 1997, , 487, 122
work page 1997
-
[48]
J., Chatzikos , M., Guzm \'a n , F., et al
Ferland , G. J., Chatzikos , M., Guzm \'a n , F., et al. 2017, Revista Mexicana de Astronomia y Astrofisica, 53, 385
work page 2017
-
[49]
Ferland , G. J., Fabian , A. C., Hatch , N. A., et al. 2009, , 392, 1475
work page 2009
-
[50]
Ferland , G. J. & Mushotzky , R. F. 1984, , 286, 42
work page 1984
-
[51]
Ferland , G. J., Porter , R. L., van Hoof , P. A. M., et al. 2013, , 49, 137
work page 2013
-
[52]
A., P \'e rez-Montero , E., V \' lchez , J
Fern \'a ndez-Ontiveros , J. A., P \'e rez-Montero , E., V \' lchez , J. M., Amor \' n , R., & Spinoglio , L. 2021, , 652, A23
work page 2021
-
[53]
Fern \'a ndez-Ontiveros , J. A., Prieto , M. A., & Acosta-Pulido , J. A. 2009, , 392, L16
work page 2009
- [54]
-
[55]
Fragile, P. C., Murray, S. D., Anninos, P., & van Breugel, W. 2004, The Astrophysical Journal, 604, 74
work page 2004
- [56]
-
[57]
Galliano, E., Alloin, D., Pantin, E., Lagage, P. O., & Marco, O. 2005, Astronomy & Astrophysics, 438, 803–820
work page 2005
-
[58]
Gallimore , J. F., Baum , S. A., O'Dea , C. P., & Pedlar , A. 1996, , 458, 136
work page 1996
-
[59]
Gallimore, J. F., Baum, S. A., & O’Dea, C. P. 2004, The Astrophysical Journal, 613, 794
work page 2004
-
[60]
F., Elitzur , M., Maiolino , R., et al
Gallimore , J. F., Elitzur , M., Maiolino , R., et al. 2016, , 829, L7
work page 2016
-
[61]
F., Yzaguirre , A., Jakoboski , J., et al
Gallimore , J. F., Yzaguirre , A., Jakoboski , J., et al. 2010, , 187, 172
work page 2010
-
[62]
Garc \' a-Burillo , S., Combes , F., Ramos Almeida , C., et al. 2016, , 823, L12
work page 2016
-
[63]
Girichidis , P., Naab , T., Hanasz , M., & Walch , S. 2018, , 479, 3042
work page 2018
-
[64]
Girichidis , P., Werhahn , M., Pfrommer , C., Pakmor , R., & Springel , V. 2024, , 527, 10897
work page 2024
-
[65]
Glassgold , A. E. & Langer , W. D. 1974, Astrophysical Journal, 193, 73
work page 1974
-
[66]
Gonz \'a lez-Alfonso , E., Fischer , J., Bruderer , S., et al. 2018, , 857, 66
work page 2018
-
[67]
Gonz \'a lez-Alfonso , E., Fischer , J., Bruderer , S., et al. 2013, , 550, A25
work page 2013
-
[68]
Goodger , J. L., Hardcastle , M. J., Croston , J. H., et al. 2010, , 708, 675
work page 2010
-
[69]
Gredel , R., Lepp , S., Dalgarno , A., & Herbst , E. 1989, , 347, 289
work page 1989
-
[70]
Groves , B. A., Dopita , M. A., & Sutherland , R. S. 2004 a , , 153, 9
work page 2004
-
[71]
Groves , B. A., Dopita , M. A., & Sutherland , R. S. 2004 b , , 153, 75
work page 2004
- [72]
-
[73]
Hardcastle, M. J., Worrall, D. M., Kraft, R. P., et al. 2003, The Astrophysical Journal, 593, 169
work page 2003
-
[74]
Harris, G. L. H., Rejkuba, M., & Harris, W. E. 2010, Publications of the Astronomical Society of Australia, 27, 457–462
work page 2010
-
[75]
2008, Astronomy & Astrophysics, 494, 563–577
Heesen, V., Beck, R., Krause, M., & Dettmar, R.-J. 2008, Astronomy & Astrophysics, 494, 563–577
work page 2008
-
[76]
Heesen , V., Beck , R., Krause , M., & Dettmar , R. J. 2011, , 535, A79
work page 2011
- [77]
-
[78]
Holdship , J., Mangum , J. G., Viti , S., et al. 2022, , 931, 89
work page 2022
-
[79]
K., Henkel, C., Hernández-Gómez, A., et al
Humire, P. K., Henkel, C., Hernández-Gómez, A., et al. 2022, , 663, A33
work page 2022
-
[80]
Indriolo, N., Fields, B. D., & McCall, B. J. 2009, The Astrophysical Journal, 694, 257
work page 2009
discussion (0)
Sign in with ORCID, Apple, or X to comment. Anyone can read and Pith papers without signing in.