REVIEW 3 major objections 4 minor 30 references
Optimal probabilistic feature shifts for reclassification in tree ensembles
T0 review · 3 major / 4 minor · reviewed 2026-08-11 · deepseek-v4-flash
Pith's one-line read The paper claims that finding the feature changes most likely to flip a tree ensemble's verdict is an effort-allocation problem, and that solving it yields feature rankings that outperform standard tree-ensemble rankings.
desk verdict New probabilistic effort-budget counterfactual optimization for tree ensembles, but the max-path objective is not the reclassification probability it claims to maximize. read the letter →
The pith
A machine-rendered reading of the paper's core claim, the machinery that carries it, and where it could break.
The reading
What carries the argument
The load-bearing object is the path-probability product at a leaf. For leaf $\ell$ in tree $r$, the probability of reaching $\ell$ after the effort decisions is $\prod_{t \in A(\ell)} \bigl(p^r_{\ell t} + \sum_{e=0}^{E} \beta^r_{t e}(p^r_{\ell t e} - p^r_{\ell t})\bigr)$, where $\beta^r_{t e}=1$ means $e$ units of effort are put into the feature split at node $t$ and $A(\ell)$ is the set of ancestors of $\ell$. Constraint (13) turns this product into an upper bound on the auxiliary variable $\theta^r_\ell$, with correction terms for leaves that do not target the desired class and for non-essential trees; because the objective maximizes a sum of logarithms of these $\theta$-values, the model prefers allocations that give high probability to the required number of essential trees. The $\kappa$-path variant borrows the k-sum/CVaR idea to maximize the $\kappa$-th smallest path probability, giving a tunable middle ground between best-case and worst-case behavior. This machinery lets effort allocation and feature-shift location be chosen together, rather than treating the shifted point as a free variable minimized by distance.
What would settle it
Longitudinal panel data with actual observed feature changes and subsequent classifications would settle the claim: estimate node-level change probabilities from the observed transitions, train a tree ensemble on the first wave, run the models with an effort budget, and compare the model's chosen effort features with random and random-forest rankings on second-wave outcomes; the central claim holds only if the model-selected features reclassify more people than the baselines under real, not simulated, changes.
Extended reading notes
Core claim
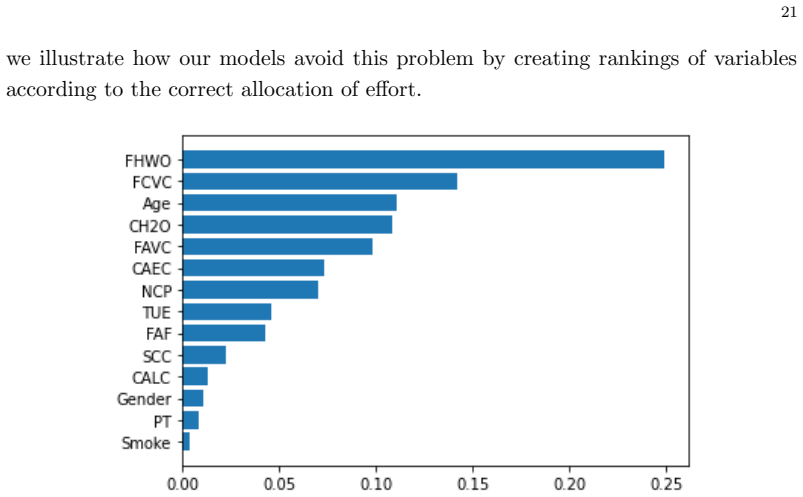
At the center of the paper is a new definition of the feature-shift problem for tree ensembles. Instead of minimizing a distance from the original observation to the closest point that the forest classifies as desired, the authors maximize the probability that the observation reaches such a point after a limited amount of effort. The input data are, for every node in every tree, the probability that the observation follows the branch leading to a given leaf both without effort, $p^r_{\ell t}$, and with $e$ units of effort, $p^r_{\ell t e}$. The decision variables select one leaf per tree, the effort level applied to each feature (shared across all splits that use that feature), and which trees count as essential for the majority vote. The objective is the log-probability of the path through the essential trees; a robust variant maximizes the worst-case path, and a $\kappa$-path variant maximizes the sorted $\kappa$-th path probability subject to a minimum cumulative probability threshold. On a real obesity dataset, rankings built from the effort allocations of these models reclassify more test-set individuals in simulations than rankings from the random forest itself or from random selections, with the 50%-path version reaching 93.33% of the feasible-to-change individuals at an effort budget of three features.
Load-bearing premise
The entire method hinges on the input probabilities that a person will change each feature, with and without effort, being known in advance and independent across trees; in the case study those probabilities are manufactured by 1000 synthetic perturbations with distributions chosen by the authors, so if the numbers do not reflect real change behavior the recommended features and the reported gains inherit that error.
Editorial extensions
If this is right
- Counterfactual explanations for tree ensembles can be built to maximize the probability of the shift, not minimize its distance, so recourses can be realistic even when no close point exists.
- The effort cap $\eta$ forces the solution to concentrate on a few features, giving a natural sparsity prior and producing feature-importance rankings that skip immutable variables such as age and gender.
- The three model variants span a risk spectrum from best-case (Max-path) through intermediate ($\kappa$-path) to worst-case (Min-path), and the 50%-path version delivered the best reclassification rates in the case study.
- Applying the models to the obesity data produced rankings whose top features differ from random-forest importances, and these rankings reclassified more test-set individuals in simulations.
- The approach treats per-feature change probabilities as first-class inputs, so it can be applied to any tree ensemble with univariate splits once those probabilities are available.
Reading between the lines
- If the probability estimates were learned from real longitudinal transitions rather than synthetic perturbations, the same models would likely produce recourses that are more plausible and better calibrated, because the optimization is only as good as those inputs.
- The path-probability decomposition is not tied to binary classification or unweighted forests; the essential-tree threshold can be replaced by any majority rule, so the approach should carry over to weighted and multiclass ensembles, though the paper only tests the binary case.
- The method could be used prospectively to design interventions: rather than asking which features matter globally, a policymaker could ask which features, for a given population and effort budget, maximize the number of individuals who cross the classification threshold.
Signed reviews
Editorial analysis
A structured set of objections, weighed in public.
Referee Report
Summary. The paper proposes a mathematical-optimization approach to feature-shift (recourse) in tree ensembles. Given a trained forest, per-node branch probabilities with and without effort, and an effort budget, the authors formulate three MINLP models (Max-path, Min-path, kappa-path) that choose which features an individual should modify and how much effort to spend, and they use the resulting solutions to rank feature importance. The method is applied to an obesity dataset with a random forest of 25 trees; the rankings are evaluated by simulating perturbed futures and measuring reclassification rates.
Significance. The probabilistic-effort viewpoint is potentially useful and the models are nontrivial; the paper contains a clear notation and a real-data case study. However, the central claim that the models maximize the probability of reaching the target class is not supported by the objective functions, and the empirical validation is circular because the same synthetic perturbation mechanism is used both to estimate the model inputs and to score the outputs. If the objective mismatch were corrected, the contribution would be a heuristic for the probability of a single path, not the claimed optimal reclassification procedure.
major comments (3)
- [Section 3.1, Eq. (Max-path)] The objective in (Max-path), max ∑_r log(∑_l z^r_l θ^r_l), is not the probability that the forest assigns the target class k*. For independent trees the reclassification probability is the sum, over all leaf configurations whose weighted majority is k*, of the product of the per-leaf path probabilities. The proposed objective selects one leaf per tree, sets θ^r_l=1 for non-essential trees via γ^r and φ^r_l, and maximizes the product over the remaining essential trees. This is the probability of a single sufficient leaf configuration, not of the majority-vote event. Constraints (2)-(13) do not connect the two. A concrete reversal: with three trees, one k* leaf per tree, and vote probabilities (0.6,0.6,0.6) under allocation A versus (0.7,0.7,0) under B, Max-path prefers B (0.49>0.36), while the true majority-vote probability is 0.648 for A and 0.49 for B. Min-path and kappa-path optimize selected quantiles of the same per-tree leaf probabilities and inherit this gap.
- [Sections 4.2-4.3, Tables 3-4] The empirical validation is circular. In Section 4.2 the branch probabilities p^r_lt and p^r_lte are estimated by perturbing each feature 1000 times with δ∼U[0,σ_j] (no effort) or δ∼U[0,1.5σ_j] (effort), and by Bernoulli switches with parameter max(1−p,0.2) for binary features. Section 4.3 then evaluates the resulting rankings by applying exactly the same perturbation mechanism to the test set and measuring reclassification rates. Thus the simulation scores the rankings under the same generative model that produced the probabilities; it cannot provide independent evidence that the method identifies features that are impactful under a realistic change process. The ad hoc choice of the perturbation scales is also a free parameter of the whole experiment.
- [Section 3.1, constraint (12)] The count of non-essential trees in (12) is off by one. With R equally weighted trees in a binary forest, the desired class wins if at least ceil(R/2) trees vote for it, so the number of non-essential positive trees should be (#positive votes) − ceil(R/2). The paper subtracts R/2+1, which is one too large for even R and non-integer for odd R. The R=25 case study is only consistent if R/2 is read as integer division (floor(R/2)+1); the general formulation as written does not match the definition of essential trees in the text.
minor comments (4)
- [Section 3.1, constraint (13)] Because φ^r_l=1 for leaves not in the desired class, θ^r_l may be set to 1 for every selected leaf of a negative-voting tree; if the objective is meant to be the probability of reaching the feature vector x, this probability is overestimated. The text should state clearly that the objective is only the probability of the essential path configuration, not the probability of the feature-shift vector itself.
- [Section 4.3, Tables 3-4] The tables report point estimates only, with no standard errors or confidence intervals across the 100 simulations; some entries are close (e.g., η=4: 25.22 vs 26.07 for RSR/RFR), so the reader cannot assess whether observed differences are meaningful. Please report variability across simulations.
- [Section 3.2, Eq. (κ-path)] The κ-path model maximizes the κ-th smallest per-tree leaf probability, not the cumulative probability of the κ smallest paths; the text referring to the 'joint probability of the κ less probable paths' and the analogy to CVaR should be reconciled with constraint (18) and the stated objective.
- [Throughout, notation] The notation τ^r_l appears to be used both for the set of leaves of tree r and for a specific leaf; please standardize the index sets to avoid confusion between τ^r and membership in a leaf set.
Circularity Check
The optimization is self-contained, but the case-study validation is circular: branch probabilities are estimated from synthetic perturbations, and the same perturbation process generates the 'validation' reclassification rates.
-
fitted input called prediction
[Section 4.2 (Probability estimation) and Section 4.3 (Rankings and results)]
"To estimate the probabilities, we run ns = 1000 simulations by perturbing the original value of the individual in the feature Xj ... we define the probability as the ratio nr/ns. ... [T]he evaluation was carried out ... we performed 100 simulations with perturbed values in all variables following the same approach that was used to estimate the probabilities of change in the tree nodes"
The probabilities p_lt and p_lte entering constraint (13) are the central data inputs of the optimization; they are constructed in Section 4.2 by perturbing each feature with a distribution whose direction is chosen from the target association (e.g., δ ~ U[0, σ_j] with no effort, U[0, 1.5σ_j] in the favorable direction with effort, and Bernoulli switches toward the beneficial class). Section 4.3 then 'validates' the rankings by simulating test-set outcomes with exactly the same perturbation approach used to estimate those probabilities. The success metric is therefore generated by the same stochastic model that the rankings were designed to optimize; the reported reclassification percentages mostly measure internal consistency rather than external predictive validity.
full rationale
The mathematical derivation in Section 3 is not circular: given the branch probabilities, constraints (2)-(13) and the stated objectives are solved as MINLPs, and no fitted target variable is smuggled into the model. The paper's self-citations ([2], [3]) are background and not load-bearing. The principal circularity is in the empirical validation loop of Section 4. The probabilities used as inputs are estimated from 1000 synthetic perturbations (Section 4.2), and the rankings are then evaluated by simulations that follow 'the same approach' (Section 4.3); thus the validation draws from the same generative model the optimization was built on, so the claim that the method 'validates the proposal' is self-referential rather than tested against independent evidence. I also note a correctness gap that is not circularity: the Max-path, Min-path, and κ-path objectives maximize a single selected leaf path or a quantile of per-tree path probabilities, not the weighted-majority probability of class k*, so the stated equivalence between the objectives and the probability of reclassification is not established. This does not affect the circularity score but is a separate validity risk.
Assumptions & free parameters
free parameters (5)
- Branch probabilities p^r_lt and p^r_lte =
Estimated from 1000 simulations per node; values not reported in the paper
- Effort budget eta =
1, 2, 3, and 4 in the case study
- Maximum per-feature effort E =
1 in the case study
- CVaR threshold mu =
1e-6
- Perturbation scale sigma_j and multipliers =
sigma_j from training data; multipliers 1 and 1.5; Bernoulli parameter max(1-p, 0.2)
assumptions (5)
- domain assumption Branch-taking probabilities are independent across trees, so the probability of a forest vote factorizes as a product over trees.
- domain assumption The probability p^r_lte for each node, feature, and effort level e is known or can be estimated from synthetic perturbations.
- ad hoc to paper Applying effort to a feature changes every node that splits on that feature in lockstep, with the same effort level e.
- standard math The probability of reaching leaf l is the product of the ancestor branch probabilities along the path.
- standard math Features are normalized to [0, 1] and split thresholds are treated with a small epsilon margin.
Cite this review
Pith. "Pith review of Optimal probabilistic feature shifts for reclassification in tree ensembles." pith.science (2026). https://pith.science/paper/PR747SWU
@misc{pith2026241203722,
  author       = {Pith},
  title        = {Pith review of: Optimal probabilistic feature shifts for reclassification in tree ensembles},
  year         = {2026},
  howpublished = {\url{https://pith.science/paper/PR747SWU}},
  note         = {Machine review of arXiv:2412.03722}
}
read the original abstract
In this paper we provide a novel mathematical optimization based methodology to perturb the features of a given observation to be re-classified, by a tree ensemble classification rule, to a certain desired class. The method is based on these facts: the most viable changes for an observation to reach the desired class do not always coincide with the closest distance point (in the feature space) of the target class; individuals put effort on a few number of features to reach the desired class; and each individual is endowed with a probability to change each of its features to a given value, which determines the overall probability of changing to the target class. Putting all together, we provide different methods to find the features where the individuals must exert effort to maximize the probability to reach the target class. Our method also allows us to rank the most important features in the tree-ensemble. The proposed methodology is tested on a real dataset, validating the proposal.
Figures


Figures from the paper (1 more)

Reference graph
Works this paper leans on
-
[1]
Bertsimas, D., Dunn, J., 2017. Optimal classification trees. Machine Learning 106, 1039–1082
work page 2017
-
[2]
Optimal arrangements of hyperplanes for SVM-based multiclass classification
Blanco, V., Jap´ on, A., Puerto, J., 2020. Optimal arrangements of hyperplanes for SVM-based multiclass classification. Advances in Data Analysis and Clas- sification 14, 175–199
work page 2020
-
[3]
A Mathematical Programming Approach to Optimal Classification Forests
Blanco, V., Jap´ on, A., Puerto, J., Zhang, P., 2024. A mathematical program- ming approach to optimal classification forests. arXiv preprint arXiv:2211.10502
work page Pith review arXiv 2024
-
[4]
On minimal extended representations of generalized power cones
Blanco, V., Mart ´ ınez-Ant´ on, M., 2024. On minimal extended representations of generalized power cones. SIAM Journal on Optimization 34, 3088–3111
work page 2024
-
[5]
Revisiting several problems and algorithms in continuous location with ℓτ norms
Blanco, V., Puerto, J., El Haj Ben Ali, S., 2014. Revisiting several problems and algorithms in continuous location with ℓτ norms. Computational Optimization and Applications 58, 563–595
work page 2014
-
[6]
Carrizosa, E., Ram ´ ırez-Ayerbe, J., Morales, D.R., 2024. Generating collec- tive counterfactual explanations in score-based classification via mathematical optimization. Expert Systems with Applications 238, 121954
work page 2024
-
[7]
Extracting tree-structured representations of trained networks
Craven, M., Shavlik, J., 1995. Extracting tree-structured representations of trained networks. Advances in neural information processing systems 8
work page 1995
-
[8]
Dandl, S., Molnar, C., Binder, M., Bischl, B., 2020. Multi-objective counter- factual explanations, in: International Conference on Parallel Problem Solving from Nature, Springer. pp. 448–469
work page 2020
Show all 30 references
-
[9]
Obesity level estimation software based on decision trees
De-La-Hoz-Correa, E., Mendoza Palechor, F., De-La-Hoz-Manotas, A., Morales Ortega, R., S´ anchez Hern´ andez, A.B., 2019. Obesity level estimation software based on decision trees. Journal of Computer Science , 66–77. 28 V. BLANCO, A. JAP ´ON, J. PUERTO and P. ZHANG
2019
-
[10]
Robust counter- factual explanations for tree-based ensembles, in: International conference on machine learning, PMLR
Dutta, S., Long, J., Mishra, S., Tilli, C., Magazzeni, D., 2022. Robust counter- factual explanations for tree-based ensembles, in: International conference on machine learning, PMLR. pp. 5742–5756
2022
-
[11]
New algorithmic framework for conditional value at risk: Application to stochastic fixed-charge transportation
Fern´ andez, E., Hinojosa, Y., Puerto, J., Saldanha-da Gama, F., 2019. New algorithmic framework for conditional value at risk: Application to stochastic fixed-charge transportation. European Journal of Operational Research 277, 215–226
2019
-
[12]
Conditional value-at-risk beyond finance: a survey
Filippi, C., Guastaroba, G., Speranza, M.G., 2020. Conditional value-at-risk beyond finance: a survey. International Transactions in Operational Research 27, 1277–1319
2020
-
[13]
Capturing users’ reality: A novel approach to generate coherent counterfactual explanations
F¨ orster, M., H¨ uhn, P., Klier, M., Kluge, K., 2021. Capturing users’ reality: A novel approach to generate coherent counterfactual explanations. Proceedings of the 54th Hawaii International Conference on System Sciences
2021
-
[14]
Sick and de- pressed? the causal impact of a diabetes diagnosis on depression
Gaggero, A., Gil, J., Jim´ enez-Rubio, D., Zucchelli, E., 2023. Sick and de- pressed? the causal impact of a diabetes diagnosis on depression. Health Eco- nomics Review 13, 38
2023
-
[15]
Shutting down to save lives: A regression discontinuity analysis of non-essential business closure
Gaggero, A., Mesa-Pedrazas, ´A., Fern´ andez-P´ erez,´A., 2024. Shutting down to save lives: A regression discontinuity analysis of non-essential business closure. Socio-Economic Planning Sciences 94, 101925
2024
-
[16]
Counterfactual explanations and how to find them: liter- ature review and benchmarking
Guidotti, R., 2024. Counterfactual explanations and how to find them: liter- ature review and benchmarking. Data Mining and Knowledge Discovery 38, 2770–2824
2024
-
[17]
Distribution- aware counterfactual explanation by mixed-integer linear optimization
Kanamori, K., Takagi, T., Kobayashi, K., Arimura, H., 2021. Distribution- aware counterfactual explanation by mixed-integer linear optimization. Trans- actions of the Japanese Society for Artificial Intelligence 36, C–L44 1
2021
-
[18]
Keane, M.T., Smyth, B., 2020. Good counterfactuals and where to find them: A case-based technique for generating counterfactuals for explainable ai (xai), in: Case-Based Reasoning Research and Development: 28th International Con- ference, ICCBR 2020, Salamanca, Spain, June 8–1...
2020
-
[19]
Extracting decision trees from trained neural networks
Krishnan, R., Sivakumar, G., Bhattacharya, P., 1999. Extracting decision trees from trained neural networks. Pattern recognition 32
1999
-
[20]
A risk-averse two-stage stochastic programming model for a joint multi-item capacitated line balancing and lot-sizing problem
Li, Y., Saldanha-da Gama, F., Liu, M., Yang, Z., 2023. A risk-averse two-stage stochastic programming model for a joint multi-item capacitated line balancing and lot-sizing problem. European Journal of Operational Research 304, 353– 365. 29
2023
-
[21]
Risk-averse two- stage stochastic programming for assembly line reconfiguration with dynamic lot sizes
Li, Y., Liu, M., Saldanha-da Gama, F., Yang, Z., 2024. Risk-averse two- stage stochastic programming for assembly line reconfiguration with dynamic lot sizes. Omega 127, 103092
2024
-
[22]
Artificial intelligence and black-box medical decisions: accuracy versus explainability
London, A.J., 2019. Artificial intelligence and black-box medical decisions: accuracy versus explainability. Hastings Center Report 49, 15–21
2019
-
[23]
Preserving causal constraints in counterfactual explanations for machine learning classifiers
Mahajan, D., Tan, C., Sharma, A., 2019. Preserving causal constraints in counterfactual explanations for machine learning classifiers. arXiv preprint arXiv:1912.03277
2019 arXiv
-
[24]
Optimal counterfactual explanations in tree ensembles, in: International conference on machine learning, PMLR
Parmentier, A., Vidal, T., 2021. Optimal counterfactual explanations in tree ensembles, in: International conference on machine learning, PMLR. pp. 8422– 8431
2021
-
[25]
Revisiting k-sum optimization
Puerto, J., Rodriguez-Chia, A., Tamir, A., 2017. Revisiting k-sum optimization. Mathematical Programming 165, 579—-604
2017
-
[26]
In- terpretable machine learning: Fundamental principles and 10 grand challenges
Rudin, C., Chen, C., Chen, Z., Huang, H., Semenova, L., Zhong, C., 2022. In- terpretable machine learning: Fundamental principles and 10 grand challenges. Statistic Surveys 16, 1–85
2022
-
[27]
Interpretable counterfactual explanations guided by prototypes, in: Joint European Conference on Machine Learning and Knowledge Discovery in Databases, Springer
Van Looveren, A., Klaise, J., 2021. Interpretable counterfactual explanations guided by prototypes, in: Joint European Conference on Machine Learning and Knowledge Discovery in Databases, Springer. pp. 650–665
2021
-
[28]
Counterfactual explanations and algorithmic recourses for machine learning: A review
Verma, S., Boonsanong, V., Hoang, M., Hines, K., Dickerson, J., Shah, C., 2024. Counterfactual explanations and algorithmic recourses for machine learning: A review. ACM Computing Surveys 56, 1–42
2024
-
[29]
A survey of l1 regression
Vidaurre, D., Bielza, C., Larranaga, P., 2013. A survey of l1 regression. Inter- national Statistical Review 81, 361–387
2013
-
[30]
Robust regression and lasso
Xu, H., Caramanis, C., Mannor, S., 2008. Robust regression and lasso. Ad- vances in neural information processing systems 21
2008
Reviewed August 11, 2026 · model on record in the stance chip above.
Discussion (0). Continue with ORCID to comment.