REVIEW 2 major objections 5 minor 40 references
The Global AI Vibrancy Tool
T0 review · 2 major / 5 minor · reviewed 2026-08-12 · deepseek-v4-flash
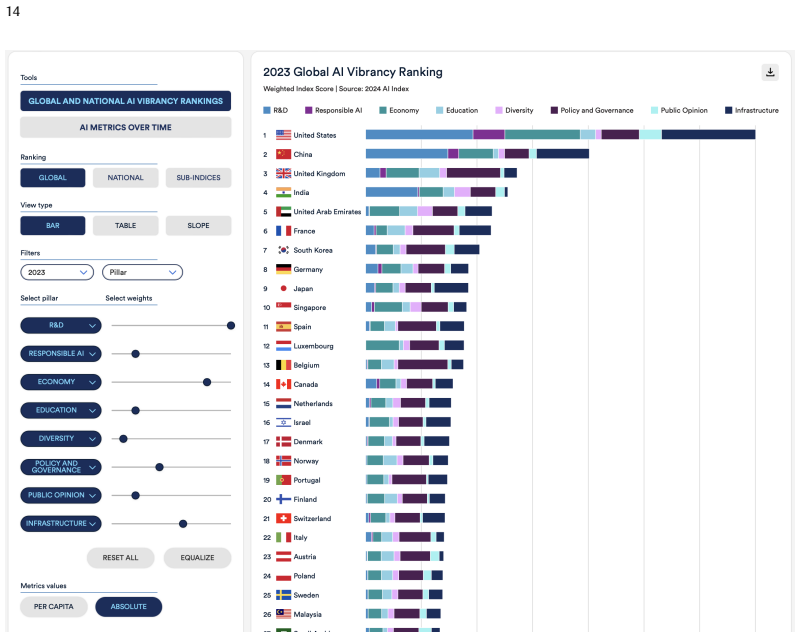
Pith's one-line read A transparent weighted index of 42 indicators ranks 36 countries by AI vibrancy, with the United States first, China second, and the UK third in 2023.
desk verdict A transparent, well-documented index update whose headline scores are arithmetically consistent but not fully reproducible from the text; still deserves a serious referee. read the letter →
The pith
A machine-rendered reading of the paper's core claim, the machinery that carries it, and where it could break.
The reading
What carries the argument
The load-bearing object is the Global AI Vibrancy Index, a composite score for each country. The paper first applies min-max normalization to each indicator, scaling every country-year value into $[0,100]$ by comparing it with the year's minimum and maximum across countries. It then computes each pillar score as the weighted average of its normalized indicators, $$p_{jk} = \frac{\sum_{i=1}^{N_j} w_{ij}x_{ijk}}{\sum_{i=1}^{N_j} w_{ij}},$$ and combines the eight pillar scores into the overall vibrancy index as the weighted average of the pillars. The weights are set by an expert budget-allocation process, with medians taken across individual expert allocations, and the tool lets users change every weight with sliders; missing indicator values are imputed with the cross-country median and, when an indicator is missing for all countries, its weight is redistributed among the remaining indicators. That machinery is what turns 42 raw data series into the headline rankings.
What would settle it
Independently rebuild the 2023 index from the public datasets using the paper's stated 42 indicators, min-max normalization, median imputation, and the published pillar and indicator weights; if the computed scores do not reproduce the reported United States 70.06, China 40.17, and United Kingdom 27.21, the published ranking is not reproducible. As a robustness check, recompute the same index with equal weights: if the top three changes, the ordering is an artifact of the weight choice, which the paper itself already flags.
Extended reading notes
Core claim
In the paper's own terms, the discovery is a workable measurement of national AI vibrancy: a composite index built from publicly available data, with weights fixed by a panel of experts, that can be recomputed by any user through interactive controls. Applied to 2023, the index gives the United States a total weighted score of 70.06 against China's 40.17 and the United Kingdom's 27.21, and the paper reports that the United States has held the top position since 2018. It also reports that per-capita rankings reorder the field, with Luxembourg first at 46.84 and Singapore second at 43.72, and that the three sub-indices reveal different leaders in innovation, economic competitiveness, and policy and public engagement. The paper is candid that the ordering depends on the weighting schema and that gaps among countries ranked outside the top few are small enough for weight changes to shift positions.
Load-bearing premise
The load-bearing premise is that the expert-chosen weights on the eight pillars and 42 indicators reflect how much each component really contributes to a country's AI vibrancy; if those weights are arbitrary or biased, the headline ordering loses its authority.
Editorial extensions
If this is right
- If the index and its default weights are accepted, the 2023 absolute ranking is United States 70.06, China 40.17, United Kingdom 27.21, with the United States in first place every year since 2018.
- Under the per-capita view, Luxembourg ranks first at 46.84 and Singapore second at 43.72, so a small country's AI activity can look strong when population is taken into account.
- Because users can adjust every pillar and indicator weight, the tool can answer conditional questions, such as which country leads when policy and governance matter more than investment, rather than imposing a single ordering.
- The three sub-indices allow separate benchmarking of innovation, economic competitiveness, and policy and public engagement, so a country that ranks low overall can still be tracked on the dimension where it leads.
- Countries outside the top three are closely clustered, so relatively small gains in measured indicators can move a country's rank, making the middle and lower tiers sensitive to single-year outliers and weight choices.
Reading between the lines
- Beyond the paper, the close nine-point spread between third and tenth place suggests the headline ordering is best read as one member of a family of defensible orderings; a user who weights education or governance differently could plausibly produce a different top ten.
- Beyond the paper, the per-capita results imply AI vibrancy does not require national scale, so small countries may be able to climb the ranking through targeted policies such as fast internet, AI talent migration, and investor incentives; one test would be whether Luxembourg and Singapore's top per-capita positions persist as more countries adopt the same levers.
- Beyond the paper, several weightable indicators are direct policy outputs (national AI strategy, AI legislation, AI study programs), so governments that respond to the ranking may see their measured vibrancy rise without any underlying capability change; tracking countries that adopted AI strategies after 2018 would test this.
Editorial analysis
A structured set of objections, weighed in public.
Referee Report
Summary. The manuscript describes the Global AI Vibrancy Tool (GVT), an interactive web platform that compares 36 countries on 42 AI-related indicators grouped into eight pillars. It reports the data sources, gives the normalization and aggregation formulas (Eqs. 1-3), lists the default expert-chosen weights, and presents the 2023 headline ranking: United States 70.06, China 40.17, United Kingdom 27.21. It also presents per-capita rankings, three sub-indices, and a limitations section. The paper is primarily a tool description, but it makes a concrete empirical claim: under the stated methodology and weights, the 2023 ordering is US, China, UK with a substantial US lead.
Significance. The paper's main value is its transparency about a widely used benchmarking tool: indicator definitions, coverage statistics, default weights, and the index formulas are all reported, and the interactive interface lets users change weights. The headline ranking is a falsifiable, reproducible statement only if the exact data and imputation pipeline are specified; the manuscript currently leaves the most fragile part of that pipeline underspecified. If the authors supply the missing specification and ideally release code and data, the GVT would be a credible contribution to AI policy benchmarking. The explicit caveats about weight sensitivity and data coverage are an honest strength, but they are not a substitute for quantitative robustness checks.
major comments (2)
- [4.3.1, Eq. (1)] Section 4.3.1 states that missing values are imputed with the median of each indicator across all countries for each year and that indicators missing for all countries are excluded with weight redistribution, but the exact convention is underspecified. In particular, the text does not state whether the median is computed on observed raw values before normalization, whether the min and max in Eq. (1) are computed over the observed-plus-imputed set, and whether an indicator excluded because it is missing for all countries still contributes to the min/max calculation in years before exclusion. These details matter because Table 11 shows very different country-level coverage (e.g., Turkey at 26-60%, Canada and the US at 100%) and Table 12 shows indicators with sparse coverage such as Foundation Models at 42% in 2023 and Open Access Foundation Models at 36%. With country-dependent missingness, median imputation creates imputed values that depend on which countries are observed, and the subsequent min-max normalization in Eq. (1) is sensitive to those imputed values. As a result, the headline scores 70.06, 40.17, and 27.21 are not reproducible from the manuscript alone. Please specify the full pipeline, including the exact order of imputation, exclusion, and normalization, and provide the data and code used to generate the reported scores.
- [6.3, Tables 9-10, Eq. (3)] The paper acknowledges in Section 6.3 that the rankings heavily depend on the weighting schema, but it does not test this dependence quantitatively. Because the default weights are free parameters chosen by the AI Index team and include zero weights for indicators with limited coverage, the central claim that the US leads by a significant margin could be an artifact of one particular weight vector. A reader cannot tell from the paper whether the top-three order (US, China, UK) survives plausible perturbations of the indicator and pillar weights. Please add a sensitivity analysis, for example perturbing weights around the reported values, drawing from the four expert allocations, or leaving out individual indicators, and report how often the headline top-three order and the approximate score gaps change. This would turn the acknowledged limitation into a robustness statement.
minor comments (5)
- [6, per capita rankings] Section 6 introduces a per-capita ranking in which Luxembourg ranks first with a score of 46.84, but the methodology never states how the per-capita adjustment is computed. Please add the per-capita formula, since it changes the headline ordering.
- [4.3.2 and Appendix D] Section 4.3.2 says the median weight was selected for each pillar and indicator, but Appendix D describes post-hoc adjustments based on data coverage. Please clarify whether Table 10 is the median expert allocation or the result of those adjustments.
- [4.1 and Table 2] The paper says all data are public and Table 2 lists sources, but it does not provide a repository or direct link for the merged dataset or the code implementing Eqs. (1)-(3). A permanent data/code link would materially help readers verify the reported scores.
- [Appendix F and sub-indices] In Table 12, several indicators are marked N/A for early years (e.g., AI Social Media Posts and Net Migration Flow of AI Skills), and Section 4.3.1 says such indicators are excluded. It is not stated whether the same exclusion and weight-redistribution rule is applied in the per-capita view and in the three sub-indices; please make the sub-index data handling explicit.
- [Figures 7-19] Many figures have only a number as their caption (e.g., 'Fig. 7' or 'Fig. 14') and are introduced in the text without descriptive captions. Descriptive captions would improve readability and help readers connect the figures to the claims.
Circularity Check
No significant circularity: the ranking is a transparent weighted aggregation of public indicators, with weight sensitivity acknowledged by the authors.
full rationale
The paper makes no predictive claim that would require independent evidence. It constructs a composite index from 42 indicators, expert-chosen weights, min-max normalization, and median imputation, then reports the resulting ordering. The headline ranking is the arithmetic consequence of equations (1)-(3) together with the stated data and weights, not a fitted parameter that is later relabeled as a prediction. Section 6.3 explicitly discloses that the rankings depend heavily on the weighting schema and encourages users to adjust weights, so the authors do not present the US-China-UK ordering as weight-independent or externally validated. Self-citations to the AI Index reports serve to define the underlying indicators and are not invoked to forbid alternatives or to lend authority to the weighting choice. The skeptical concerns about median imputation and normalization affect reproducibility and robustness, but they are not circularity: the result is an explicit, albeit underspecified, transformation of inputs rather than an input recycled as an output. The derivation chain is self-contained: data plus stated equations plus transparently described weights yield the ranking, with no step that reduces to its own conclusion by construction.
Assumptions & free parameters
free parameters (51)
- Pillar weight: Research and Development =
10
- Pillar weight: Responsible AI =
2
- Pillar weight: Economy =
8
- Pillar weight: Education =
2
- Pillar weight: Diversity =
1
- Pillar weight: Policy and Governance =
4
- Pillar weight: Public Opinion =
2
- Pillar weight: Infrastructure =
6
- Indicator weight (R&D): AI Journal Publications =
8
- Indicator weight (R&D): AI Journal Citations =
8
- Indicator weight (R&D): AI Conference Publications =
6
- Indicator weight (R&D): AI Conference Citations =
7
- Indicator weight (R&D): AI Patent Grants =
8
- Indicator weight (R&D): Notable Machine Learning Models =
9
- Indicator weight (R&D): Academia-Industry Model Production Concentration =
0
- Indicator weight (R&D): Foundation Models =
3
- Indicator weight (R&D): Foundation Models Datasets =
3
- Indicator weight (R&D): Foundation Models Applications =
3
- Indicator weight (R&D): Open Access Foundation Models =
0
- Indicator weight (R&D): AI GitHub Projects =
7
- Indicator weight (R&D): AI GitHub Projects Stars =
8
- Indicator weight (Responsible AI): FAccT Conference Submissions on RAI Topics =
7
- Indicator weight (Responsible AI): NeurIPS Conference Submissions on RAI Topics =
10
- Indicator weight (Responsible AI): ICML Conference Submissions on RAI Topics =
8
- Indicator weight (Responsible AI): ICLR Conference Submissions on RAI Topics =
7
- Indicator weight (Responsible AI): AIES Conference Submissions on RAI Topics =
6
- Indicator weight (Responsible AI): AAAI Conference Submissions on RAI Topics =
8
- Indicator weight (Economy): Total AI Private Investment =
10
- Indicator weight (Economy): Total AI Merger/Acquisition Investment =
9
- Indicator weight (Economy): Total AI Minority Stake Investment =
7
- Indicator weight (Economy): Total AI Public Offering Investment =
7
- Indicator weight (Economy): Newly Funded AI Companies =
9
- Indicator weight (Economy): AI Hiring Rate YoY Ratio =
6
- Indicator weight (Economy): Relative AI Skill Penetration =
3
- Indicator weight (Economy): AI Talent Concentration =
6
- Indicator weight (Economy): AI Job Postings (% of Total) =
0
- Indicator weight (Economy): Net Migration Flow of AI Skills =
6
- Indicator weight (Education): AI Study Programs in English =
6
- Indicator weight (Education): AI Study Programs in English Penetration =
7
- Indicator weight (Diversity): AI Talent Concentration Gender Equality Index =
10
- Indicator weight (Policy and Governance): National AI Strategy Presence =
10
- Indicator weight (Policy and Governance): AI Legislation Passed =
10
- Indicator weight (Policy and Governance): AI Mentions in Legislative Proceedings =
6
- Indicator weight (Public Opinion): Social Media Share of Voice on AI =
8
- Indicator weight (Public Opinion): AI Social Media Posts =
6
- Indicator weight (Public Opinion): AI-Related Social Media Conversations Net Sentiment =
9
- Indicator weight (Infrastructure): Parts Semiconductor Devices Exports =
10
- Indicator weight (Infrastructure): Supercomputers =
9
- Indicator weight (Infrastructure): Compute Capacity (Rmax) =
10
- Indicator weight (Infrastructure): Internet Speed =
8
- Data coverage threshold =
70% averaged over last three years
assumptions (6)
- domain assumption The 42 indicators collectively measure AI vibrancy
- domain assumption Expert-assigned weights reflect the true relative importance of pillars and indicators
- domain assumption Missing data can be imputed with the cross-country median without systematic bias
- domain assumption Commercial data sources (LinkedIn, QUID, Lightcast) provide representative cross-country coverage
- standard math Min-max normalization across countries yields meaningful comparability
- ad hoc to paper The 70% data coverage threshold is sufficient for valid cross-country comparison
Cite this review
Pith. "Pith review of The Global AI Vibrancy Tool." pith.science (2026). https://pith.science/paper/5KDHVWGH
@misc{pith2026241204486,
  author       = {Pith},
  title        = {Pith review of: The Global AI Vibrancy Tool},
  year         = {2026},
  howpublished = {\url{https://pith.science/paper/5KDHVWGH}},
  note         = {Machine review of arXiv:2412.04486}
}
read the original abstract
This paper presents the latest version of the Global AI Vibrancy Tool (GVT), an interactive suite of visualizations designed to facilitate the comparison of AI vibrancy across 36 countries, using 42 indicators organized into 8 pillars. The tool offers customizable features that allow users to conduct in-depth country-level comparisons and longitudinal analyses of AI-related metrics, all based on publicly available data. By providing a transparent assessment of national progress in AI, it serves the diverse needs of policymakers, industry leaders, researchers, and the general public. Using weights for indicators and pillars developed by AI Index's panel of experts and combined into an index, the Global AI Vibrancy Ranking for 2023 places the United States first by a significant margin, followed by China and the United Kingdom. The ranking also highlights the rise of smaller nations such as Singapore when evaluated on both absolute and per capita bases. The tool offers three sub-indices for evaluating Global AI Vibrancy along different dimensions: the Innovation Index, the Economic Competitiveness Index, and the Policy, Governance, and Public Engagement Index.
Figures


Figures from the paper (3 more)


Reference graph
Works this paper leans on
-
[1]
WDI - The World by Income and Region. URL https://datatopics.worldbank.org/world-development-indicators/the- world-by-income-and-region.html
-
[2]
Human Development Report. Technical report, United Nations Development Programme (UNDP), New York Oxford University Press, 1990. URL https://hdr.undp.org/system/files/documents/hdr1990encompletenostats.pdf
work page 1990
-
[3]
Live data from OECD.AI, 2024. URL https://oecd.ai/en/data
work page 2024
-
[4]
URL https://www.ookla.com/ookla-for-good/open-data
Ookla’s Open Data Initiative, 2024. URL https://www.ookla.com/ookla-for-good/open-data
work page 2024
-
[5]
URL https://www.top500.org/statistics/list/
TOP500, 2024. URL https://www.top500.org/statistics/list/
work page 2024
-
[6]
The Economics of Artificial Intelligence: An Agenda
Ajay Agrawal, Joshua Gans, and Avi Goldfarb, editors. The Economics of Artificial Intelligence: An Agenda . National Bureau of Economic Research Conference Report. University of Chicago Press, Chicago, IL, May 2019. ISBN 978-0- 226-61333-8. URL https://press.uchicago.edu/ucp/books/book/chicago/E/bo35780726.html
work page 2019
-
[7]
Data on Notable AI Models, 2024
Epoch AI. Data on Notable AI Models, 2024. URL https://epochai.org/data/notable-ai-models#explore-the-data
work page 2024
-
[8]
Eric Schmidt says China can’t catch up to US in AI for 4 reasons
Ana Altchek. Eric Schmidt says China can’t catch up to US in AI for 4 reasons. Business Insider, May 2024. URL https://www.businessinsider.com/eric-schmidt-comments-china-behind-united-states-ai-2024-5
work page 2024
Show all 40 references
-
[9]
AI and Compute, 2018
Dario Amodei and Danny Hernandez. AI and Compute, 2018. URL https://openai.com/index/ai-and-compute/
2018
-
[10]
The technological capabilities of nations: The state of the art of synthetic indicators
Daniele Archibugi, Mario Denni, and Andrea Filippetti. The technological capabilities of nations: The state of the art of synthetic indicators. Technological Forecasting and Social Change , 76(7):917–931, September 2009. URL https://linkinghub.elsevier.com/retrieve/pii/S004016...
2009
-
[11]
Liao, Kathleen A
Rishi Bommasani, Dilara Soylu, Thomas I. Liao, Kathleen A. Creel, and Percy Liang. Ecosystem Graphs: The Social Footprint of Foundation Models, March 2023. URL http://arxiv.org/abs/2303.15772
2023 arXiv
-
[12]
Panton, Carlo Pizzinelli, Emma Rockall, and Marina M
Mauro Cazzaniga, Florence Jaumotte, Longji Li, Giovanni Melina, Augustus J. Panton, Carlo Pizzinelli, Emma Rockall, and Marina M. Tavares. Gen-AI: Artificial Intelligence and the Future of Work, 2024. URL https://www.imf.org/en/Publications/Staff-Discussion-Notes/Issues/2024/0...
2024
-
[13]
The Global AI Index
Serena Cesareo and Joseph White. The Global AI Index. URL https://www.tortoisemedia.com/intelligence/global-ai/. Tortoise Media
-
[14]
Measuring the Technology Achievement of Nations and the Capacity to Participate in the Network Age
Meghnad Desai, Sakiko Fukuda-Parr, Claes Johansson, and Fransisco Sagasti. Measuring the Technology Achievement of Nations and the Capacity to Participate in the Network Age. Journal of Human Development , 3(1):95–122, February
-
[15]
Siewert, and Stefan Wurster
Christian Djeffal, Markus B. Siewert, and Stefan Wurster. Role of the state and responsibility in governing artificial intelligence: a comparative analysis of AI strategies. Journal of European Public Policy , 29(11):1799–1821, November
-
[16]
America takes on China with a giant microchips bill
The Economist. America takes on China with a giant microchips bill. The Economist, July 2022. URL https://www. economist.com/united-states/2022/07/29/america-takes-on-china-with-a-giant-microchips-bill
2022
-
[17]
Furman, Michael E
Jeffrey L. Furman, Michael E. Porter, and Scott Stern. The determinants of national innovative capacity.Research Policy, 31(6):899–933, 2002. ISSN 0048-7333. URL https://www.sciencedirect.com/science/article/pii/S0048733301001524. 30
2002
-
[18]
BACI: International Trade Database at the Product-Level (the 1994-2007 Version)
Guillaume Gaulier and Soledad Zignago. BACI: International Trade Database at the Product-Level (the 1994-2007 Version). SSRN Electronic Journal, 2010. ISSN 1556-5068. URL http://www.ssrn.com/abstract=1994500
1994
-
[19]
Introducing the AI Safety Institute
UK Government. Introducing the AI Safety Institute. UK Department for Science, Innovation and Technology , 2023
2023
-
[20]
AI Safety Summit 2023 - GOV.UK, February 2024
UK Government. AI Safety Summit 2023 - GOV.UK, February 2024. URL https://www.gov.uk/government/topical- events/ai-safety-summit-2023
2023
-
[21]
On the Methodological Framework of Composite Indices: A Review of the Issues of Weighting, Aggregation, and Robustness
Salvatore Greco, Alessio Ishizaka, Menelaos Tasiou, and Gianpiero Torrisi. On the Methodological Framework of Composite Indices: A Review of the Issues of Weighting, Aggregation, and Robustness. Social Indicators Research, 141 (1):61–94, January 2019. URL https://doi.org/10.10...
2019 doi
-
[22]
2023 Government AI Readiness Index
Emma Hankins, Pablo Fuentes Nettel, Livia Martinescu, Gonzalo Grau, and Sulamaan Rahim. 2023 Government AI Readiness Index. URL https://oxfordinsights.com/ai-readiness/ai-readiness-index/
2023
-
[23]
Measuring the technology achievement index: comparison and ranking of countries
Ahmet Incekara, Tugba Guz, and Gulden Sengun. Measuring the technology achievement index: comparison and ranking of countries. Journal of Economics, Finance and Accounting , 4(2):164–174, June 2017. URL http://www. pressacademia.org/images/documents/jefa/archives/vol_4_issue_2/11.pdf
2017
-
[24]
Artificial Intelligence Index Report 2023, October 2023
Nestor Maslej, Loredana Fattorini, Erik Brynjolfsson, John Etchemendy, Katrina Ligett, Terah Lyons, James Manyika, Helen Ngo, Juan Carlos Niebles, Vanessa Parli, Yoav Shoham, Russell Wald, Jack Clark, and Raymond Perrault. Artificial Intelligence Index Report 2023, October 202...
2023 arXiv
-
[25]
The AI Index 2024 Annual Report, April 2024
Nestor Maslej, Loredana Fattorini, Raymond Perrault, Vanessa Parli, Anka Reuel, Erik Brynjolfsson, John Etchemendy, Katrina Ligett, Terah Lyons, James Manyika, Juan Carlos Niebles, Yoav Shoham, Russell Wald, and Jack Clark. The AI Index 2024 Annual Report, April 2024. URL http...
2024 arXiv
-
[26]
Tools for Composite Indicators Building
Michela Nardo, Michaela Saisana, Andrea Saltelli, and Stefano Tarantola. Tools for Composite Indicators Building. Technical report, European Comission, January 2005. URL https://publications.jrc.ec.europa.eu/repository/handle/ JRC31473
2005
-
[27]
Handbook on Constructing Composite Indicators: Methodology and User Guide
OECD, European Union, and EC-JRC. Handbook on Constructing Composite Indicators: Methodology and User Guide
-
[28]
Artificial Intelligence in Education: Challenges and Opportunities for Sustainable Development
Francesc Pedro, Miguel Subosa, Axel Rivas, and Paula Valverde. Artificial Intelligence in Education: Challenges and Opportunities for Sustainable Development. UNESCO, 2019. URL https://repositorio.minedu.gob.pe/bitstream/ handle/20.500.12799/6533/Artificial%20intelligence%20in...
2019
-
[29]
The UAE Is on a Mission to Become an AI Power, March 2024
Billy Perrigo. The UAE Is on a Mission to Become an AI Power, March 2024. URL https://time.com/6958369/artificial- intelligence-united-arab-emirates/
2024
-
[30]
France’s AI Summit Is a Chance to Reshape Global Narratives on AI, July 2024
Hadrien Pouget. France’s AI Summit Is a Chance to Reshape Global Narratives on AI, July 2024. URL https: //carnegieendowment.org/posts/2024/07/france-ai-summit-reshape-global-narrative?lang=en
2024
-
[31]
Steering the governance of artificial intelligence: national strategies in perspective
Roxana Radu. Steering the governance of artificial intelligence: national strategies in perspective. Policy and Society, 40(2):178–193, April 2021. ISSN 1449-4035, 1839-3373. URL https://academic.oup.com/policyandsociety/article/40/2/ 178/6509308
2021
-
[32]
COIN tool – User guide
Michaela Saisana, Daniel Vertesy, Ana Neves, Daniela Benavente, William Becker, Carlos Moura, and Marcos Dominguez-Torreiro. COIN tool – User guide . European Commission, Joint Research Centre, 2019. URL https: //data.europa.eu/doi/10.2760/523877
2019 doi
-
[33]
Minding the gap(s): public perceptions of AI and socio-technical imaginaries
Laura Sartori and Giulia Bocca. Minding the gap(s): public perceptions of AI and socio-technical imaginaries. AI & SOCIETY, 38(2):443–458, April 2023. ISSN 1435-5655. URL https://doi.org/10.1007/s00146-022-01422-1
2023 doi
-
[34]
Toward the AI Index
Yoav Shoham. Toward the AI Index. AI Magazine, 38(4):71–77, 2017. URL https://onlinelibrary.wiley.com/doi/abs/10. 1609/aimag.v38i4.2761
2017
-
[35]
China Is Closing the A.I
Meaghan Tobin and Cade Metz. China Is Closing the A.I. Gap With the United States. The New York Times, July 2024. ISSN 0362-4331. URL https://www.nytimes.com/2024/07/25/technology/china-open-source-ai.html
2024
-
[36]
HDR 2010 - The Real Wealth of Nations: Pathways to Human Development
UNDP (United Nations Development Programme). HDR 2010 - The Real Wealth of Nations: Pathways to Human Development. Technical report, 2010. URL https://EconPapers.repec.org/RePEc:hdr:report:hdr2010
2010
-
[37]
skill genome
Didar Zowghi and Francesca da Rimini. Diversity and Inclusion in Artificial Intelligence, May 2023. URL http: //arxiv.org/abs/2305.12728. 31 APPENDIX A LIST OF COUNTRIES To ensure the quality and representativeness of the analysis, a data coverage threshold of 70%, averaged ov...
2023 arXiv
-
[2002]
URL https://doi.org/10.1080/14649880120105399
-
[2008]
URL https://www.oecd-ilibrary.org/content/publication/9789264043466-en
-
[2022]
URL https://doi.org/10.1080/13501763.2022.2094987
ISSN 1350-1763. URL https://doi.org/10.1080/13501763.2022.2094987
2022
Reviewed August 12, 2026 · model on record in the stance chip above.
Discussion (0). Continue with ORCID to comment.