REVIEW 4 major objections 5 minor 1 cited by
Beyond Reweighting: On the Predictive Role of Covariate Shift in Effect Generalization
T0 review · 4 major / 5 minor · reviewed 2026-08-11 · deepseek-v4-flash
Pith's one-line read Analyzing 680 replication studies across 65 sites, this paper argues that the unobservable conditional shift in effect generalization can often be bounded by the observable covariate shift, and that prediction intervals built on this…
desk verdict A valuable empirical regularity about covariate shift bounding conditional shift, but the theoretical support in Section 3.3 does not actually deliver the high-probability bound the paper's constant calibration relies on. read the letter →
The pith
A machine-rendered reading of the paper's core claim, the machinery that carries it, and where it could break.
The reading
What carries the argument
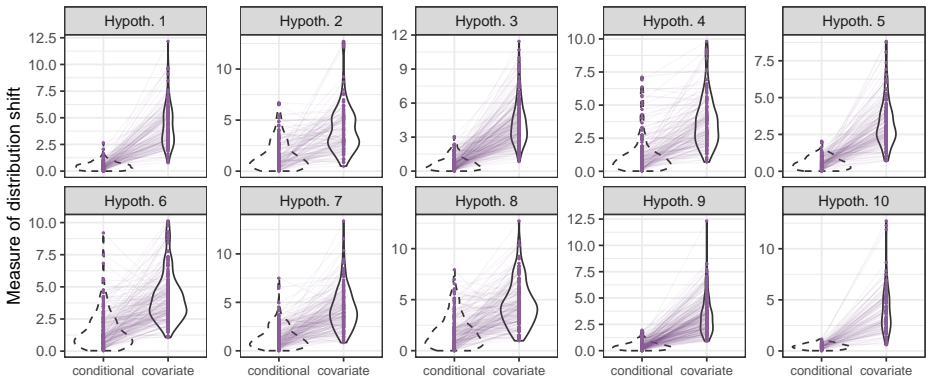
The machinery is a pair of scale-invariant, pivotal shift measures together with a random distribution shift model. The conditional-shift measure rescales the shift in the influence function after covariate reweighting by its source standard deviation, while the covariate-shift measure is a stabilized root-mean-square of standardized covariate mean differences; the paper shows that alternative unscaled or unstabilized measures either fail to reveal the bound or produce unstable intervals. The theoretical mechanism reweights $M$ equal-probability cells of $(X,U)$ by i.i.d. positive weights $W_m$ with finite variance, keeps treatment $T$ independent with fixed assignment probability, and takes $M\to\infty$ with $n_P/M$ and $n_Q/M$ of constant order. The distributional CLT inflates the variance of a sample mean by $\delta_M^2\mathrm{Var}_P(E_P[\psi|X,U])$, which is no larger for $\psi=\phi-\phi_P(X)$ than the corresponding inflation for a covariate. That ordering is what makes the conditional-shift pivot stochastically smaller than the covariate-shift pivot and licenses the constant calibration $L=-1, U=1$ for prediction intervals.
What would settle it
Engineer a directional shift--for example, use a student-sample site as source and a target site that enrolled only middle-aged participants--and compute the paper's two pivot measures over many site pairs; if $|t_{Y|X}|>t_X$ in a substantial fraction of pairs, the proposed bound fails. Alternative: simulate the random-shift model with one cell of $(X,U)$ receiving a single large weight, which violates the model's direction-agnostic assumption and should break the stochastic ordering.
Extended reading notes
Core claim
The central claim is that covariate shift, although insufficient for explaining away distribution shift, is predictive of the unknown conditional shift when both are quantified by the paper's standardized measures: the relative conditional shift $t_{Y|X} = |E_Q[\phi-\phi_P(X)]|/\mathrm{sd}_P(\phi-\phi_P(X))$ and the stabilized covariate shift $t_X = \left(L^{-1}\sum_{\ell=1}^{L}(E_Q[X_\ell]-E_P[X_\ell])^2/\mathrm{Var}_P(X_\ell)\right)^{1/2}$. Across site pairs in both replication projects, $|t_{Y|X}|/t_X \le 1$ holds with high probability, and the empirical quantiles of this ratio track normal quantiles. The paper explains this through a random distribution shift model whose distributional central limit theorem (Theorem 3.3) makes the squared conditional-shift statistic stochastically smaller than the squared covariate-shift statistic because $\mathrm{Var}_P(E_P[\psi|X,U])/\mathrm{Var}_P(\psi) \le 1$. The paper then builds prediction intervals that invert the ratio bound, and reports that they maintain nominal coverage while being substantially shorter than worst-case KL-ball intervals.
Load-bearing premise
The load-bearing premise is that the difference between source and target populations comes from many small, accidental, directionless changes in who is sampled, with the treatment assignment rule unchanged; if the shift is deliberate or directional, such as a target site that recruits a different kind of participant, the covariate shift may no longer bound the conditional shift.
Editorial extensions
If this is right
- With no auxiliary data, setting the ratio bound to $[-1,1]$ yields 95% prediction intervals for target estimates that the paper reports as near-nominal in coverage across both projects.
- With auxiliary data from other hypotheses or sites, data-adaptive calibration of the ratio quantiles gives intervals close to an oracle that knows the true relative shift strengths.
- Under the random distribution shift model, standardized conditional shift is stochastically dominated by standardized covariate shift, so the bound does not require an adversarial choice of the target distribution.
- The failure of covariate shift to explain away distribution shift does not make covariate data useless; the same covariates provide the usable upper bound needed for reliable uncertainty quantification.
Reading between the lines
- A corollary the paper leaves implicit: the stability of the ratio across hypotheses makes the covariate-shift measure a natural reporting metric--a small covariate shift, under non-adversarial sampling, would certify a small upper bound on the hidden shift.
- The same logic should extend to observational transportability and policy evaluation, but that requires an influence-function analog for non-randomized designs; the paper's theory is built on fixed treatment assignment.
- The random-shift model yields a testable data-collection rule: if shifts are non-adversarial, measuring covariates most affected by the shift should reduce distributional uncertainty more than simply adding more observations to the source sample.
- The normal-shaped quantile curves suggest a sharper alternative to the constant bound: regress $|t_{Y|X}|$ on $t_X$ across replication archives and use the fitted upper quantile, which would tighten intervals when covariate shift is large.
Signed reviews
Editorial analysis
A structured set of objections, weighed in public.
Referee Report
Summary. The paper studies generalization of experimental effect estimates from a source population to a target population when only covariates are observed in the target. It proposes standardized "pivotal" measures of covariate shift and conditional shift, reports on two large-scale replication projects (Pipeline and Many Labs 1) that the conditional shift measure is usually bounded by the covariate shift measure, introduces a random distribution shift model as a theoretical explanation, and constructs prediction intervals for the target estimator that exploit this bounding relationship using either constant bounds L=-1, U=1 or data-adaptive calibration. The empirical evaluation is based on coverage of prediction intervals across site pairs.
Significance. If the reported pattern is real, it offers a practically useful alternative to both the covariate-shift assumption and worst-case bounds, with substantially shorter prediction intervals. The paper's strengths are its large-scale empirical evaluation (680 studies, 65 sites), the use of prediction intervals for faithful evaluation, the ablation study in Appendix D showing the importance of scale invariance and stability, and the availability of reproducible code. However, the theoretical support is heuristic, and the empirical evidence is limited to the two datasets used to design the measures, so the central claim needs additional validation before the method can be recommended for general use.
major comments (4)
- [§3.3, Eqs. (5)–(7)] The distributional CLT does not imply the high-probability bound |t_Y|X| ≤ t_X used in constant calibration. Comparing Eq. (5) and Eq. (7), the conditional shift statistic behaves as (A + δ²R²)χ²₁ while the stabilized covariate statistic behaves as (A + δ²)χ²_L/L with A = 1/n_P + 1/n_Q and R² = Var_P(E_P[ψ|X,U])/Var_P(ψ) ≤ 1. For finite L (about 7–10 in the applications), the heavy tail of χ²₁ makes it quite likely that the realized conditional shift measure exceeds the covariate shift measure even when R² = 1; for example, with L = 7 and A = 0, P(χ²₁ > χ²_7/7) is roughly 0.3. Thus the model itself predicts that the bound fails with non-negligible probability, contradicting the paper's characterization that the model justifies the approximately 95% frequency of the bound in Figure 4. The constant-calibration interval in §4.1 relies on this high-probability bound, so either a stronger theoretical statement must be provided or the constant calibration must be presented as an additional empirical assumption rather than a consequence of the random-shift model.
- [§3.3, Eq. (5) and Eq. (4)] The derivation of the conditional shift measure ignores the estimation of ϕ_P(X), with the phrase "ignoring the estimation of ϕ_P(X) for simplicity" before Eq. (5), and the stabilized covariate measure (4) is justified only informally as "roughly because the perturbations are homogeneous in different directions." These two gaps mean that the theoretical model does not actually derive the exact standardized measures used in the empirical analysis. The authors should either provide an asymptotic derivation that accounts for the estimated nuisance function (for example, using the influence-function expansion in Appendix E.2) or explicitly state the regime in which the estimation error is asymptotically negligible, and they should give a more formal justification for replacing the relative covariate measure (3) by the stabilized measure (4).
- [§4.2, Figures 7–8] The empirical coverage results are presented without any uncertainty quantification. For instance, Figure 7(a) reports coverage averaged over site pairs for each hypothesis, but with only 10–36 sites per hypothesis the standard error of a 0.95 coverage estimate can be several percentage points; the apparent coverage of "Ours_Const" relative to the nominal level is therefore difficult to assess. The authors should report standard errors or confidence bands for the coverage estimates, and in the data-adaptive calibration experiments (Figure 8) they should also report the variability across the 10 random permutations of the ordering, not just the average.
- [Whole paper, especially §3.2 and §4] The standardized measures and the calibration approach were designed and evaluated on the same two replication projects, with no out-of-sample validation. Since the central claim of the paper is empirical—that covariate shift can bound conditional shift when measured in this way—this is a load-bearing limitation. The scope limitation in §1.2 appropriately restricts the claim to multi-site replication studies, but it does not address the risk that the specific standardization was selected because it makes the pattern appear in these two datasets. The authors should either validate the pattern on an independent multi-site dataset (for example, Many Labs 2) or present a pre-registered analysis, or at a minimum clearly state this issue and its potential impact on the strength of the empirical conclusion.
minor comments (5)
- [§3.1] There are several typos, including "heterogenity" for "heterogeneity" and "meausures" for "measures" in the second half of Section 3.1; these should be corrected.
- [§3.2, Figure 4(c)] The legend of Figure 4(c) is confusing: the labels "0.25 * Upper/lower normal quantile" etc. do not clearly indicate which curves correspond to the empirical quantiles of the ratio and which are the reference normal quantiles; a clearer legend or a direct line-type specification would improve readability.
- [§4.2.2] In the data-adaptive calibration experiments, the paper reports averages over 10 random permutations of the study ordering but does not report the standard deviation or range of the coverage and length across permutations; adding this would help readers judge the stability of the results.
- [Eq. (9) and Appendix B.4.1] The notation for the covariate-shift-adjusted estimator varies between bθ_w in Eq. (9) and bθ_i→j in the appendix; please unify the notation to avoid confusion.
- [Appendix B.4.1] The worst-case method is explicitly acknowledged as infeasible in real generalization tasks because it uses full target outcomes to calibrate the KL bound; this is fine, but the comparison to WorstCase in Figure 7 may be viewed as overly favorable to the proposed method, so a short comment on the feasibility of each method in the figure caption would be helpful.
Circularity Check
No circular derivation; the predictive-role claim is an empirical finding with an independently proved theoretical model, and self-citations are not load-bearing.
full rationale
The paper's central claim is that a standardized, 'pivotal' covariate shift measure often upper-bounds the corresponding conditional shift measure. This is presented as an empirical pattern observed across 680 studies, not as a consequence of fitting a parameter to the evaluation target. The constant calibration L=-1 and U=1 is fixed a priori, and the data-adaptive calibration is performed on held-out hypotheses or sites rather than on the target pairs being evaluated. The theoretical random-distribution-shift model is described in the paper itself, and Theorem 3.3 is proved in Appendix E.1 rather than merely imported from prior work. Citations to Jeong and Rothenhäusler (2022, 2024) are used for modeling context and for influence-function approximations, but the main distributional CLT is derived in the appendix, so these self-citations are not load-bearing. The decomposition in equation (1) is definitional, but the bounding inequality between the two measures is an additional empirical and theoretical result, not a tautology. The skeptic's concern that equations (5)-(7) compare variance factors rather than establishing a high-probability finite-L bound is a legitimate correctness gap, but it is not a circular reduction: the paper does not define the covariate shift measure in terms of the conditional shift measure, nor does it fit any constant to the coverage outcomes used for evaluation. The authors also explicitly limit the scope in Section 1.2, acknowledging that adversarial or directional shifts can break the bound, which further indicates that the claim is not asserted as a definitional identity. Overall, the derivation chain is self-contained enough for a non-circularity finding.
Assumptions & free parameters
assumptions (6)
- domain assumption Random weights W_m are i.i.d., positive, bounded away from zero, with finite variance.
- domain assumption Treatment indicator T is independent of (X,U) and its distribution is invariant across P and Q.
- domain assumption The sequences n_Q/M and n_P/M converge to positive constants as M tends to infinity.
- domain assumption Covariates in the replication data are approximately uncorrelated, so the stabilized measure (4) approximates a Mahalanobis version.
- standard math Nuisance functions in the variance estimation satisfy convergence rates o_P(n^{-1/4}) and product conditions o_P(1).
- standard math Standard probabilistic tools: Lindeberg CLT, Berry-Esseen bound, Slutsky's theorem, and dominated convergence.
Cite this review
Pith. "Pith review of Beyond Reweighting: On the Predictive Role of Covariate Shift in Effect Generalization." pith.science (2026). https://pith.science/paper/53VKJYTM
@misc{pith2026241208869,
  author       = {Pith},
  title        = {Pith review of: Beyond Reweighting: On the Predictive Role of Covariate Shift in Effect Generalization},
  year         = {2026},
  howpublished = {\url{https://pith.science/paper/53VKJYTM}},
  note         = {Machine review of arXiv:2412.08869}
}
read the original abstract
Many existing approaches to generalizing statistical inference amidst distribution shift operate under the covariate shift assumption, which posits that the conditional distribution of unobserved variables given observable ones is invariant across populations. However, recent empirical investigations have demonstrated that adjusting for shift in observed variables (covariate shift) is often insufficient for generalization. In other words, covariate shift does not typically ``explain away'' the distribution shift between settings. As such, addressing the unknown yet non-negligible shift in the unobserved variables given observed ones (conditional shift) is crucial for generalizable inference. In this paper, we present a series of empirical evidence from two large-scale multi-site replication studies to support a new role of covariate shift in ``predicting'' the strength of the unknown conditional shift. Analyzing 680 studies across 65 sites, we find that even though the conditional shift is non-negligible, its strength can often be bounded by that of the observable covariate shift. However, this pattern only emerges when the two sources of shifts are quantified by our proposed standardized, ``pivotal'' measures. We then interpret this phenomenon by connecting it to similar patterns that can be theoretically derived from a random distribution shift model. Finally, we demonstrate that exploiting the predictive role of covariate shift leads to reliable and efficient uncertainty quantification for target estimates in generalization tasks with partially observed data. Overall, our empirical and theoretical analyses suggest a new way to approach the problem of distributional shift, generalizability, and external validity.
Figures


Figures from the paper (18 more)




Forward citations
Cited by 1 Pith paper
-
Optimal Empirical Risk Minimization under Temporal Distribution Shifts
Under a random temporal shift model, the asymptotically optimal ERM weights solve a bias-variance trade-off, and pooling, most-recent, and exponential weighting emerge as special cases.
Reference graph
Works this paper leans on
-
[1]
C., Paulson, E., and Rothenh \"a usler, D
Bansak, K. C., Paulson, E., and Rothenh \"a usler, D. (2024). Learning under random distributional shifts. In International Conference on Artificial Intelligence and Statistics , pages 3943--3951. PMLR
work page 2024
-
[2]
Bareinboim, E. and Pearl, J. (2016). Causal Inference and the Data-Fusion Problem . Proceedings of the National Academy of Sciences , 113(27):7345--7352
work page 2016
-
[3]
Bickel, S., Br \"u ckner, M., and Scheffer, T. (2007). Discriminative learning for differing training and test distributions. In Proceedings of the 24th international conference on Machine learning , pages 81--88
work page 2007
-
[4]
Buchanan, A. L., Hudgens, M. G., Cole, S. R., Mollan, K. R., Sax, P. E., Daar, E. S., Adimora, A. A., Eron, J. J., and Mugavero, M. J. (2018). Generalizing Evidence From Randomized Trials Using Inverse Probability Of Sampling Weights . Journal of the Royal Statistical Society: Series A (Statistics in Society) , 181(4):1193--1209
work page 2018
-
[5]
T., Namkoong, H., and Yadlowsky, S
Cai, T. T., Namkoong, H., and Yadlowsky, S. (2023). Diagnosing model performance under distribution shift. arXiv preprint arXiv:2303.02011
arXiv 2023
-
[6]
Chernozhukov, V., Chetverikov, D., Demirer, M., Duflo, E., Hansen, C., Newey, W., and Robins, J. (2018). Double/debiased machine learning for treatment and structural parameters
2018
-
[7]
Cole, S. R. and Stuart, E. A. (2010). Generalizing evidence from randomized clinical trials to target populations: the actg 320 trial. American journal of epidemiology , 172(1):107--115
2010
-
[8]
Colnet, B., Mayer, I., Chen, G., Dieng, A., Li, R., Varoquaux, G., Vert, J.-P., Josse, J., and Yang, S. (2024). Causal Inference Methods for Combining Randomized Trials and Observational Studies: A Review . Statistical science , 39(1):165--191
work page 2024
Show all 52 references
-
[9]
J., and Mullinix, K
Coppock, A., Leeper, T. J., and Mullinix, K. J. (2018). Generalizability of heterogeneous treatment effect estimates across samples. Proceedings of the National Academy of Sciences , 115(49):12441--12446
2018
-
[10]
J., Robertson, S
Dahabreh, I. J., Robertson, S. E., Steingrimsson, J. A., Stuart, E. A., and Hernan, M. A. (2020). Extending Inferences from A Randomized Trial to A New Target Population . Statistics in medicine , 39(14):1999--2014
2020
-
[11]
J., Robertson, S
Dahabreh, I. J., Robertson, S. E., Tchetgen, E. J., Stuart, E. A., and Hern \'a n, M. A. (2019). Generalizing causal inferences from individuals in randomized trials to all trial-eligible individuals. Biometrics , 75(2):685--694
2019
-
[12]
and Cartwright, N
Deaton, A. and Cartwright, N. (2018). Understanding and Misunderstanding Randomized Controlled Trials . Social Science & Medicine
2018
-
[13]
and Rose, S
Degtiar, I. and Rose, S. (2023). A Review of Generalizability and Transportability . Annual Review of Statistics and Its Application , 10(1):501--524
2023
-
[14]
G., Wu, T., Tan, H., Wang, Y., Gordon, M., Viganola, D., Chen, Z., Dreber, A., Johannesson, M., et al
Delios, A., Clemente, E. G., Wu, T., Tan, H., Wang, Y., Gordon, M., Viganola, D., Chen, Z., Dreber, A., Johannesson, M., et al. (2022). Examining the generalizability of research findings from archival data. Proceedings of the National Academy of Sciences , 119(30):e2120377119
2022
-
[15]
and S \"a rndal, C.-E
Deville, J.-C. and S \"a rndal, C.-E. (1992). Calibration Estimators in Survey Sampling . Journal of the American Statistical Association , 87(418):376--382
1992
-
[16]
and Hartman, E
Egami, N. and Hartman, E. (2021). Covariate Selection for Generalizing Experimental Results: Application to A Large-scale Development Program in Uganda . Journal of the Royal Statistical Society Series A: Statistics in Society , 184(4):1524--1548
2021
-
[17]
and Hartman, E
Egami, N. and Hartman, E. (2023). Elements of external validity: Framework, design, and analysis. American Political Science Review , 117(3):1070--1088
2023
-
[18]
Gama, J., Z liobait \.e , I., Bifet, A., Pechenizkiy, M., and Bouchachia, A. (2014). A survey on concept drift adaptation. ACM computing surveys (CSUR) , 46(4):1--37
2014
-
[19]
Hainmueller, J. (2012). Entropy balancing for causal effects: A multivariate reweighting method to produce balanced samples in observational studies. Political analysis , 20(1):25--46
2012
-
[20]
Hartman, E., Grieve, R., Ramsahai, R., and Sekhon, J. S. (2015). From Sample Average Treatment Effect to Population Average Treatment Effect on the Treated . Journal of the Royal Statistical Society. Series A (Statistics in Society) , 178(3):757--778
2015
-
[21]
Holzmeister, F., Johannesson, M., B \"o hm, R., Dreber, A., Huber, J., and Kirchler, M. (2024). Heterogeneity in effect size estimates. Proceedings of the National Academy of Sciences , 121(32):e2403490121
2024
-
[22]
Horvitz, D. G. and Thompson, D. J. (1952). A generalization of sampling without replacement from a finite universe. Journal of the American statistical Association , 47(260):663--685
1952
-
[23]
J., Imbens, G
Hotz, V. J., Imbens, G. W., and Mortimer, J. H. (2005). Predicting the Efficacy of Future Training Programs Using Past Experiences at Other Locations . Journal of Econometrics , 125(1-2):241--270
2005
-
[24]
and Hong, L
Hu, Z. and Hong, L. J. (2013). Kullback-leibler divergence constrained distributionally robust optimization. Available at Optimization Online , 1(2):9
2013
-
[25]
Hudson, R. (2023). Explicating exact versus conceptual replication. Erkenntnis , 88(6):2493--2514
2023
-
[26]
Imai, K., King, G., and Stuart, E. A. (2008). Misunderstandings Between Experimentalists and Observationalists About Causal Inference . Journal of the Royal Statistical Society: Series A (Statistics in Society) , 171(2):481--502
2008
-
[27]
and Rothenh \"a usler, D
Jeong, Y. and Rothenh \"a usler, D. (2022). Calibrated inference: statistical inference that accounts for both sampling uncertainty and distributional uncertainty. arXiv preprint arXiv:2202.11886
2022 arXiv
-
[28]
and Rothenh \"a usler, D
Jeong, Y. and Rothenh \"a usler, D. (2024). Out-of-distribution generalization under random, dense distributional shifts. arXiv preprint arXiv:2404.18370
2024 arXiv
-
[29]
Jin, Y., Guo, K., and Rothenh \"a usler, D. (2023). Diagnosing the role of observable distribution shift in scientific replications. arXiv preprint arXiv:2309.01056
2023 arXiv
-
[30]
and Rothenh \"a usler, D
Jin, Y. and Rothenh \"a usler, D. (2024). Tailored inference for finite populations: conditional validity and transfer across distributions. Biometrika , 111(1):215--233
2024
-
[31]
L., Stuart, E
Kern, H. L., Stuart, E. A., Hill, J., and Green, D. P. (2016). Assessing methods for generalizing experimental impact estimates to target populations. Journal of research on educational effectiveness , 9(1):103--127
2016
-
[32]
A., Ratliff, K
Klein, R. A., Ratliff, K. A., Vianello, M., Adams Jr, R. B., Bahn \' k, S ., Bernstein, M. J., Bocian, K., Brandt, M. J., Brooks, B., Brumbaugh, C. C., et al. (2014). Investigating Variation in Replicability . Social psychology
2014
-
[33]
A., Vianello, M., Hasselman, F., Adams, B
Klein, R. A., Vianello, M., Hasselman, F., Adams, B. G., Adams Jr, R. B., Alper, S., Aveyard, M., Axt, J. R., Babalola, M. T., Bahn \' k, S ., et al. (2018). Many labs 2: Investigating variation in replicability across samples and settings. Advances in Methods and Practices in...
2018
-
[34]
R., and Johnson, E
Krefeld-Schwalb, A., Sugerman, E. R., and Johnson, E. J. (2024). Exposing omitted moderators: Explaining why effect sizes differ in the social sciences. Proceedings of the National Academy of Sciences , 121(12):e2306281121
2024
-
[35]
Lu, B., Ben-Michael, E., Feller, A., and Miratrix, L. (2023). Is It Who You Are or Where You Are? Accounting for Compositional Differences in Cross-Site Treatment Effect Variation . Journal of Educational and Behavioral Statistics , 48(4):420--453
2023
-
[36]
Lu, J., Liu, A., Dong, F., Gu, F., Gama, J., and Zhang, G. (2018). Learning under concept drift: A review. IEEE transactions on knowledge and data engineering , 31(12):2346--2363
2018
-
[37]
L., Schweinsberg, M., and Tierney, W
Madan, N., Uhlmann, E. L., Schweinsberg, M., and Tierney, W. (2016). The pipeline project
2016
-
[38]
B., B \"o ckenholt, U., and Hansen, K
McShane, B. B., B \"o ckenholt, U., and Hansen, K. T. (2022). Modeling and learning from variation and covariation. Journal of the American Statistical Association , 117(540):1627--1630
2022
-
[39]
W., Sekhon, J
Miratrix, L. W., Sekhon, J. S., Theodoridis, A. G., and Campos, L. F. (2018). Worth Weighting? How to Think About and Use Weights in Survey Experiments . Political Analysis , 26(3):275--291
2018
-
[40]
A., Banaji, M
Nosek, B. A., Banaji, M. R., and Greenwald, A. G. (2002). Math = Male, Me= Female, Therefore Math Me. Journal of personality and social psychology , 83(1):44
2002
-
[41]
Pan, S. J. and Yang, Q. (2009). A survey on transfer learning. IEEE Transactions on knowledge and data engineering , 22(10):1345--1359
2009
-
[42]
Quinonero-Candela, J., Sugiyama, M., Schwaighofer, A., and Lawrence, N. D. (2008). Dataset Shift in Machine Learning . MIT Press
2008
-
[43]
M., Rotnitzky, A., and Zhao, L
Robins, J. M., Rotnitzky, A., and Zhao, L. P. (1994). Estimation of regression coefficients when some regressors are not always observed. Journal of the American statistical Association , 89(427):846--866
1994
-
[44]
S \"a rndal, C.-E., Swensson, B., and Wretman, J. (2003). Model Assisted Survey Sampling . Springer Science & Business Media
2003
-
[45]
A., Jordan, J., Tierney, W., Awtrey, E., Zhu, L
Schweinsberg, M., Madan, N., Vianello, M., Sommer, S. A., Jordan, J., Tierney, W., Awtrey, E., Zhu, L. L., Diermeier, D., Heinze, J. E., et al. (2016). The pipeline project: Pre-publication independent replications of a single laboratory's research pipeline. Journal of Experim...
2016
-
[46]
R., Cook, T
Shadish, W. R., Cook, T. D., and Campbell, D. T. (2002). Experimental and Quasi-Experimental Designs for Generalized Causal Inference . Boston: Houghton Mifflin
2002
-
[47]
Shimodaira, H. (2000). Improving predictive inference under covariate shift by weighting the log-likelihood function. Journal of statistical planning and inference , 90(2):227--244
2000
-
[48]
and Strack, F
Stroebe, W. and Strack, F. (2014). The alleged crisis and the illusion of exact replication. Perspectives on Psychological Science , 9(1):59--71
2014
-
[49]
A., Cole, S
Stuart, E. A., Cole, S. R., Bradshaw, C. P., and Leaf, P. J. (2011). The use of propensity scores to assess the generalizability of results from randomized trials. Journal of the Royal Statistical Society Series A: Statistics in Society , 174(2):369--386
2011
-
[50]
Tipton, E. (2013). Improving Generalizations From Experiments Using Propensity Score Subclassification: Assumptions, Properties, and Contexts . Journal of Educational and Behavioral Statistics , 38(3):239--266
2013
-
[51]
Tipton, E., Hedges, L., Vaden-Kiernan, M., Borman, G., Sullivan, K., and Caverly, S. (2014). Sample Selection in Randomized Experiments: A New Method Using Propensity Score Stratified Sampling . Journal of Research on Educational Effectiveness , 7(1):114--135
2014
-
[52]
and Kahneman, D
Tversky, A. and Kahneman, D. (1981). The Framing of Decisions and the Psychology of Choice . science , 211(4481):453--458
1981
Reviewed August 11, 2026 · model on record in the stance chip above.
Discussion (0). Continue with ORCID to comment.