REVIEW 4 major objections 6 minor 1 cited by
Exploring Variability in Fine-Tuned Models for Text Classification with DistilBERT
T0 review · 4 major / 6 minor · reviewed 2026-08-10 · deepseek-v4-flash
Pith's one-line read Fine-tuning DistilBERT metrics trade off against one another, and the epochs–batch-size interaction is the strongest driver of F1.
desk verdict A descriptive snapshot of 55 DistilBERT model cards that overreaches: the regressions mix incomparable metrics, and the variable labels are inconsistent, so the headline p-values are not trustworthy. read the letter →
The pith
A machine-rendered reading of the paper's core claim, the machinery that carries it, and where it could break.
The reading
What carries the argument
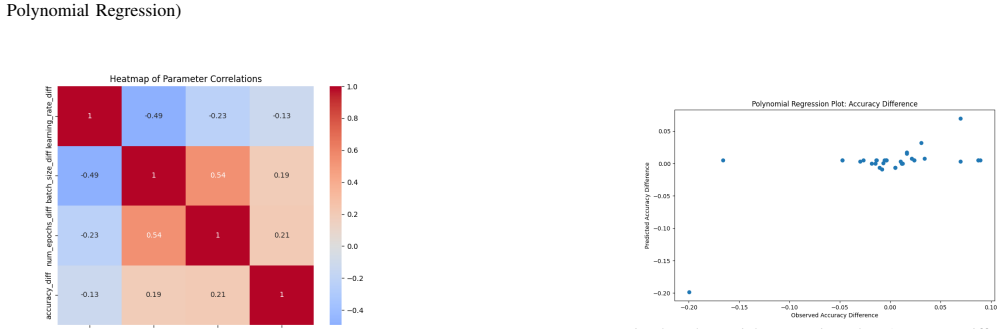
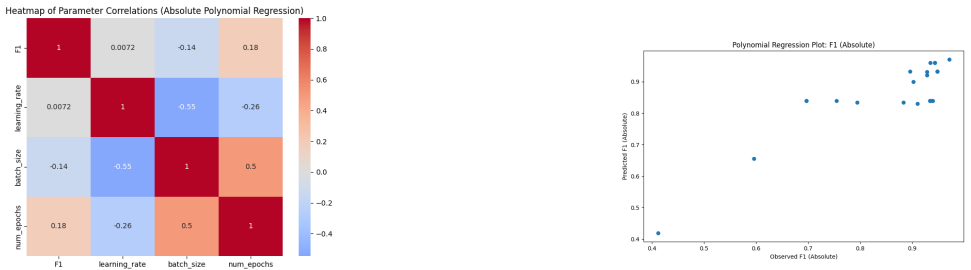
The central machinery is a set of polynomial regressions in two forms: absolute (raw metric values on raw hyperparameters) and relative (differences from the baseline DistilBERT variant). Each regression includes linear terms, quadratic terms, and interactions for learning rate, batch size, and epochs (variables x1–x9); the relative regressions are meant to isolate incremental gains from fine-tuning. These regressions identify which terms are statistically significant for each metric and are supplemented by heatmaps and scatter plots.
What would settle it
Run a controlled fine-tuning experiment on a fixed text-classification dataset with a factorial design over learning rate, batch size, and epochs; if the interaction between epochs and batch size is not significant for F1, or if increasing learning rate does not reduce loss relative to baseline while lowering accuracy, the central claim would be contradicted.
Extended reading notes
Core claim
The paper's central claim is that hyperparameter effects on fine-tuned DistilBERT are not uniform across metrics: in polynomial regressions of 55 model cards, batch size positively predicts accuracy and F1 in absolute terms, learning rate reduces loss in relative (difference-from-baseline) terms, and the interaction term between epochs and batch size is the most significant predictor of F1 (p = 0.001), while the quadratic batch-size term is negative, indicating diminishing returns. The authors interpret this as evidence that fine-tuning strategies must address non-linear interactions and trade-offs, and they propose an incremental approach: foundational tuning of batch size and epochs first, then careful learning-rate refinement.
Load-bearing premise
The analysis assumes that accuracy, F1, and loss values reported on different model cards are directly comparable, even though each model may be evaluated on a different dataset, split, or reporting convention.
Editorial extensions
If this is right
- Batch size and epochs should be chosen jointly, since their interaction is the strongest significant predictor of F1.
- Learning-rate increases can lower loss relative to a baseline but may degrade accuracy, so learning rate should be tuned incrementally.
- Because batch size has diminishing returns (negative quadratic term for F1), very large batch sizes can hurt performance.
- Fine-tuning evaluation should report accuracy, F1, and loss together, since strategies that optimize one metric can harm another.
Reading between the lines
- Because the regressions use observational data from model cards that may be evaluated on different datasets, the reported effects mix hyperparameter influence with dataset and reporting differences; a controlled factorial fine-tuning study would be needed to confirm causality.
- The interaction pattern between epochs and batch size could be tested on other transformer families (e.g., BERT or RoBERTa) to see whether it is a general property of fine-tuning or specific to DistilBERT.
- The proposed two-stage strategy—fix batch size and epochs, then tune learning rate—could be operationalized as an automated hyperparameter search that first optimizes the epoch–batch interaction and then does a local learning-rate search.
Signed reviews
Editorial analysis
A structured set of objections, weighed in public.
Referee Report
Summary. This paper scrapes Hugging Face model cards for 55 DistilBERT text-classification models, extracting reported hyperparameters (learning rate, batch size, epochs) and metrics (accuracy, F1, loss), and fits polynomial regressions in both absolute and relative (baseline-subtracted) forms to identify significant hyperparameter effects and interactions. The central claim is that hyperparameter configurations cause metric variability and trade-offs, with the epochs-by-batch-size interaction driving F1-score improvements (p=0.001), and that these findings inform practical fine-tuning strategies for DistilBERT and other models.
Significance. If the findings were valid, the paper would offer an inexpensive, data-driven route to fine-tuning guidance for DistilBERT. The authors are transparent about their data source and report full regression tables, which is a useful discipline. However, because the underlying data are uncontrolled model-card reports with no common evaluation dataset, and because the variable definitions are internally inconsistent, the empirical contribution cannot support the causal or practical claims made. The paper's significance is therefore limited to a cautionary demonstration of the hazards of meta-analyzing repository metadata.
major comments (4)
- [III-A] The metrics and hyperparameters are extracted from README.md and config.json of 55 different Hugging Face models with no control for the evaluation dataset, data split, or reporting convention. Consequently, the regression coefficients in Section IV blend dataset identity and task difficulty with hyperparameter effects; statements such as 'batch size significantly impacts accuracy' (Section IV.A.1.a) cannot be interpreted as effects of the hyperparameter. This is a load-bearing confound that cannot be fixed within the manuscript's scope without recollecting data under a common evaluation protocol.
- [IV, Tables 1, 3, 5, 6] The mapping of variables X1-X9 is never defined in the paper, and the verbal labels shift across tables: Table 1 treats X2 as batch size and X7 as learning rate, Table 3's text treats X2 as learning rate and X3 as batch size, and Table 6 treats X7 as learning rate squared. Without a single consistent codebook, the reported p-values (including the headline 'epochs x batch size' interaction, p=0.001) cannot be assigned to the claimed hyperparameters, making the central results unverifiable and the abstract's attribution of p=0.028 to batch size for accuracy irreconcilable with Table 1's p=0.000 for X2.
- [III-D] The authors state that they 'focused on metrics and hyperparameters with a sufficient number of observations to allow for statistically significant fine-tuning strategies.' Selecting variables after inspecting significance invalidates the reported p-values as confirmatory evidence and renders the analysis circular: the 'findings' are the fitted coefficients of the same regressions that were used to decide which variables to include.
- [III-E] The relative regression subtracts the baseline model's metric and hyperparameter values from each fine-tuned model. This is only interpretable as an incremental fine-tuning effect if every model was evaluated on the same benchmark as the baseline (distilbert-base-uncased-finetuned-sst-2-english). Since the models are drawn from different model cards, the relative differences are artifacts of dataset choice, not of hyperparameter adjustments, so the relative-regression p-values (e.g., learning rate reducing loss, p=0.027) do not support the conclusions drawn.
minor comments (6)
- [Abstract and IV.A.1.a] The abstract assigns p=0.028 to batch size for accuracy, but Table 1 reports p=0.000 for the variable labeled X2 (batch size) and Table 3 reports p=0.028 for X2, which the text labels 'learning rate'; the abstract conflates the two variables, and the inconsistency propagates into the strategy recommendations in Section IV.B.
- [III-E and IV] The paper never writes out the polynomial regression equation or defines X1-X9 (their meanings, the polynomial degree, or the coding of interaction terms), making it impossible to reconstruct the analysis or interpret the magnitudes of coefficients such as 3.7e+08 in Table 1.
- [Table 3] The F1 absolute regression table omits the constant term that appears in Tables 1, 2, and 6, without any explanation; this inconsistency makes it difficult to assess the model specification across metrics.
- [IV.A.1.b] Figure references are internally inconsistent: the text cites 'Figures 1 and 2' and then 'Figures 2 and 4' for the accuracy results, which does not match the figure numbering in the manuscript and suggests errors in cross-referencing.
- [II-C] Reference [3] is described as 'Fine-Tuning Large Language Models for Task-Specific Data' but the cited paper is actually about domain-specific machine translation; the related-work descriptions need to be checked against the actual references.
- [IV] The regressions do not report sample size, R-squared, or any multiple-testing correction, which is particularly important because six separate regression models are fit on the same small set of 55 model cards and many coefficients are reported with p-values near 0.05.
Circularity Check
Variable selection driven by observed significance and a relative regression that is an affine reparameterization of the absolute regression make several headline p-values partly self-confirmatory.
-
fitted input called prediction
[Section III-D (Selection of Evaluation Metrics and Hyperparameters for Analysis)]
"Due to the limited statistical significance observed across a broader range of metrics and hyperparameters, our study focused on metrics and hyperparameters with a sufficient number of observations to allow for statistically significant fine-tuning strategies."
The paper first screened its initial set of nine hyperparameters and nine metrics for statistical significance, then built the final polynomial regressions using only variables that passed this screen. The p-values reported in Section IV therefore are not independent evidence about those variables; they come from a model whose inputs were chosen because they already showed significant associations in the same data. The headline findings are thus partly constructed by the selection rule rather than derived from a confirmatory test.
-
renaming known result
[Section III-E (Statistical Methods and Tools), Relative Regression bullet; results in Tables 1-6]
"In the relative regression, we used the differences in metric values between each fine-tuned model and the baseline model, as well as the differences in the hyperparameters applied in fine-tuned versus baseline models."
Because the baseline metric and hyperparameter values are fixed constants, the relative regression is algebraically an affine reparameterization of the absolute regression: ΔY_i = Y_i − Y_base and ΔX_i = X_i − X_base, so the fitted surface is the same polynomial regression up to centering and an intercept shift. Consequently, the 'incremental improvements' reported from the relative analysis contain no new empirical information beyond the absolute fit; they are the same data and same regression surface expressed in centered coordinates. Presenting this as a separate source of incremental findings is a renaming of the same regression rather than an independent result.
full rationale
No load-bearing self-citation or imported uniqueness theorem is present; the paper is an observational regression study over scraped Hugging Face model cards. The main circularity concerns are twofold. First, Section III-D openly states that metrics and hyperparameters were selected after observing which ones yielded statistical significance, so the later p-values are conditional on an outcome-based selection rule and cannot be read as confirmatory. Second, the 'relative regression' is an affine transformation of the absolute regression because the baseline is a fixed model with constant hyperparameters and metrics; hence the 'relative' findings are a reparameterization of the same fitted relationship, not an independent measurement of incremental fine-tuning effects. The paper also has internal variable-label inconsistencies (X2 is 'batch size' in Table 1 but 'learning rate' in Tables 3 and 5; X7 changes meaning across tables), which further undermine the reported p-values but are correctness issues rather than circularity. The score is 6 rather than higher because the absolute regressions and the raw scraped data do contain independent empirical content; the circularity is partial, affecting the relative claims and the variable-selection-dependent p-values, not the entire derivation.
Assumptions & free parameters
free parameters (3)
- Polynomial regression coefficients for six models
- Polynomial degree =
2
- Baseline model for relative differences =
distilbert-base-uncased-finetuned-sst-2-english
assumptions (4)
- domain assumption Reported metrics from different Hugging Face model cards are comparable across models
- domain assumption README and config.json values accurately reflect the hyperparameters and metrics used
- domain assumption A degree-2 polynomial adequately captures hyperparameter-metric relationships
- domain assumption OLS p-values are valid for these observations
Cite this review
Pith. "Pith review of Exploring Variability in Fine-Tuned Models for Text Classification with DistilBERT." pith.science (2026). https://pith.science/paper/3NBLSBSZ
@misc{pith2026250100241,
  author       = {Pith},
  title        = {Pith review of: Exploring Variability in Fine-Tuned Models for Text Classification with DistilBERT},
  year         = {2026},
  howpublished = {\url{https://pith.science/paper/3NBLSBSZ}},
  note         = {Machine review of arXiv:2501.00241}
}
read the original abstract
This study evaluates fine-tuning strategies for text classification using the DistilBERT model, specifically the distilbert-base-uncased-finetuned-sst-2-english variant. Through structured experiments, we examine the influence of hyperparameters such as learning rate, batch size, and epochs on accuracy, F1-score, and loss. Polynomial regression analyses capture foundational and incremental impacts of these hyperparameters, focusing on fine-tuning adjustments relative to a baseline model. Results reveal variability in metrics due to hyperparameter configurations, showing trade-offs among performance metrics. For example, a higher learning rate reduces loss in relative analysis (p=0.027) but challenges accuracy improvements. Meanwhile, batch size significantly impacts accuracy and F1-score in absolute regression (p=0.028 and p=0.005) but has limited influence on loss optimization (p=0.170). The interaction between epochs and batch size maximizes F1-score (p=0.001), underscoring the importance of hyperparameter interplay. These findings highlight the need for fine-tuning strategies addressing non-linear hyperparameter interactions to balance performance across metrics. Such variability and metric trade-offs are relevant for tasks beyond text classification, including NLP and computer vision. This analysis informs fine-tuning strategies for large language models and promotes adaptive designs for broader model applicability.
Figures

Figures from the paper (3 more)


Forward citations
Cited by 1 Pith paper
-
Political Leaning and Politicalness Classification of Texts
The authors compile large multi-dataset benchmarks for political leaning and politicalness classification, show that single-dataset models fail out-of-distribution, and release new models with improved cross-domain F1 scores.
Reference graph
Works this paper leans on
-
[1]
Rethinking learning rate tuning in the era of large language models,
H. Jin, W. Wei, X. Wang, W. Zhang, and Y . Wu, “Rethinking learning rate tuning in the era of large language models,” in 2023 IEEE 5th International Conference on Cognitive Machine Intelligence (CogMI) . IEEE, 2023, pp. 112–121
work page 2023
-
[2]
Evaluating the effectiveness of fine-tuning large language model for domain-specific task,
S. Dabhi, J. Martinez, and F. Poursardar, “Evaluating the effectiveness of fine-tuning large language model for domain-specific task,” in 2024 IEEE International Conference on Information Reuse and Integration for Data Science (IRI) . IEEE, 2024, pp. 176–177
work page 2024
-
[3]
Fine-tuning large language models for domain-specific machine translation,
J. Zheng, H. Hong, X. Wang, J. Su, Y . Liang, and S. Wu, “Fine-tuning large language models for domain-specific machine translation,” arXiv preprint arXiv:2402.15061, 2024
arXiv 2024
-
[4]
B. Hartmann, P. Tamla, F. Freund, and M. Hemmje, “Fine-tune it like i’m five: Supporting medical domain experts in training ner models using cloud, llm, and auto fine-tuning,” in 2023 31st Irish Conference on Artificial Intelligence and Cognitive Science (AICS) . IEEE, 2023, pp. 1–8
work page 2023
-
[5]
Fine tuning llms for low resource languages,
S. Joshi, M. S. Khan, A. Dafe, K. Singh, V . Zope, and T. Jhamtani, “Fine tuning llms for low resource languages,” in 2024 5th International Conference on Image Processing and Capsule Networks (ICIPCN) . IEEE, 2024, pp. 511–519
work page 2024
-
[6]
Achieving peak perfor- mance for large language models: A systematic review,
Z. R. K. Rostam, S. Sz ´en´asi, and G. Kert ´esz, “Achieving peak perfor- mance for large language models: A systematic review,” IEEE Access, 2024
2024
-
[7]
Fine-tuned understanding: Enhancing social bot detection with transformer-based classification,
A. Sallah, S. Agoujil, M. A. Wani, M. Hammad, A. A. Abd El- Latif, Y . Malehet al., “Fine-tuned understanding: Enhancing social bot detection with transformer-based classification,” IEEE Access, 2024
work page 2024
-
[8]
Layoutllm: Layout instruction tuning with large language models for document un- derstanding,
C. Luo, Y . Shen, Z. Zhu, Q. Zheng, Z. Yu, and C. Yao, “Layoutllm: Layout instruction tuning with large language models for document un- derstanding,” in Proceedings of the IEEE/CVF Conference on Computer Vision and Pattern Recognition , 2024, pp. 15 630–15 640
work page 2024
Show all 13 references
-
[9]
Cyberbullying detection in social networks: A comparison between machine learning and transfer learning approaches,
T. H. Teng and K. D. Varathan, “Cyberbullying detection in social networks: A comparison between machine learning and transfer learning approaches,” IEEE Access, vol. 11, pp. 55 533–55 560, 2023
2023
-
[10]
Hate speech and target community detection in nastaliq urdu using transfer learning techniques,
M. S. I. Malik, A. Nawaz, and M. M. Jamjoom, “Hate speech and target community detection in nastaliq urdu using transfer learning techniques,” IEEE Access, 2024
2024
-
[11]
Depression classification from tweets using small deep transfer learning language models,
M. Rizwan, M. F. Mushtaq, U. Akram, A. Mehmood, I. Ashraf, and B. Sahelices, “Depression classification from tweets using small deep transfer learning language models,” IEEE Access, vol. 10, pp. 129 176– 129 189, 2022
2022
-
[12]
Agi-p: A gender identification framework for authorship analysis using customized fine-tuning of multilingual language model,
R. Sarwar, P. S. Teh, F. Sabah, R. Nawaz, I. A. Hameed, M. U. Hassan et al., “Agi-p: A gender identification framework for authorship analysis using customized fine-tuning of multilingual language model,” IEEE Access, 2024
2024
-
[13]
Performance analysis of federated learning algorithms for multilingual protest news detection using pre-trained distilbert and bert,
P. Riedel, M. Reichert, R. V on Schwerin, A. Hafner, D. Schaudt, and G. Singh, “Performance analysis of federated learning algorithms for multilingual protest news detection using pre-trained distilbert and bert,” IEEE Access, vol. 11, pp. 134 009–134 022, 2023
2023
Reviewed August 10, 2026 · model on record in the stance chip above.
Discussion (0). Continue with ORCID to comment.