REVIEW 3 major objections 5 minor 44 references
Class Imbalance in Anomaly Detection: Learning from an Exactly Solvable Model
T0 review · 3 major / 5 minor · reviewed 2026-08-10 · deepseek-v4-flash
Pith's one-line read The paper shows that the optimal class-imbalance ratio for training an anomaly detector is generally not 50 percent, and maps how the optimum moves with data quantity, intrinsic rarity, and noise.
desk verdict First solvable theory of anomaly-detection class imbalance, with a convincing but unverified replica-symmetric assumption at the core of its headline prediction. read the letter →
The pith
A machine-rendered reading of the paper's core claim, the machinery that carries it, and where it could break.
The reading
What carries the argument
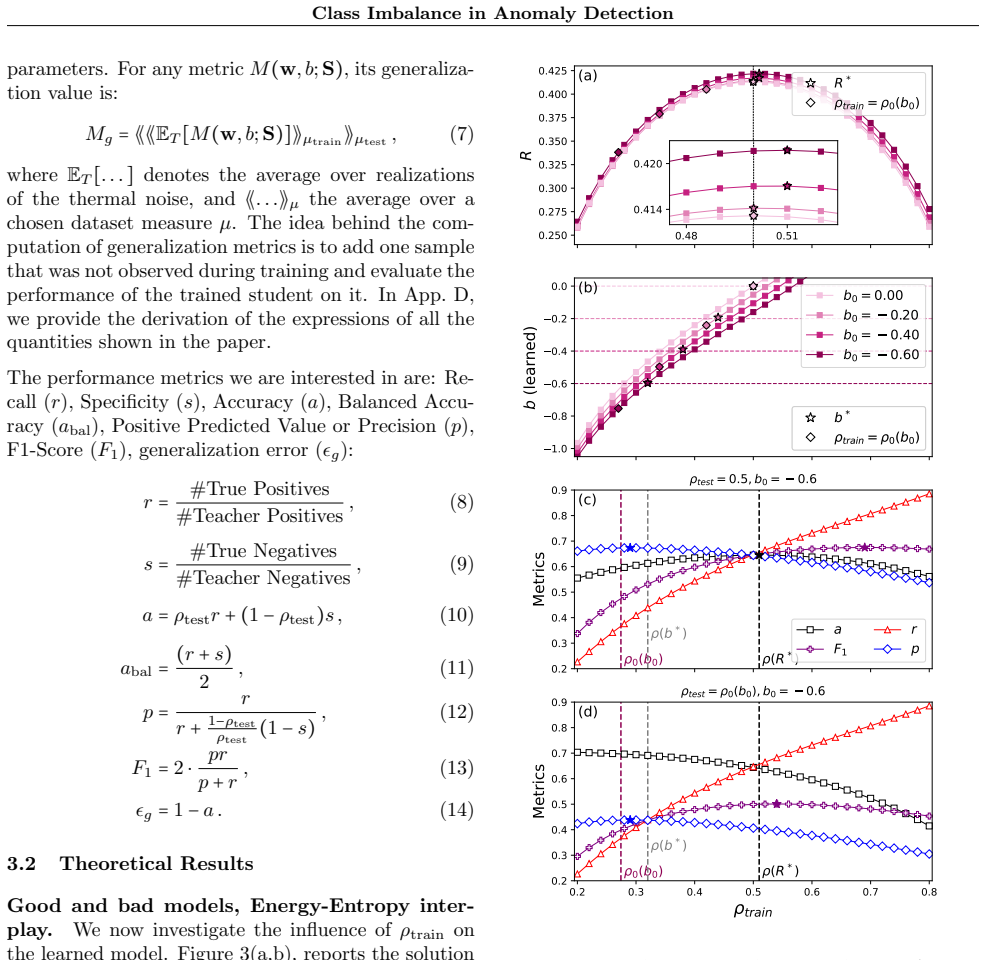
The carrying object is the replica solution of the teacher-student spherical perceptron: a fixed teacher hyperplane $(w_0, b_0)$ labels Gaussian samples, a student perceptron $(w, b)$ minimizes a square loss, and the quenched free energy in the $N\to\infty$ limit is evaluated with the replica method. Under the replica-symmetric ansatz the high-dimensional problem collapses onto five coupled saddle-point equations (App. C, Eqs. 71–75) for the order parameters: the teacher-student overlap $R$, the replica overlap $q$, their conjugates $\hat{R}$, $\hat{q}$, and the learned bias $b$; every performance metric is then a deterministic function of $(R, b)$. The mechanism that carries the main claim is the energy-entropy interplay: dummy solutions with a strong learned bias and poor alignment are entropically favored because many more weight configurations realize nearly the same small training error, while the minority-class samples, which sit close to the decision boundary when $b_0<0$, are the informative ones pulling the student toward correct alignment. The competition between these two tendencies sets the optimal $\rho_{\mathrm{train}}$ and its non-monotonic dependence on $\alpha$, $\rho_0$, and $T$.
What would settle it
The cleanest check is direct simulation: train the same teacher-student perceptron on Gaussian data with SGD at fixed teacher bias $b_0$, data budget $\alpha$, and noise level (learning rate over batch size), measure the teacher-student overlap $R$ as a function of $\rho_{\mathrm{train}}$ with enough statistics and finite-size extrapolation to locate its peak, and compare the peak position to the theory's prediction (Fig. 10). The claim that the optimal training ratio differs from 0.5 would be falsified if the measured peak stays at 0.5 in a regime where the theory predicts a clear shift, or if the predicted non-monotonic dependence on $\alpha$ and $\rho_0$ fails to appear. The paper's own SGD experiments (App. G) reproduce the shifts only qualitatively, so a quantitative discrepancy at the predicted peak location already counts as evidence against the exact prediction. A more fundamental check is to test the validity of the replica-symmetric solution itself by evaluating the de Almeida–Thouless stability condition at the predicted optimum; an unstable solution would invalidate the predicted $\rho_{\mathrm{train}}(R^*)$.
Extended reading notes
Core claim
The central discovery, stated in Sec. 3.2, is a direct challenge to the assumption that a balanced training set is optimal: for the teacher-student spherical perceptron in the anomaly-detection setting, $\rho_{\mathrm{train}}(R^*) = \arg\max_{\rho_{\mathrm{train}}} R$ is different from $0.5$, and the same is true for the balanced accuracy that best proxies $R$ (Fig. 4). The deviation from $0.5$ is non-monotonic in the data abundance $\alpha$ and in the intrinsic imbalance $\rho_0$ set by the teacher bias $b_0$, and it can be positive or negative (Fig. 10); training at $\rho_{\mathrm{train}} = \rho_0$ is always suboptimal in both $R$ and the learned bias $b$. The paper attributes the effect to an energy-entropy trade-off: minority-class samples are more informative because, when $b_0<0$, they concentrate near the teacher's hyperplane, while overly biased 'dummy' solutions are entropically favored because many weight directions achieve near-zero training error. Around a crossover temperature $T^*$, behavior changes: below $T^*$ performance is optimal and nearly noise-independent, while above it performance degrades and becomes sensitive to both the noise level and the choice of $\rho_{\mathrm{train}}$.
Load-bearing premise
The prediction that the optimal training ratio is not 0.5 rests on two linked assumptions: that the trained student really reaches the thermal-equilibrium state the replica calculation describes (with temperature roughly equal to learning rate over batch size), and that the mathematical shortcut used for that calculation—treating all replicated copies of the model as equivalent—is valid in the regimes explored; if real training noise is correlated in time, or if the glassy phase breaks that symmetry, the predicted optimum could be an artifact of the ansatz.
Editorial extensions
If this is right
- Rebalancing an anomaly training set to $\rho_{\mathrm{train}}=0.5$, as standard resampling and reweighting pipelines do, is generically suboptimal; $\rho_{\mathrm{train}}$ should be tuned like any other hyperparameter.
- The optimal training ratio can lie above or below 0.5, so there is no universal direction of correction—sometimes the right move is more anomalies, sometimes more normal samples, depending on $\alpha$ and $\rho_0$.
- Low-noise training (small learning-rate-to-batch-size ratio) is both better and more robust to imbalance: below $T^*$ performance is near-optimal and flat in $T$, while above $T^*$ a given imbalance becomes increasingly costly.
- Balanced accuracy is the most reliable observable proxy for how well the model reconstructed the true boundary, because it does not depend on the test imbalance $\rho_{\mathrm{test}}$; precision best tracks the learned bias, while accuracy, recall, and F1 peak at misleading values of $\rho_{\mathrm{train}}$.
- The choice of test imbalance changes which $\rho_{\mathrm{train}}$ looks optimal (Fig. 3), so benchmark design—balanced or deployment-representative test sets—affects the conclusions practitioners draw about rebalancing.
Reading between the lines
- The energy-entropy mechanism is not tied to Gaussian data, so a testable extension is that any anomaly detector whose minority-class samples lie closer to the decision boundary than its majority-class ones should show a shifted optimal training ratio, with the shift direction predictable from a per-class boundary-proximity measure.
- Because the optimal ratio is non-monotonic in the data budget $\alpha$, the best rebalancing recipe for a dataset is likely to change as the dataset grows; a fixed oversampling or undersampling rule would need to be re-tuned during data collection.
- The theory identifies the end of training with thermal equilibrium at $T\approx$ learning rate / batch size, but real SGD runs for finitely many steps; the predicted crossover $T^*$ may appear at a different effective noise level under limited training budgets, a quantity a practitioner could measure directly.
- Since training at $\rho_{\mathrm{train}}=\rho_0$ is always suboptimal, the paper implies that even training on a perfectly faithful sample of the deployment distribution is suboptimal: rebalancing is not merely correcting a sampling artifact but an active, beneficial distortion of the training distribution.
Editorial analysis
A structured set of objections, weighed in public.
Referee Report
Summary. The paper studies class imbalance in anomaly detection using a teacher-student spherical perceptron with sign activation, a learned bias, and Gaussian i.i.d. inputs. It distinguishes intrinsic imbalance rho_0, train imbalance rho_train, and test imbalance rho_test. Using replica theory under a replica-symmetric ansatz, the authors derive saddle-point equations for the teacher-student overlap R, the self-overlap q, and the learned bias b, from which all performance metrics are obtained. The central claim is that the value of rho_train maximizing R (and, approximately, balanced accuracy) is generally not 0.5, and that it depends non-monotonically on the data abundance alpha, the intrinsic imbalance rho_0, and the Langevin temperature T. The paper also reports a crossover from a low-noise regime in which performance is nearly T-independent to a high-noise regime in which performance degrades with T. Experiments with SGD-trained teacher-student perceptrons, MLP and ResNet models on CIFAR-10 anomaly detection, and a PCA-perceptron on the BTAD dataset are presented as qualitative confirmations.
Significance. If the central claim holds, the paper challenges a widely used heuristic: that rebalancing the training set to 50/50 is always optimal for anomaly detection. The contribution is conceptually useful because it separates intrinsic, train, and test imbalance, and it explains the asymmetry through an energy-entropy argument in which minority-class samples are more informative. A clear strength is that the theoretical derivation is self-contained: no free parameters are fitted, all metrics are derived from the saddle-point equations, and the experimental comparison is qualitative rather than tuned. The main risk is the unverified replica-symmetric ansatz; the low-temperature, strong-imbalance, large-alpha regimes in which the effect is strongest are exactly the regimes in which replica symmetry breaking is expected. This is a significant but fixable issue, and the paper should be resubmitted after a stability analysis or a clearly delimited validity statement.
major comments (3)
- [App. C, Eqs. (48)-(52) and (71)-(75); Figs. 3, 4, 9, 10] The order parameters are obtained from a replica-symmetric saddle point, but no de Almeida-Thouless (or Hessian) stability check is reported. The statement in Sec. 4 that the solutions vary smoothly and that there is an 'absence of phase transitions' is an observation about the iterative solver, not a test of RS stability. The model's ingredients -- sign activation, a learned bias, and an energy-entropy competition between biased dummy solutions and aligned solutions -- are precisely the setting in which RSB is expected in perceptron-like models. If the RS saddle point is unstable in any region used in the figures, then (q, R, b) do not describe the Gibbs measure and the reported argmax over rho_train of R(rho_train), including whether it lies above or below 0.5, is not established. Please add an AT stability analysis (or a 1RSB computation) at least for the low-T, large-|b0|, large-alpha regimes, and state in which parameter regions the RS solution is demonstrably stable.
- [Sec. 3.1 and Sec. 3.3, Fig. 5, App. G.1] The computation treats training noise as an equilibrium Gibbs measure at temperature T, with T 'roughly' equal to lr/BS. The experiments vary only the mini-batch size and never verify this mapping; SGD noise is correlated and the training process is not an equilibrium Langevin process. The temperature-dependence claim (low-noise plateau and high-noise degradation around T*) is part of the headline, so this approximation is load-bearing. Either provide evidence that the equilibrium Gibbs ensemble captures the endpoint of SGD in the regimes studied, or explicitly restrict the noise claims to the Langevin model and describe the T-to-lr/BS relation as a heuristic. As it stands, the quantitative location of T* and the shape of Fig. 5 should not be presented as predictions for SGD.
- [Sec. 3.2 and App. F, Fig. 9(c')] The text states that balanced accuracy is the best proxy for the overlap R and that it has 'qualitative agreement' with R, but Fig. 9(c') shows that for alpha=8 and b0=-1.5, a_bal peaks near rho_train approx 0.55 while R peaks near 0.45, i.e., on the opposite side of 0.5. The text later admits 'a qualitative divide'; this is more than a caveat because tuning rho_train by maximizing a_bal can lead away from rho_train(R*), which is exactly the practical prescription proposed. Please quantify the discrepancy across (b0, alpha, T) and either qualify the recommendation or identify a corrected proxy.
minor comments (5)
- [App. B, Eq. (22)] The limiting expression in Eq. (22) contains corrupted symbols ('/leftr...') and should be rewritten cleanly; Eqs. (23)-(24) follow from it.
- [Fig. 9 caption and legend] The caption lists six values of rho_0 for five listed values of b0, and the legend uses positive b0 values while the caption uses negative ones; please fix the sign convention and the count.
- [Fig. 4] Please clarify whether the 'shift' is an additive vertical offset or a rescaling, and define clearly the quantity plotted on the y-axis; as written, the axis labels are not transparent.
- [App. C, numerical solution of Eqs. (71)-(75)] The paper does not provide code or implementation details for solving the saddle-point equations; please include solver details (initialization, iteration scheme, tolerance) or release code, so that the claimed exact solution is reproducible.
- [Abstract and Sec. 4] The word 'exact' in 'exact solution' should be qualified pending the replica-symmetry stability check; the calculation is exact only under the RS ansatz.
Circularity Check
No significant circularity: the optimal train imbalance is a nontrivial output of the saddle-point equations, not a fitted or self-referential input.
full rationale
The central quantity rho_train(R*) is obtained by solving the replica saddle-point equations (71-75) for the order parameters (q, R, b) and then maximizing R over rho_train. The inputs to this calculation are the control parameters (b0, alpha, T, rho_train), the teacher-student loss, and the Gaussian data measure; none of these contains the predicted optimum. The replica-symmetric ansatz (Eqs. 48-54) is an explicitly stated approximation imported from the standard replica literature, not a device that encodes rho_train(R*) != 0.5; the deviation from 0.5 emerges only after solving the coupled equations and is non-monotonic in alpha, rho0, and T, which would not happen if the answer were built into the ansatz. Self-citations in the paper (energy-entropy interplay [Carbone et al. 2020], SGD imbalance dynamics [Francazi et al. 2023, 2024], and empirical consistency [Kamalov et al. 2022]) are contextual or consistency checks and are not load-bearing in the derivation. Experimental comparisons are qualitative, with no fitted constants linking theory and data. The Sec. 4 claim of an 'absence of phase transitions' is observational and not a stability check, and the replica-symmetric ansatz is not AT-stability-verified; these are genuine correctness and assumption risks, but they are limitations of the approximation, not circularity, because the derivation does not assume the conclusion it claims to establish.
Assumptions & free parameters
assumptions (5)
- ad hoc to paper Replica symmetric ansatz (q, R, b) and saddle-point evaluation give the exact quenched free energy in the N->infinity limit.
- domain assumption Training samples are i.i.d. Gaussian with teacher-conditional labels, with class frequencies fixed by rho_train.
- domain assumption The student is a spherical perceptron trained with square loss at equilibrium at inverse temperature beta=1/T.
- standard math The replica limit n->0 and the thermodynamic limit N->infinity can be interchanged.
- domain assumption The test distribution is teacher-conditional Gaussian with prescribed rho_test.
Cite this review
Pith. "Pith review of Class Imbalance in Anomaly Detection: Learning from an Exactly Solvable Model." pith.science (2026). https://pith.science/paper/HKUEO5NS
@misc{pith2026250111638,
  author       = {Pith},
  title        = {Pith review of: Class Imbalance in Anomaly Detection: Learning from an Exactly Solvable Model},
  year         = {2026},
  howpublished = {\url{https://pith.science/paper/HKUEO5NS}},
  note         = {Machine review of arXiv:2501.11638}
}
read the original abstract
Class imbalance (CI) is a longstanding problem in machine learning, slowing down training and reducing performances. Although empirical remedies exist, it is often unclear which ones work best and when, due to the lack of an overarching theory. We address a common case of imbalance, that of anomaly (or outlier) detection. We provide a theoretical framework to analyze, interpret and address CI. It is based on an exact solution of the teacher-student perceptron model, through replica theory. Within this framework, one can distinguish several sources of CI: either intrinsic, train or test imbalance. Our analysis reveals that the optimal train imbalance is generally different from 50%, with a non trivial dependence on the intrinsic imbalance, the abundance of data and on the noise in the learning. Moreover, there is a crossover between a small noise training regime where results are independent of the noise level to a high noise regime where performances quickly degrade with noise. Our results challenge some of the conventional wisdom on CI and offer practical guidelines to address it.
Figures


Figures from the paper (15 more)


Reference graph
Works this paper leans on
-
[1]
Almeida, T. A., Hidalgo, J. M. G., and Yamakami, A. (2011). Contributions to the study of sms spam filtering: new collection and results. In Proceedings of the 11th ACM symposium on Document engineering , pages 259--262
work page 2011
-
[2]
Altieri, A. and Baity-Jesi, M. (2024). An introduction to the theory of spin glasses. In Chakraborty and Tapash, editors, Encyclopedia of Condensed Matter Physics, 2e , volume 2, pages 361--370. Elsevier, Oxford
work page 2024
-
[3]
Anand, R., Mehrotra, K., Mohan, C., and Ranka, S. (1993). An improved algorithm for neural network classification of imbalanced training sets. IEEE Transactions on Neural Networks , 4(6):962--969
work page 1993
-
[4]
Ando, S. and Huang, C.-Y. (2017). Deep Over -sampling Framework for Classifying Imbalanced Data . arXiv:1704.07515 [cs, stat]
arXiv 2017
-
[5]
R., Vakilian, V., and Thrampoulidis, C
Behnia, T., Kini, G. R., Vakilian, V., and Thrampoulidis, C. (2023). On the Implicit Geometry of Cross - Entropy Parameterizations for Label - Imbalanced Data
work page 2023
-
[6]
Bergmann, P., Fauser, M., Sattlegger, D., and Steger, C. (2019). MVTec AD — A Comprehensive Real - World Dataset for Unsupervised Anomaly Detection . In 2019 IEEE / CVF Conference on Computer Vision and Pattern Recognition ( CVPR ) , pages 9584--9592, Long Beach, CA, USA. IEEE
work page 2019
-
[7]
Burkard, Y., Francazi, E., Lavender, E., Dubach, T., Wehrli, S., Brodesen, J., Volpi, M., Baity-Jesi, M., and Moor, H. (2024). Automated single species identification in camera trap images: architecture choice, training strategies, and the interpretation of performance metrics
work page 2024
-
[8]
R., Astuti, V., and Baity-Jesi, M
Carbone, M. R., Astuti, V., and Baity-Jesi, M. (2020). Effective traplike activated dynamics in a continuous landscape. Phys. Rev. E , 101:052304
work page 2020
Show all 44 references
-
[9]
Charbonneau, P., Marinari, E., Parisi, G., Ricci-tersenghi, F., Sicuro, G., Zamponi, F., and Mezard, M. (2023). Spin Glass Theory and Far Beyond: Replica Symmetry Breaking after 40 Years . World Scientific
2023
-
[10]
V., Bowyer, K
Chawla, N. V., Bowyer, K. W., Hall, L. O., and Kegelmeyer, W. P. (2002). SMOTE : Synthetic Minority Over -sampling Technique . Journal of Artificial Intelligence Research , 16:321--357
2002
-
[11]
Fontanari, J. F. and Meir, R. (1993). The statistical mechanics of the Ising perceptron. Journal of Physics A: Mathematical and General , 26(5):1077--1089
1993
-
[12]
Francazi, E., Baity-Jesi, M., and Lucchi, A. (2023). A theoretical analysis of the learning dynamics under class imbalance. In International Conference on Machine Learning , volume 202, pages 10285--10322. PMLR
2023
-
[13]
Francazi, E., Lucchi, A., and Baity-Jesi, M. (2024). Initial guessing bias: How untrained networks favor some classes. In International Conference on Machine Learning , volume 235, pages 13783--13839. PMLR
2024
-
[14]
and Derrida, B
Gardner, E. and Derrida, B. (1989). Three unfinished works on the optimal storage capacity of networks. Journal of Physics A: Mathematical and General , 22(12):1983
1989
-
[15]
Györgyi, G. (1990). First-order transition to perfect generalization in a neural network with binary synapses. Physical Review A , 41(12):7097--7100
1990
-
[16]
He, K., Zhang, X., Ren, S., and Sun, J. (2015). Deep residual learning for image recognition. CoRR , abs/1512.03385
2015 arXiv
-
[17]
Huang, K. (1987). Statistical Mechanics . John Wiley and Sons, Hoboken, NJ, second edition
1987
-
[18]
and Stephen, S
Japkowicz, N. and Stephen, S. (2002). The class imbalance problem: A systematic study. Intelligent Data Analysis , 6(5):429--449
2002
-
[19]
Jastrzebski, S., Kenton, Z., Arpit, D., Ballas, N., Fischer, A., Bengio, Y., and Storkey, A. (2017). Three factors influencing minima in sgd. arXiv:1711.04623
2017 arXiv
-
[20]
F., and Elreedy, D
Kamalov, F., Atiya, A. F., and Elreedy, D. (2022). Partial Resampling of Imbalanced Data . arXiv:2207.04631 [cs]
2022 arXiv
-
[21]
R., Paraskevas, O., Oymak, S., and Thrampoulidis, C
Kini, G. R., Paraskevas, O., Oymak, S., and Thrampoulidis, C. (2021). Label- Imbalanced and Group - Sensitive Classification under Overparameterization
2021
-
[22]
Kunstner, F., Yadav, R., Milligan, A., Schmidt, M., and Bietti, A. (2024). Heavy-tailed class imbalance and why adam outperforms gradient descent on language models. arXiv:2402.19449
2024 arXiv
-
[23]
P., Hardeman, T., Merz, E., Bulas, T., Reyes, M., Isles, P., Pomati, F., and Baity-Jesi, M
Kyathanahally, S. P., Hardeman, T., Merz, E., Bulas, T., Reyes, M., Isles, P., Pomati, F., and Baity-Jesi, M. (2021). Deep learning classification of lake zooplankton. Frontiers in microbiology , page 3226
2021
-
[24]
Loffredo, E., Pastore, M., Cocco, S., and Monasson, R. (2024). Restoring balance: principled under/oversampling of data for optimal classification. arXiv:2405.09535 [cond-mat]
2024 arXiv
-
[25]
S., Gerace, F., Rostamzadeh, N., and Saglietti, L
Mannelli, S. S., Gerace, F., Rostamzadeh, N., and Saglietti, L. (2023). Unfair geometries: exactly solvable data model with fairness implications. arXiv:2205.15935 [cond-mat, stat]
2023 arXiv
-
[26]
K., Jayasumana, S., Rawat, A
Menon, A. K., Jayasumana, S., Rawat, A. S., Jain, H., Veit, A., and Kumar, S. (2021). Long-tail learning via logit adjustment. arXiv:2007.07314 [cs, stat]
2021 arXiv
-
[27]
M \'e zard, M., Parisi, G., and Virasoro, M. (1987). Spin-Glass Theory and Beyond . World Scientific, Singapore
1987
-
[28]
Mezard, M., Parisi, G., and Virasoro, M. (1987). Spin Glass Theory And Beyond : An Introduction To The Replica Method And Its Applications . World Scientific Lecture Notes In Physics . World Scientific Publishing Company
1987
-
[29]
Mignacco, F., Krzakala, F., Lu, Y., Urbani, P., and Zdeborova, L. (2020). The role of regularization in classification of high-dimensional noisy gaussian mixture. In International conference on machine learning , pages 6874--6883. PMLR
2020
-
[30]
Mishra, P., Verk, R., Fornasier, D., Piciarelli, C., and Foresti, G. L. (2021). VT-ADL: A vision transformer network for image anomaly detection and localization. CoRR , abs/2104.10036
2021 arXiv
-
[31]
Nishimori, H. (2001). Statistical physics of spin glasses and information processing: an introduction . Number 111. Clarendon Press
2001
-
[32]
Reiss, T., Cohen, N., Bergman, L., and Hoshen, Y. (2020). PANDA - adapting pretrained features for anomaly detection. CoRR , abs/2010.05903
2020 arXiv
-
[33]
A., Yaida, S., and Hanin, B
Roberts, D. A., Yaida, S., and Hanin, B. (2022). The principles of deep learning theory , volume 46. Cambridge University Press Cambridge, MA, USA
2022
-
[34]
Sch\" u r, C., Gasser, L., Perez-Cruz, F., Schirmer, K., and Baity-Jesi, M. (2023). A benchmark dataset for machine learning in ecotoxicology. Scientific Data , 10(1):718
2023
-
[35]
and Wyart, M
Sclocchi, A. and Wyart, M. (2024). On the different regimes of Stochastic Gradient Descent . Proceedings of the National Academy of Sciences , 121(9):e2316301121. arXiv:2309.10688 [cond-mat, stat]
2024 arXiv
-
[36]
S., Sompolinsky, H., and Tishby, N
Seung, H. S., Sompolinsky, H., and Tishby, N. (1992). Statistical mechanics of learning from examples. Physical Review A , 45(8):6056--6091
1992
-
[37]
Tang, K., Huang, J., and Zhang, H. (2020). Long-tailed classification by keeping the good and removing the bad momentum causal effect. Advances in neural information processing systems , 33:1513--1524
2020
-
[38]
R., Vakilian, V., and Behnia, T
Thrampoulidis, C., Kini, G. R., Vakilian, V., and Behnia, T. (2022). Imbalance Trouble : Revisiting Neural - Collapse Geometry
2022
-
[39]
and Manski, C
Xie, Y. and Manski, C. F. (1989). The Logit Model and Response - Based Samples . Sociological Methods & Research , 17(3):283--302
1989
-
[40]
Yamanishi, K., Takeuchi, J.-I., Williams, G., and Milne, P. (2000). On-line unsupervised outlier detection using finite mixtures with discounting learning algorithms. In Proceedings of the sixth ACM SIGKDD international conference on Knowledge discovery and data mining , pages...
2000
-
[41]
Ye, H.-J., Zhan, D.-C., and Chao, W.-L. (2021). Procrustean training for imbalanced deep learning. In Proceedings of the IEEE/CVF International Conference on Computer Vision , pages 92--102
2021
-
[42]
and Mani, I
Zhang, J. and Mani, I. (2003). kNN Approach to Unbalanced Data Distributions : A Case Study involving Information Extraction
2003
-
[43]
Zhang, L., Shen, X., Zhang, F., Ren, M., Ge, B., and Li, B. (2019). Anomaly detection for power grid based on time series model. In 2019 IEEE International Conference on Computational Science and Engineering (CSE) and IEEE International Conference on Embedded and Ubiquitous Co...
2019
-
[44]
P., Galic, N., Vaugeois, M., and Dreier, D
Zubrod, J. P., Galic, N., Vaugeois, M., and Dreier, D. A. (2023). Physiological variables in machine learning qsars allow for both cross-chemical and cross-species predictions. Ecotoxicology and Environmental Safety , 263:115250
2023
Reviewed August 10, 2026 · model on record in the stance chip above.
Discussion (0). Continue with ORCID to comment.