REVIEW 3 major objections 6 minor 52 references
Detection of Anisotropies in the Circumgalactic Medium of Disk Galaxies: Supermassive Black Hole Activity or Star Formation-driven Outflows?
T0 review · 3 major / 6 minor · reviewed 2026-08-09 · deepseek-v4-flash
Pith's one-line read Stacked X-ray data from 93 edge-on disk galaxies reveal soft diffuse halo emission with a significant excess along the minor axis, seen only in the most star-forming third of the sample.
desk verdict Solid first detection of anisotropic CGM in stacked edge-on disks, but the SFR correlation relies on an uncorrected F-test and should be treated as tentative. read the letter →
The pith
A machine-rendered reading of the paper's core claim, the machinery that carries it, and where it could break.
The reading
What carries the argument
The argument is carried by two procedures. The first is stacking: since no individual galaxy is detected, photons from 93 edge-on galaxies are co-added in a fixed 14 kpc circular aperture after masking the galactic disk and excluding point sources, and the surface brightness is measured in five azimuthal bins symmetric about the minor axis; the presence of an anisotropy is judged by whether a sinusoidal component significantly improves the fit of the azimuthal profile, assessed with an F-test. The second is a synthetic-observation pipeline in which simulated galaxies are projected as X-ray images with realistic background and exposure and analyzed with the same extraction and fitting steps, so that the predicted azimuthal morphology of large black-hole bubbles (a major-axis excess in a 14 kpc aperture) can be compared directly with the observed minor-axis excess.
What would settle it
Re-run the azimuthal analysis on the same stacked data with high- and low-star-formation subsamples compared directly—fitting the difference in sinusoidal amplitude rather than testing each profile against a constant—and apply a multiple-comparison correction for the six parameter splits. If the high-star-formation amplitude is not significantly larger than the low-star-formation amplitude, the claimed star-formation correlation fails even if a minor-axis excess in the full stack is genuine.
Extended reading notes
Core claim
The central discovery is that the circumgalactic medium of stacked disk galaxies is anisotropic. In the 0.3–2 keV band, the co-added photons produce 389±60 net counts over the 14 kpc aperture—a 6.5σ detection—corresponding to an average luminosity of (4.2±0.7)×$10^{39}$ erg/s; the 3–8 keV band shows no significant signal, indicating thermal rather than binary or power-law X-ray emission. An azimuthal profile folded about the disk plane, with θ=90° along the minor axis, is best fit by a constant plus a sinusoidal excess at θ=90°, and in subsample splits the F-test favors the sinusoidal component only for the high-SFR top third (p=1.16%). Comparison with mock X-ray images of galaxies from a large cosmological simulation shows that the simulated black-hole-driven bubbles extend to about 50 kpc and, when viewed through the same 14 kpc aperture, produce an excess near the major axis rather than the minor axis—the opposite of the observed morphology. The paper concludes that the observed anisotropy is therefore either due to star formation/starburst-driven outflows or to black-hole bubbles confined to roughly 10 kpc scales.
Load-bearing premise
The conclusion that star formation drives the asymmetry depends on treating a 1.16% chance that the high-star-formation subsample's azimuthal profile is flat as significant, without accounting for the fact that six subsample tests were performed; if a multiple-comparison correction is required, the star-formation correlation is not formally established.
Editorial extensions
If this is right
- The hot circumgalactic medium of Milky Way-mass disk galaxies is not spherical at 10–14 kpc scales, so X-ray-based mass and baryon-budget estimates that assume spherical symmetry would need to account for this bipolar structure.
- Because the minor-axis enhancement appears only in the high-star-formation third, ongoing star formation—through supernovae and starburst winds—is the more likely driver of such outflows in the present-day universe than central black hole activity.
- If black-hole feedback does produce Milky Way-like bubbles in these galaxies, the bubbles must be roughly 10 kpc in size rather than the ~50 kpc scales produced by the simulation, constraining feedback energetics and coupling.
- Individual galaxies in the high-SFR subsample should show minor-axis X-ray outflows at ~14 kpc in sufficiently deep exposures, making them priority targets for follow-up X-ray spectroscopy.
Reading between the lines
- The six-way subsample split means chance alone could produce one nominally significant F-test; the conservative reading is that the full-stack minor-axis excess is the robust new result, while the star-formation attribution needs a direct two-sample comparison before it is treated as established.
- A testable prediction follows from the simulation comparison: if black-hole bubbles are the cause, the minor-axis excess should appear only when the azimuthal profile is extracted from apertures large enough to enclose the bubbles; measuring the radial dependence of the anisotropy (e.g., 10, 20, 40 kpc apertures) would distinguish small bubbles from large ones.
- The same stacking method applied to face-on or intermediate-inclination galaxies, or to samples split by environment, would test whether the apparent minor-axis excess is truly a perpendicular outflow geometry rather than an artifact of masking the disk.
- If supernova-driven winds are responsible, the minor-axis emission should be hotter (harder spectrum) than the surrounding CGM, as the paper's hardness ratios hint, and the anisotropy should correlate with SFR surface density rather than total SFR; both are testable with deeper stacking.
Editorial analysis
A structured set of objections, weighed in public.
Referee Report
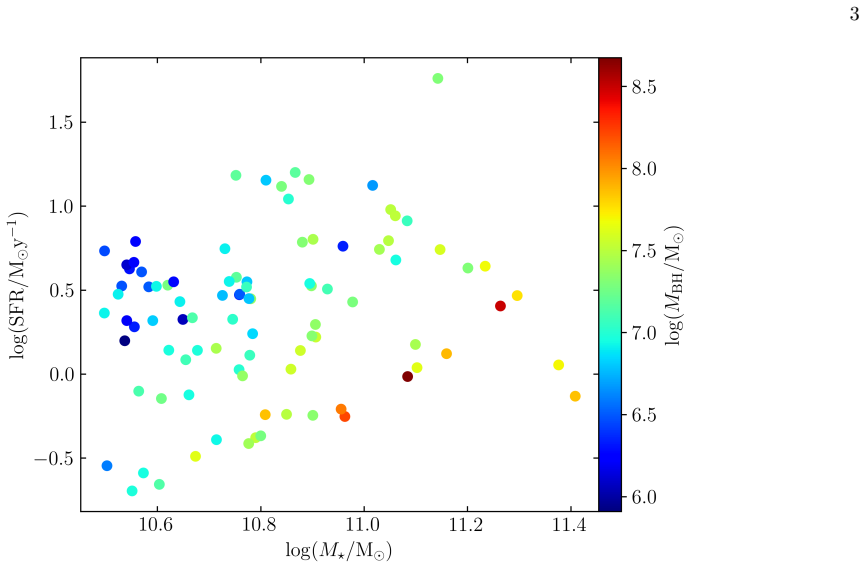
Summary. This paper stacks archival Chandra observations of 93 edge-on disk galaxies (133 pointings, ~2.2 Ms) to search for diffuse X-ray emission from the circumgalactic medium (CGM) and for azimuthal anisotropies. The authors report a 6.5 sigma detection of soft 0.3-2 keV emission within a 14 kpc aperture, with luminosity (4.2 +/- 0.7) x 10^39 erg/s, no significant 3-8 keV signal, and an unresolved X-ray binary contamination estimate a factor of ~20 below the detected flux. The azimuthal profile of the stacked emission shows an enhancement along the galactic minor axis. Dividing the sample into top and bottom thirds by SFR, stellar mass, and SMBH mass, the only subsample for which a sinusoidal component significantly improves the fit is the high-SFR subsample (F-test p = 1.16%). The authors compare with mock Chandra observations of TNG50 galaxies and find that simulated SMBH-driven bubbles would appear as a major-axis enhancement at 14 kpc and correlate with SMBH mass, opposite to the observations. They conclude that the observed anisotropies are probably associated with star-formation-driven outflows, or with AGN bubbles on smaller scales than those in TNG50.
Significance. If the SFR-anisotropy correlation holds, the paper provides the first stacked detection of anisotropic CGM emission in external disk galaxies and a direct observational constraint on feedback processes. The core CGM detection appears robust: the signal is seen only in the soft band, the contamination estimate is well below the measured luminosity, and the comparison with TNG50 mock images is a useful and nontrivial test. The main weakness is that the paper's central interpretive claim, that anisotropy is linked to SFR rather than SMBH activity, rests on a set of uncorrected F-tests and lacks a direct subsample amplitude comparison. The paper is therefore significant but requires additional statistical work before the headline claim is established.
major comments (3)
- [3.2] The claim that only the high-SFR subsample shows significant anisotropy is derived from six F-tests (high/low thirds for SFR, stellar mass, and SMBH mass), each evaluated at a 5% threshold. For six independent tests the Bonferroni-corrected threshold is p < 0.0083, so the reported p = 0.0116 for the high-SFR profile is no longer significant after correction. Please report the p-values for all six fits and either apply a multiple-comparison correction or provide a clear justification for treating the tests as independent. If the corrected significance does not survive, the abstract and Section 6 statements that 'only high star formation rate galaxies exhibit significant anisotropies' must be softened.
- [3.2] The paper does not compare the anisotropy amplitude of the high-SFR subsample directly with that of the low-SFR subsample. A significant F-test in one subsample and a non-significant result in another does not demonstrate that the profiles differ, particularly if the stacked signal-to-noise ratios differ. Please fit the constant-plus-sinusoid model jointly to both subsamples and test whether the sinusoidal amplitudes are equal (for example by bootstrap or permutation), reporting the amplitudes and uncertainties for each subsample.
- [4 (and 5)] Section 4 is used to argue that the observed minor-axis enhancement is inconsistent with TNG50-like SMBH bubbles, but it does not provide a positive prediction for star-formation-driven bubbles at ~10 kpc scales. The flat high-SFR profile in TNG50 is explained by model-specific effects (bright CGM dilution and the mix of thermal-mode SMBHs), so the simulation comparison alone does not establish that SNe-driven outflows produce the observed feature. Please either add a direct test of an SF-driven bubble model (for example, by constructing a simple outflow geometry and simulating it with the same pipeline) or present the SF interpretation explicitly as speculative rather than as the favored conclusion.
minor comments (6)
- [2.1 and 6] The text states 133 individual observations in Section 2.1 but 120 Chandra observations in Section 6; please reconcile these numbers.
- [3.2] The notation 'F = 1.16%' is ambiguous: 1.16% is presumably the p-value of the F-test, not the F statistic. Please label it clearly and report the p-values for all six subsample fits, preferably in a small table.
- [Abstract and 3.1] The statement that the CGM 'extends up to 14 kpc' is not directly demonstrated; the analysis uses a fixed 14 kpc aperture and does not show a radial profile. Please rephrase as 'within 14 kpc' or include a radial profile.
- [4] The SMBH mass distributions of the observed and simulated samples differ by an order of magnitude; while this is acknowledged, the selection of simulated galaxies to match SFR but not SMBH mass makes the comparison of the SMBH-mass split difficult to interpret. Please show the TNG50 predictions for the SMBH-mass split with a matched mass range, or explicitly state how the mass mismatch affects the comparison.
- [5] The supernova energy estimate E_SN = 7.6 x 10^41 erg/s is a useful order-of-magnitude check, but the text should state explicitly that only a small fraction of this energy is converted into X-ray emission and that the comparison to L_X ~ 4 x 10^39 erg/s is therefore not a quantitative energy budget.
- [Throughout] There are a few typographical errors: 'Star F ormation' in the title line, 'the the bulges' in conclusion item 5, and the wording of the Table 1 note about 'an apex SB' should be corrected.
Circularity Check
No load-bearing circularity: the CGM detection and azimuthal anisotropy are measured from external Chandra data, and the TNG50 comparison is an independent simulation benchmark; self-citations are not the source of the central claim.
full rationale
The derivation chain is self-contained. In Sec. 3.1 the CGM detection is obtained by stacking 2014 gross counts against 1625 background counts, so the 6.5-sigma significance is a count-statistics statement, not an output of a fitted model. The conversion to luminosity adopts an assumed apec spectrum, but that assumption only translates counts to flux and does not manufacture the detection. In Sec. 3.2 the anisotropy is assessed with an F-test comparing constant and constant-plus-sinusoid fits to the observed azimuthal profile; the test statistic is computed from the data, and the high-SFR split is an independent sample partition. The TNG50 comparison in Sec. 4 generates mock observations from the simulation's gas cells with PyXSIM/SOXS; although some cited simulation papers (Pillepich et al. 2021, Truong et al. 2021a) include authors of the present paper, the simulation is an externally defined benchmark that was not fitted to the observed stacked profile. The supernova energy budget in Sec. 5 uses standard rates, giving E_SN ~ 7.6e41 erg/s to be compared with L_X ~ 4e39 erg/s; the comparison is not an identity. The main caveats are statistical, not circular: the 14 kpc aperture may have been chosen to maximize signal-to-noise, and six F-tests are reported without multiple-comparison correction, so the p = 1.16% high-SFR anisotropy should be interpreted with care. These concerns affect significance calibration, but no claimed prediction reduces to an input by construction.
Assumptions & free parameters
free parameters (5)
- CGM temperature kT =
0.3 keV
- CGM metallicity Z =
0.3 Zsun
- Galactic absorption NH =
2e20 cm^-2
- X-ray binary photon index Gamma =
2
- Source aperture radius R =
14 kpc
assumptions (6)
- domain assumption Hot CGM emits as an optically thin collisional ionization equilibrium plasma (apec) with Z=0.3 Zsun.
- domain assumption The 25-35 kpc annulus is free of CGM emission and represents the background.
- domain assumption Unresolved X-ray binaries outside the elliptical mask contribute about 5% of the soft-band luminosity.
- ad hoc to paper Six independent F-tests at the 5% level, one per subsample, are sufficient to identify which subsample shows anisotropy.
- domain assumption TNG50 simulated galaxies provide a valid morphological template for SMBH-driven bubbles despite an order-of-magnitude higher mean SMBH mass.
- domain assumption Inferred SMBH masses from the MBH-sigma and MBH-Mgal relations are accurate enough to split the sample into top and bottom thirds.
Cite this review
Pith. "Pith review of Detection of Anisotropies in the Circumgalactic Medium of Disk Galaxies: Supermassive Black Hole Activity or Star Formation-driven Outflows?." pith.science (2026). https://pith.science/paper/LYMSKFXZ
@misc{pith2026250118681,
  author       = {Pith},
  title        = {Pith review of: Detection of Anisotropies in the Circumgalactic Medium of Disk Galaxies: Supermassive Black Hole Activity or Star Formation-driven Outflows?},
  year         = {2026},
  howpublished = {\url{https://pith.science/paper/LYMSKFXZ}},
  note         = {Machine review of arXiv:2501.18681}
}
abstract
Gamma and X-ray observatories have revealed spectacular structures in the emission of the tenuous hot gas surrounding the Milky Way (MW), known as the Fermi and eROSITA bubbles. Galaxy formation simulations suggest that MW-like bubbles could be ubiquitous, but their emission may be too faint to detect with today's instruments in individual external galaxies. In this paper, we present an analysis of stacked Chandra observations of 93 nearby galaxies. We detected soft, diffuse X-rays from the CGM, extending up to 14 kpc, with a luminosity of $(4.2\pm0.7)\times10^{39}$ erg/s in the $0.3-2$ keV band. To probe its spatial distribution, we constructed an azimuthal profile and found a significant enhancement along the galactic minor axis. When dividing our sample by stellar mass, central supermassive black hole mass, and star formation rate, we found that only high star formation rate galaxies exhibit significant anisotropies in the CGM emission. To investigate whether the observed anisotropies could be attributed to MW-like bubbles, we compared our results with TNG50 simulations. In these simulations, X-ray bubbles are strongly correlated with mass of the central supermassive black hole and typically extend to much larger, $\sim50$ kpc, scales. We conclude that the observed anisotropies are either caused by AGN-driven MW-like bubbles confined to smaller, $\sim10$ kpc, scales, or by star formation- or starburst-driven bubbles/outflows.
Figures


Figures from the paper (3 more)


Reference graph
Works this paper leans on
-
[1]
Anderson, M. E., & Bregman, J. N. 2011, ApJ, 737, 22, doi: 10.1088/0004-637X/737/1/22
-
[2]
Anderson, M. E., Gaspari, M., White, S. D. M., Wang, W., & Dai, X. 2015, MNRAS, 449, 3806, doi: 10.1093/mnras/stv437 Bogd´ an,´A., Bourdin, H., Forman, W. R., et al. 2017, ApJ, 850, 98, doi: 10.3847/1538-4357/aa9523 Bogd´ an,´A., & Gilfanov, M. 2008, MNRAS, 388, 56, doi: 10.1111/j.1365-2966.2008.13391.x —. 2011, MNRAS, 418, 1901, doi: 10.1111/j.1365-2966....
-
[3]
Chadayammuri, U., Bogd´ an,´A., Oppenheimer, B. D., et al. 2022, ApJL, 936, L15, doi: 10.3847/2041-8213/ac8936
-
[4]
2022, A&A, 666, A156, doi: 10.1051/0004-6361/202243101
Comparat, J., Truong, N., Merloni, A., et al. 2022, A&A, 666, A156, doi: 10.1051/0004-6361/202243101
-
[5]
Fruscione, A., McDowell, J. C., Allen, G. E., et al. 2006, in Society of Photo-Optical Instrumentation Engineers (SPIE) Conference Series, Vol. 6270, Observatory Operations: Strategies, Processes, and Systems, ed. D. R. Silva & R. E. Doxsey, 62701V, doi: 10.1117/12.671760
-
[6]
2023, Nature Astronomy, 7, 799, doi: 10.1038/s41550-023-01963-5
Gupta, A., Mathur, S., Kingsbury, J., Das, S., & Krongold, Y. 2023, Nature Astronomy, 7, 799, doi: 10.1038/s41550-023-01963-5
-
[7]
2019, MNRAS, 482, 4972, doi: 10.1093/mnras/sty2992
Khabibullin, I., & Churazov, E. 2019, MNRAS, 482, 4972, doi: 10.1093/mnras/sty2992
-
[8]
Kovlakas, K., Zezas, A., Andrews, J. J., et al. 2021, MNRAS, 506, 1896, doi: 10.1093/mnras/stab1799
Show all 52 references
- [9]
-
[10]
D., Heckman, T
Lehnert, M. D., Heckman, T. M., & Weaver, K. A. 1999, ApJ, 523, 575, doi: 10.1086/307762
1999 doi
-
[11]
2024, MNRAS, 529, 4073, doi: 10.1093/mnras/stae797
Li, C., Li, H., Cui, W., et al. 2024, MNRAS, 529, 4073, doi: 10.1093/mnras/stae797
2024 doi
-
[12]
N., Wang, Q
Li, J.-T., Bregman, J. N., Wang, Q. D., et al. 2017, ApJS, 233, 20, doi: 10.3847/1538-4365/aa96fc
2017 doi
-
[13]
R., et al
Li, Z., Jones, C., Forman, W. R., et al. 2011, ApJ, 730, 84, doi: 10.1088/0004-637X/730/2/84
2011 doi
-
[14]
2014, A&A, 570, A13, doi: 10.1051/0004-6361/201423496
Vauglin, I. 2014, A&A, 570, A13, doi: 10.1051/0004-6361/201423496
2014 doi
-
[15]
2005, A&A, 433, 807, doi: 10.1051/0004-6361:20041411
Mannucci, F., Della Valle, M., Panagia, N., et al. 2005, A&A, 433, 807, doi: 10.1051/0004-6361:20041411
2005 doi
-
[16]
J., Ma, C.-P., Gebhardt, K., et al
McConnell, N. J., Ma, C.-P., Gebhardt, K., et al. 2011, Nature, 480, 215, doi: 10.1038/nature10636
2011 doi
-
[17]
2019, MNRAS, 490, 3234, doi: 10.1093/mnras/stz2306
Nelson, D., Pillepich, A., Springel, V., et al. 2019, MNRAS, 490, 3234, doi: 10.1093/mnras/stz2306
2019 doi
-
[18]
D., Crain, R
Nica, A., Oppenheimer, B. D., Crain, R. A., et al. 2022, MNRAS, 517, 1958, doi: 10.1093/mnras/stac2020
2022 doi
-
[19]
D., Bogd´ an,´A., Crain, R
Oppenheimer, B. D., Bogd´ an,´A., Crain, R. A., et al. 2020, ApJL, 893, L24, doi: 10.3847/2041-8213/ab846f
2020 doi
-
[20]
L., Siemiginowska, A., et al
Park, T., Kashyap, V. L., Siemiginowska, A., et al. 2006, ApJ, 652, 610, doi: 10.1086/507406
2006 doi
-
[21]
2021, MNRAS, 508, 4667, doi: 10.1093/mnras/stab2779
Pillepich, A., Nelson, D., Truong, N., et al. 2021, MNRAS, 508, 4667, doi: 10.1093/mnras/stab2779
2021 doi
-
[22]
2018, MNRAS, 475, 648, doi: 10.1093/mnras/stx3112
Pillepich, A., Nelson, D., Hernquist, L., et al. 2018, MNRAS, 475, 648, doi: 10.1093/mnras/stx3112
2018 doi
-
[23]
2019, MNRAS, 490, 3196, doi: 10.1093/mnras/stz2338
Pillepich, A., Nelson, D., Springel, V., et al. 2019, MNRAS, 490, 3196, doi: 10.1093/mnras/stz2338
2019 doi
-
[24]
P., Bogdan, A., & Marshall, H
Plucinsky, P. P., Bogdan, A., & Marshall, H. L. 2022, in Society of Photo-Optical Instrumentation Engineers (SPIE) Conference Series, Vol. 12181, Space Telescopes and Instrumentation 2022: Ultraviolet to Gamma Ray, ed. J.-W. A. den Herder, S. Nikzad, & K. Nakazawa, 121816X, do...
2022 doi
-
[25]
P., Bogdan, A., Marshall, H
Plucinsky, P. P., Bogdan, A., Marshall, H. L., & Tice, N. W. 2018, in Society of Photo-Optical Instrumentation Engineers (SPIE) Conference Series, Vol. 10699, Space Telescopes and Instrumentation 2018: Ultraviolet to Gamma Ray, ed. J.-W. A. den Herder, S. Nikzad, & K. Nakazawa...
2018 doi
-
[26]
A., Becker, W., et al
Predehl, P., Sunyaev, R. A., Becker, W., et al. 2020, Nature, 588, 227, doi: 10.1038/s41586-020-2979-0
2020 doi
-
[27]
2021, A&A, 647, A1, doi: 10.1051/0004-6361/202039313
Predehl, P., Andritschke, R., Arefiev, V., et al. 2021, A&A, 647, A1, doi: 10.1051/0004-6361/202039313
2021 doi
-
[28]
W., Nulsen, P
Randall, S. W., Nulsen, P. E. J., Jones, C., et al. 2015, ApJ, 805, 112, doi: 10.1088/0004-637X/805/2/112
2015 doi
-
[29]
E., & Volonteri, M
Reines, A. E., & Volonteri, M. 2015, ApJ, 813, 82, doi: 10.1088/0004-637X/813/2/82 12
2015 doi
-
[30]
Sarkar, K. C. 2024, A&A Rv, 32, 1, doi: 10.1007/s00159-024-00152-1
2024 doi
-
[31]
C., Mondal, S., Sharma, P., & Piran, T
Sarkar, K. C., Mondal, S., Sharma, P., & Piran, T. 2023, ApJ, 951, 36, doi: 10.3847/1538-4357/acd75d
2023 doi
-
[32]
C., Nath, B
Sarkar, K. C., Nath, B. B., & Sharma, P. 2015, MNRAS, 453, 3827, doi: 10.1093/mnras/stv1806
2015 doi
-
[33]
2005, ApJL, 629, L85, doi: 10.1086/452632
Scannapieco, E., & Bildsten, L. 2005, ApJL, 629, L85, doi: 10.1086/452632
2005 doi
-
[34]
A., et al
Schellenberger, G., Bogd´ an,´A., ZuHone, J. A., et al. 2024, ApJ, 969, 85, doi: 10.3847/1538-4357/ad4548
2024 doi
- [35]
-
[36]
2000, AJ, 120, 2965, doi: 10.1086/316846
Dahlem, M. 2000, AJ, 120, 2965, doi: 10.1086/316846
2000 doi
-
[37]
R., & Finkbeiner, D
Su, M., Slatyer, T. R., & Finkbeiner, D. P. 2010, ApJ, 724, 1044, doi: 10.1088/0004-637X/724/2/1044
2010 doi
-
[38]
2021, A&A, 656, A132, doi: 10.1051/0004-6361/202141179
Sunyaev, R., Arefiev, V., Babyshkin, V., et al. 2021, A&A, 656, A132, doi: 10.1051/0004-6361/202141179
2021 doi
-
[39]
2021a, MNRAS, 508, 1563, doi: 10.1093/mnras/stab2638
Hernquist, L. 2021a, MNRAS, 508, 1563, doi: 10.1093/mnras/stab2638
-
[40]
2021b, MNRAS, 501, 2210, doi: 10.1093/mnras/staa3880
Truong, N., Pillepich, A., & Werner, N. 2021b, MNRAS, 501, 2210, doi: 10.1093/mnras/staa3880
-
[41]
2020, MNRAS, 494, 549, doi: 10.1093/mnras/staa685
Truong, N., Pillepich, A., Werner, N., et al. 2020, MNRAS, 494, 549, doi: 10.1093/mnras/staa685
2020 doi
-
[42]
S., & Werk, J
Tumlinson, J., Peeples, M. S., & Werk, J. K. 2017, ARA&A, 55, 389, doi: 10.1146/annurev-astro-091916-055240
2017 doi
-
[43]
2025, A&A, 693, A171, doi: 10.1051/0004-6361/202452430
Ubertosi, F., Gong, Y., Nulsen, P., et al. 2025, A&A, 693, A171, doi: 10.1051/0004-6361/202452430
2025 doi
-
[44]
2019, SSRv, 215, 5, doi: 10.1007/s11214-018-0571-9
Scannapieco, E. 2019, SSRv, 215, 5, doi: 10.1007/s11214-018-0571-9
2019 doi
-
[45]
White, S. D. M., & Frenk, C. S. 1991, ApJ, 379, 52, doi: 10.1086/170483
1991 doi
-
[46]
White, S. D. M., & Rees, M. J. 1978, MNRAS, 183, 341, doi: 10.1093/mnras/183.3.341
1978 doi
-
[47]
2000, ApJ, 542, 914, doi: 10.1086/317016
Wilms, J., Allen, A., & McCray, R. 2000, ApJ, 542, 914, doi: 10.1086/317016
2000 doi
-
[48]
Yang, H. Y. K., Ruszkowski, M., & Zweibel, E. G. 2022, Nature Astronomy, 6, 584, doi: 10.1038/s41550-022-01618-x
2022 doi
- [49]
- [50]
-
[51]
A., Vikhlinin, A., Tremblay, G
ZuHone, J. A., Vikhlinin, A., Tremblay, G. R., et al. 2023, SOXS: Simulated Observations of X-ray Sources, Astrophysics Source Code Library, record ascl:2301.024
2023
-
[52]
A., Schellenberger, G., Ogorza lek, A., et al
ZuHone, J. A., Schellenberger, G., Ogorza lek, A., et al. 2024, ApJ, 967, 49, doi: 10.3847/1538-4357/ad36c1 13 APPENDIX A. PROPERTIES OF THE SELECTED SOURCES We report in Table 1 the properties of the 93 galaxies composing our sample. T able 1.Properties of the 93 galaxies com...
2004 doi
Reviewed August 9, 2026 · model on record in the stance chip above.
Discussion (0). Continue with ORCID to comment.