REVIEW 4 major objections 5 minor 89 references
DeepForest: Sensing Into Self-Occluding Volumes of Vegetation With Aerial Imaging
T0 review · 4 major / 5 minor · reviewed 2026-08-09 · deepseek-v4-flash
Pith's one-line read The paper claims that ordinary aerial multispectral images, fused by synthetic-aperture focal stacking and cleaned by pre-trained 3D CNNs, can expose volumetric reflectance and per-voxel NDVI through self-occluding forest canopies.
desk verdict A solid, honestly-scoped method paper that demonstrates in simulation a cheap passive route to volumetric vegetation reflectance; the real-world deep-canopy claim remains unproven. read the letter →
The pith
A machine-rendered reading of the paper's core claim, the machinery that carries it, and where it could break.
The reading
What carries the argument
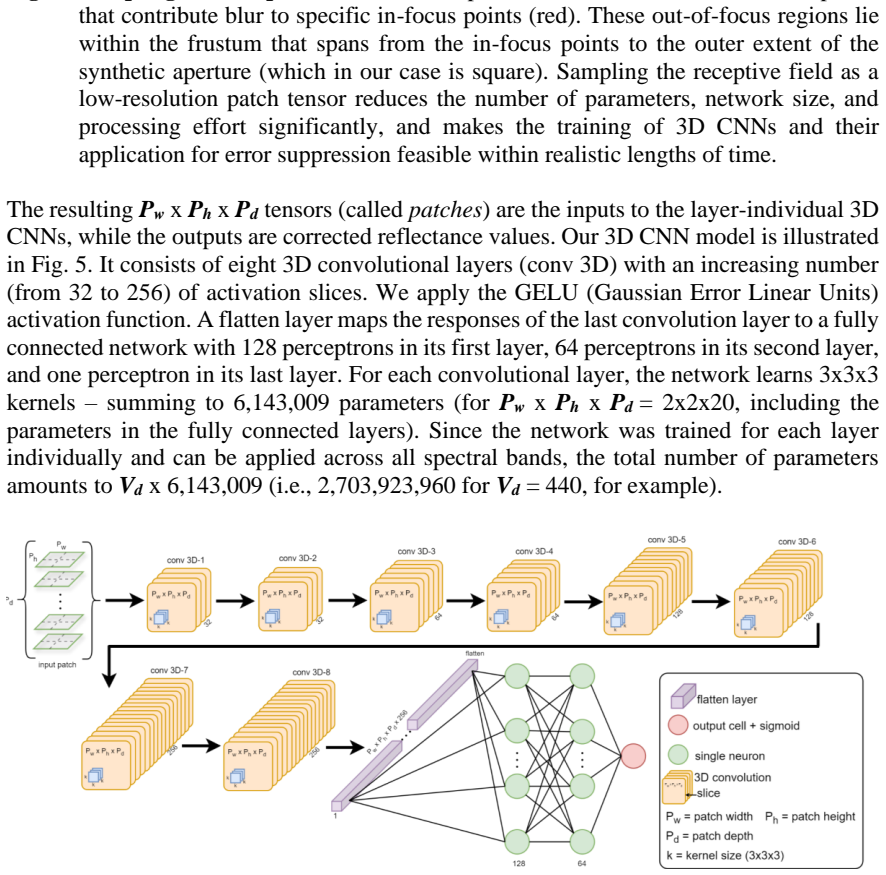
The central object is the synthetic-aperture focal stack together with its asymmetric inverted-pyramid receptive field: for a point at focal distance $f$, every out-of-focus occluder inside the frustum spanned by the synthetic aperture contributes a spread signal to that point's value. The correction machinery is a per-layer 3D CNN that maps a downsampled patch tensor from this receptive field to a corrected reflectance value; the paper's finding is that the redundancy of focal stacks allows extreme downsampling, so 2x2x20 patches and a network of roughly 6.1 million parameters per layer suffice. One network is trained for each of 440 depth layers, the same weights are reused across spectral bands, and training one layer takes about 15 minutes on a single GPU.
What would settle it
Fly the same 24 m x 24 m, 9x9-pose synthetic-aperture scan over a real forest while independently measuring the below-canopy vegetation with terrestrial LiDAR or destructive sampling, then compare the corrected reflectance and NDVI stacks voxel-by-voxel against those measurements. If the below-canopy error is no better than the uncorrected focal stack, the simulation-trained correction has not transferred to reality.
Extended reading notes
Core claim
The central claim is that the out-of-focus blur contaminating each layer of a synthetic-aperture focal stack is a learnable function of the depth layer and the local occlusion pattern, and that a 3D CNN trained on procedural forests can suppress it well enough to recover low-frequency volumetric reflectance. Classical 3D deconvolution cannot do this job because the occluders are opaque and the receptive field is shift-variant, so the paper replaces deconvolution with learned per-layer correction. Each network sees only a heavily downsampled patch tensor sampled from the inverted-pyramid receptive field, and a patch size of 2x2x20 suffices, making the models small enough to train per layer. The networks are trained on white-light simulation and applied across spectral channels on the assumption that macroscopic defocus is wavelength-invariant. After correction, per-layer error stays roughly constant with depth even though uncorrected error grows with accumulated occlusion, and the output is a low-frequency reflectance stack rather than a sharp voxel segmentation.
Load-bearing premise
The load-bearing premise is that the computer-generated broadleaf forests block light the same way real forests do, because the correction network is trained only on simulated trees and the field experiment never measures what is actually below the canopy.
Editorial extensions
If this is right
- Vegetation indices such as NDVI become computable per voxel from passive multispectral camera data, so health and biomass estimates can be stratified by canopy depth instead of being limited to the visible top layer.
- The approach slots onto existing drone platforms: a 30 m x 30 m plot scanned from 9x9 poses inside a 24 m x 24 m synthetic aperture at 35 m altitude produced a 440x440x440 volume from an 18-minute flight.
- Because each depth layer is corrected by its own network, the method is most useful exactly where occlusion is worst: uncorrected error grows toward the ground, while corrected error stays flat, yielding the largest relative gains (~7x average, up to ~12x) in deep layers.
- Retraining is required when forest type, season, or aperture geometry changes, but the paper reports the cost is modest, about 15 minutes per depth layer on a single GPU.
- With sensor mapping, corrected red and near-infrared stacks reproduce top-layer NDVI from the original camera image with MSE 0.05, the paper's only quantitative check on real data.
Reading between the lines
- An untested extension implied by the paper is validation against independent below-canopy measurements, such as terrestrial laser scans or understory censuses; the field experiment compares only the top vegetation layer, so the deep-layer improvement is demonstrated in simulation but not yet in the real world.
- The 2x2x20 patch finding suggests a broader principle: strongly occluded focal stacks carry enough redundant angular information that extremely sparse receptive-field sampling works, which may transfer to other self-occluding volume-recovery problems.
- The paper leaves depth-based void filtering as future work; if void points were identified, the low-frequency reflectance stacks would sharpen toward camera-limited spatial detail, potentially enabling volumetric leaf-area-density (PAD) profiles.
Signed reviews
Editorial analysis
A structured set of objections, weighed in public.
Referee Report
Summary. The paper proposes DeepForest, a method for converting aerial multispectral focal stacks acquired by synthetic-aperture imaging with drones into volumetric reflectance stacks. A 3D CNN is trained on procedural forest simulations to suppress out-of-focus contributions from occluders, and the corrected stacks are combined into vegetation-index stacks such as NDVI. Simulation results show an average ~x7 improvement (min ~x2, max ~x12) in MSE against simulated ground truth for forest densities of 220–1680 trees/ha. A field experiment on a mixed broadleaf forest reports an MSE of 0.05 for top-layer NDVI after a linear sensor-mapping step.
Significance. If the deep-layer recovery were validated against independent below-canopy ground truth, this would be a significant contribution to remote sensing, because it would enable passive optical cameras to provide volumetric vegetation information at lower cost and higher spectral resolution than active LiDAR or radar systems. The paper is notable for its open data and code, its explicit discussion of void points and training limitations, and its honest statement that models must be retrained for different vegetation types. These strengths make the simulation-level results credible as an in-distribution proof of concept, but the central real-world claim is not yet supported by the field experiment.
major comments (4)
- [Results, Field Experiment (Fig. 9A)] The only quantitative field validation is against the top vegetation layer: the paper states that 'measured ground truth data for deeper vegetation is unavailable.' Because the abstract and title claim sensing 'deep into self-occluding vegetation volumes, such as forests,' the field experiment does not test the deep-layer prediction. A revision should add an independent below-canopy reference (e.g., UAV or terrestrial LiDAR of the same plot, or leaf-off photography) or explicitly limit the real-world claim to the top layer.
- [Results, Eq. (2) sensor mapping] The sensor-mapping step rescales each corrected reflectance stack using the mean and standard deviation of the photogrammetrically reconstructed top-layer points matched to the center camera image. The reported top-layer MSE of 0.05 in Fig. 9A is therefore partly enforced by construction and is not an independent validation of the CNN correction. The paper should report the top-layer MSE of the corrected stack before sensor mapping and clarify what exactly the field experiment validates.
- [Training, Validation, and Inference; Fig. 7; Generalization] The x7 average improvement (min x2, max x12) is computed against ground truth generated by the same procedural forest simulator used to create the training patches; this measures in-distribution interpolation, not transfer to real forest occlusion statistics. The Discussion's Generalization section concedes that 'our models must be retrained with adapted procedural forest parameters' for other vegetation types. The abstract's broad claim that the approach 'allows sensing deep into self-occluding vegetation volumes, such as forests' overstates the evidence. Add cross-domain tests (e.g., train on one procedural parameter set and test on another, or simulate a field plot from LiDAR data) or constrain the claim in the abstract.
- [Reconstruction Error Suppression; Limitations] The paper acknowledges that void points cannot be learned and that the model 'approximates low (yet not necessarily zero) reflectance values that are noisy in the lateral and axial directions.' During inference all points are processed, and the field NDVI stack is thresholded only by NDVI >= 0.33. The reported 32.75% 'biomass' estimate therefore includes void regions and is not a validated volumetric measure. The paper should add a void-confidence channel or explicitly state that quantitative ecological estimates are not yet reliable until void point classification is solved.
minor comments (5)
- [Eq. (1)] The notation in Eq. (1) is unclear: the position of h in the denominator and the structure of the point-spread expression should be clarified, and the integration bounds should be defined more explicitly.
- [Table 1] The text refers to 'the improvement factor (last column),' but the printed Table 1 does not contain an improvement-factor column; the table should be completed or the text corrected.
- [Introduction] The sentence 'while SAR does not support multi-spectral measurement' begins with a lowercase 'while' after a period; capitalize and fix the punctuation.
- [Data S10] Data S10 refers to 'COMAP' where 'COLMAP' is meant; correct the typo.
- [Supplementary Data S1] The folder name 'integrals_full_respolution' contains a typo; it should be 'integrals_full_resolution'.
Circularity Check
Field top-layer validation is partly enforced by the sensor-mapping calibration, and the simulated x7 gain is an in-simulator supervised-fit metric; the deep-sensing claim is supported by interpolation, not independent prediction.
-
fitted input called prediction
[Vegetation-Index Estimation from Field Experiments, Eq. 2 and Fig. 9A]
"Since these points are unoccluded, their reflectance values should match the reflectance of the unoccluded points visible in the original camera images. We approximate this by matching their reflectance statistics and by correcting the reflectance stacks: R'=σC(R-μR)/σR + μC ... Here, we achieved an overall MSE of 0.05 ... with sensor mapping (MSE=0.2, RMSE%=22.4% without sensor mapping). This comparison is conducted as an initial step to assess our approach effectiveness in correcting the reflectance values for the top vegetation."
Equation 2 is an affine map whose parameters (μR, σR) are computed from the corrected reflectance-stack values at the very top-layer point cloud that is later compared, and (μC, σC) from the center camera image. After mapping, the mean and standard deviation of the top-layer reflectance values in each channel equal the camera image's statistics by construction. The reported top-layer NDVI MSE of 0.05 is therefore not an independent test of the learned 3D-CNN correction; it is largely a check of the affine sensor-mapping calibration applied to the same points used to fit it.
-
fitted input called prediction
[Abstract and Reconstruction Error Suppression / Simulated Results]
"The training data which provides ground-truth values comes from simulated procedural forests with varying vegetation parameters ... Compared with simulated ground truth, our correction leads to ~x7 average improvements (min: ~x2, max: ~x12) for forest densities of 220 trees/ha - 1680 trees/ha."
The CNN is trained with MSE loss against ground-truth reflectance slices extracted from the GAZEBO procedural forest simulator (near/far clipping), and the headline improvement is measured against simulated ground truth generated by that same simulator. Thus the x7 figure quantifies how well the fitted network reproduces the simulator's own reflectance distribution on held-out instances of that distribution; it is a supervised-fit quality metric, not an independent prediction for real forests. The paper's Generalization section concedes that models must be retrained for other occlusion statistics, confirming that the result is tied to the training simulator.
full rationale
The paper's core method is transparent: focal stacks are computed by synthetic-aperture imaging, and a 3D CNN trained on procedural forests suppresses out-of-focus occluder signal. The simulated evaluation is in-distribution: both training targets and test ground truth come from the same GAZEBO procedural simulator, so the x7 improvement demonstrates interpolation within that simulator rather than transfer to real below-canopy reflectance. The field experiment provides no below-canopy ground truth, and the reported top-layer MSE of 0.05 is weakened by the sensor-mapping step (Eq. 2), which forces the mapped top-layer reflectance statistics to match the center camera image and is calibrated on the same point cloud used for the comparison. No load-bearing self-citation chain or uniqueness argument is present; the cited AOS prior work supplies the focal-stack computation but is not used to forbid alternatives. The central deep-sensing claim therefore rests partly on a fitted, self-consistent simulation and a partially construction-enforced field metric, warranting a partial circularity score rather than a fully independent validation.
Assumptions & free parameters
free parameters (4)
- 3D CNN weights =
6,143,009 per layer; 2,703,923,960 total for 440 layers
- Receptive-field patch resolution (Pw x Ph x Pd) =
2x2x20
- Volume resolution (Vw x Vh x Vd) =
440x440x440 voxels
- Sensor-mapping moments (muC, sigmaC, muR, sigmaR) =
Per channel from field imagery
assumptions (6)
- domain assumption The synthetic-aperture integral model in Eq. 1 approximates the actual imaging of opaque vegetation volumes.
- domain assumption At macroscopic scale, defocus blur is invariant to wavelength, so white-light-trained networks can be applied to each multispectral band.
- domain assumption Procedural GAZEBO forests with the stated tree parameters reproduce the occlusion statistics of real European broadleaf forests.
- domain assumption Averaged RGB renderings of thin depth slices provide ground-truth reflectance for training.
- domain assumption Photogrammetric COLMAP reconstruction of the top canopy layer is accurate enough to serve as reference for sensor mapping and field validation.
- domain assumption The training strategy using only non-void points is valid for inference on all voxels.
Cite this review
Pith. "Pith review of DeepForest: Sensing Into Self-Occluding Volumes of Vegetation With Aerial Imaging." pith.science (2026). https://pith.science/paper/IWYCTEOP
@misc{pith2026250202171,
  author       = {Pith},
  title        = {Pith review of: DeepForest: Sensing Into Self-Occluding Volumes of Vegetation With Aerial Imaging},
  year         = {2026},
  howpublished = {\url{https://pith.science/paper/IWYCTEOP}},
  note         = {Machine review of arXiv:2502.02171}
}
read the original abstract
Access to below-canopy volumetric vegetation data is crucial for understanding ecosystem dynamics. We address the long-standing limitation of remote sensing to penetrate deep into dense canopy layers. LiDAR and radar are currently considered the primary options for measuring 3D vegetation structures, while cameras can only extract the reflectance and depth of top layers. Using conventional, high-resolution aerial images, our approach allows sensing deep into self-occluding vegetation volumes, such as forests. It is similar in spirit to the imaging process of wide-field microscopy, but can handle much larger scales and strong occlusion. We scan focal stacks by synthetic-aperture imaging with drones and reduce out-of-focus signal contributions using pre-trained 3D convolutional neural networks with mean squared error (MSE) as the loss function. The resulting volumetric reflectance stacks contain low-frequency representations of the vegetation volume. Combining multiple reflectance stacks from various spectral channels provides insights into plant health, growth, and environmental conditions throughout the entire vegetation volume. Compared with simulated ground truth, our correction leads to ~x7 average improvements (min: ~x2, max: ~x12) for forest densities of 220 trees/ha - 1680 trees/ha. In our field experiment, we achieved an MSE of 0.05 when comparing with the top-vegetation layer that was measured with classical multispectral aerial imaging.
Figures


Figures from the paper (6 more)



Reference graph
Works this paper leans on
-
[1]
Combining Environmental, Multispectral, and LiDAR Data Improves Forest Type Classification: A Case Study on Mapping Cool Temperate Rainforests and Mixed Forests
Trouvé R, Jiang R, Fedrigo M, White MD, Kasel S, Baker PJ, Nitschke CR. Combining Environmental, Multispectral, and LiDAR Data Improves Forest Type Classification: A Case Study on Mapping Cool Temperate Rainforests and Mixed Forests. Remote Sens. 2023;15:60
2023
-
[2]
Towards accurate individual tree parameters estimation in dense forest: optimized coarse-to-fine algorithms for registering UAV and terrestrial LiDAR data
Zhao Y, Im J, Zhen Z, Zhao Y. Towards accurate individual tree parameters estimation in dense forest: optimized coarse-to-fine algorithms for registering UAV and terrestrial LiDAR data. GIScience & Remote Sensing. 2023;60:2197281
2023
-
[3]
Forest Emissions Reduction Assessment Using Optical Satellite Imagery and Space LiDAR Fusion for Carbon Stock Estimation
Jiao Y, Wang D, Yao X, Wang S, Chi T, Meng Y. Forest Emissions Reduction Assessment Using Optical Satellite Imagery and Space LiDAR Fusion for Carbon Stock Estimation. Remote Sens. 2023;15(5):1410
2023
-
[4]
Biomass Estimation of Subtropical Arboreal Forest at Single Tree Scale Based on Feature Fusion of Airborne LiDAR Data and Aerial Images
Yan M, Xia Y, Yang X, Wu X, Yang M, Wang C, Hou Y, Wang D. Biomass Estimation of Subtropical Arboreal Forest at Single Tree Scale Based on Feature Fusion of Airborne LiDAR Data and Aerial Images. Sustainability. 2023;15(2):1676
2023
-
[5]
Crop Type Classification by DESIS Hyperspectral Imagery and Machine Learning Algorithms
Farmonov N, Amankulova K, Szatmári J, Sharifi A, Abbasi-Moghadam D, Nejad SMM, Mucsi L. Crop Type Classification by DESIS Hyperspectral Imagery and Machine Learning Algorithms. IEEE Journal of Selected Topics in Applied Earth Observations and Remote Sensing. 2023;16:1576-1588
2023
-
[6]
Hong SJ, Park S, Lee A, Kim SY, Kim E, Lee CH. Kim G. Nondestructive prediction of pepper seed viability using single and fusion information of hyperspectral and X-ray images. Sensors and Actuators A: Physical. 2023;350:114151. Page 23 of 34
2023
-
[7]
Hyperspectral remote sensing to assess weed competitiveness in maize farmland ecosystems
Lou Z, Quan L, Sun D, Li H, Xia F. Hyperspectral remote sensing to assess weed competitiveness in maize farmland ecosystems. Science of The Total Environment. 2022;844:157071
2022
-
[8]
Early Detection of Dendroctonus valens Infestation at Tree Level with a Hyperspectral UAV Image
Gao B, Yu L, Ren L, Zhan Z, Luo Y. Early Detection of Dendroctonus valens Infestation at Tree Level with a Hyperspectral UAV Image. Remote Sens. 2023;15:407
2023
Show all 89 references
-
[9]
Combining novel feature selection strategy and hyperspectral vegetation indices to predict crop yield
Fei S, Li L, Han Z, Chen Z, Xiao Y. Combining novel feature selection strategy and hyperspectral vegetation indices to predict crop yield. Plant Methods. 2022;18:119
2022
-
[10]
Real-time defect inspection of green coffee beans using NIR snapshot hyperspectral imaging
Chen SY, Chiu MF, Zou XW. Real-time defect inspection of green coffee beans using NIR snapshot hyperspectral imaging. Computers and Electronics in Agriculture. 2022;197: 106970
2022
-
[11]
Detecting Asymptomatic Infections of Rice Bacterial Leaf Blight Using Hyperspectral Imaging and 3-Dimensional Convolutional Neural Network With Spectral Dilated Convolution
Cao Y, Yuan P, Xu H, Martínez-Ortega JF, Feng J, Zhai Z. Detecting Asymptomatic Infections of Rice Bacterial Leaf Blight Using Hyperspectral Imaging and 3-Dimensional Convolutional Neural Network With Spectral Dilated Convolution. Front. Plant Sci. 2022;13: 963170
2022
-
[12]
Remote Estimation of Chlorophyll Content in Higher Plant Leaves
Gitelson AA, Merzlyak MN. Remote Estimation of Chlorophyll Content in Higher Plant Leaves. Int. J. Remote Sens. 1997;18:2691–2697
1997
-
[13]
Canopy Top, Height and Photosynthetic Pigment Estimation Using Parrot Sequoia Multispectral Imagery and the Unmanned Aerial Vehicle (UAV)
Kopačková-Strnadová V, Koucká L, Jelének J, Lhotáková Z, Oulehle F. Canopy Top, Height and Photosynthetic Pigment Estimation Using Parrot Sequoia Multispectral Imagery and the Unmanned Aerial Vehicle (UAV). Remote Sens. 2021;13:705
2021
-
[14]
Construction of 3D maps of vegetation indices retrieved from UAV multispectral imagery in forested areas
Villacrés J, Cheein FAA. Construction of 3D maps of vegetation indices retrieved from UAV multispectral imagery in forested areas. Biosystems Engineering.2022;213:76
2022
-
[15]
In-situ fruit analysis by means of LiDAR 3D point cloud of normalized difference vegetation index (NDVI)
Tsoulias N, Saha KK, Zude-Sasse M. In-situ fruit analysis by means of LiDAR 3D point cloud of normalized difference vegetation index (NDVI). Computers and Electronics in Agriculture. 2023;205:107611
2023
-
[16]
Evaluating the Combined Use of the NDVI and High-Density Lidar Data to Assess the Natural Regeneration of P
Míguez C, Fernández C. Evaluating the Combined Use of the NDVI and High-Density Lidar Data to Assess the Natural Regeneration of P. pinaster after a High-Severity Fire in NW Spain. Remote Sens. 2023;15:1634
2023
-
[17]
Integrating UAV LiDAR and multispectral data to assess forest status and map disturbance severity in a West African forest patch
Iheaturu CJ, Hepner S, Batchelor JL, Agonvonon GA, Akinyemi FO, Wingate VR, Speranza CI. Integrating UAV LiDAR and multispectral data to assess forest status and map disturbance severity in a West African forest patch. Ecological Informatics. 2024; 84:102876
2024
-
[18]
L-Band Synthetic Aperture Radar and Its Application for Forest Parameter Estimation, 1972 to 2024: A Review
Ye Z, Long J, Zhang T, Lin B, Lin H. L-Band Synthetic Aperture Radar and Its Application for Forest Parameter Estimation, 1972 to 2024: A Review. Plants. 2024; 13:2511
1972
-
[19]
Measurements of Forest Biomass Change Using P-Band Synthetic Aperture Radar Backscatter
Sandberg G, Ulander LMH, Wallerman J, Fransson JES. Measurements of Forest Biomass Change Using P-Band Synthetic Aperture Radar Backscatter. In IEEE Geosci. Remote Sens. 2014;52:6047-6061. Page 24 of 34
2014
-
[20]
P-band SAR for ground deformation surveying: Advantages and challenges
Xu Y, Lu Z, Bürgmann R, Hensley S, Fielding E, Kim J. P-band SAR for ground deformation surveying: Advantages and challenges. Remote Sens. Environ. 2023; 287:113474
2023
-
[21]
Virtual constellations for global terrestrial monitoring
Wulder MA, Hilker T, White JC, Coops NC, Masek JG, Pflugmacher D, Crevier Y. Virtual constellations for global terrestrial monitoring. Remote Sens. Environ. 2015; 170:62-76
2015
-
[22]
Radar vegetation indices for monitoring surface vegetation: Developments, challenges, and trends
Hu X, Li L, Huang J, Zeng Y, Zhang S, Su Y, Hong Y, Hong Z. Radar vegetation indices for monitoring surface vegetation: Developments, challenges, and trends. Science of The Total Environment. 2024;945:173974
2024
-
[23]
Combining lidar and synthetic aperture radar data to estimate forest biomass: status and prospects
Kaasalainen S, Holopainen M, Karjalainen M, Vastaranta M, Kankare V, Karila K, Osmanoglu B. Combining lidar and synthetic aperture radar data to estimate forest biomass: status and prospects. Forests. 2015;6(1):252-270
2015
-
[24]
Structure-from-Motion Revisited
Schönberger JL, Frahm JM. Structure-from-Motion Revisited. Paper presented at: CVPR
-
[25]
Pixelwise view selection for unstructured multi-view stereo
Schönberger JL, Zheng E, Frahm JM, Pollefeys M. Pixelwise view selection for unstructured multi-view stereo. Paper presented at: ECCV 2016. Proceeding of European Conference on Computer Vision;2016 Oct11-14; Amsterdam, The Netherlands
2016
-
[26]
Global structure-from-motion revisited
Pan L, Baráth D, Pollefeys M, Schönberger JL. Global structure-from-motion revisited. Paper presented at: ECCV 2024. Proceeding of European Conference on Computer Vision; 2024 Sep 29 – Oct 4; Milan, Italy
2024
-
[27]
Atutorial on synthetic aperture radar
Moreira A, Prats-Iraola P, Younis M, Krieger G, Hajnsek I, Papathanassiou KP. Atutorial on synthetic aperture radar. IEEE Geosci. Remote Sens. 2013;1:6–43
2013
-
[28]
Synthetic aperture radar imaging using a small consumer drone
Li CJ, Ling H. Synthetic aperture radar imaging using a small consumer drone. Proceeding IEEE International Symposium on Antennas and Propagation USNC/URSI National Radio Science Meeting;2015 Jul 19; Vancouver, BC, Canada
2015
-
[29]
Synthetic aperture radar interferometry
Rosen PA, Hensley S, Joughin IR, Li FK, Madsen SN, Rodriguez E, Goldstein RM. Synthetic aperture radar interferometry. Proc. IEEE. 2000;88:333–382
2000
-
[30]
Interferometric synthetic aperture microscopy (ISAM)
Ralston TS, Marks DL, Carney PS, Boppart SA. Interferometric synthetic aperture microscopy (ISAM). Nat. Phys. 2007;3:965–1004
2007
-
[31]
Synthetic aperture sonar: a review of current status
Hayes MP, Gough PT. Synthetic aperture sonar: a review of current status. IEEE J. Ocean. Eng. 2009;34:207–224
2009
-
[32]
Synthetic aperture ultrasound imaging
Jensen JA, Nikolov SI, Gammelmark KL, Pedersen MH. Synthetic aperture ultrasound imaging. Ultrasonics. 2006;44:5–15
2006
-
[33]
Synthetic tracked aperture ultrasound imaging: design, simulation, and experimental evaluation
Zhang HK, Cheng A, Bottenus N, Guo X, Trahey GE, Boctor EM. Synthetic tracked aperture ultrasound imaging: design, simulation, and experimental evaluation. J. Med. Imaging. 2016;3:027001. Page 25 of 34
2016
-
[34]
Synthetic aperture ladar imaging demonstrations and information at very low return levels
Barber ZW, Dahl JR. Synthetic aperture ladar imaging demonstrations and information at very low return levels. Appl. Opt. 2014;53:5531–5537
2014
-
[35]
Synthetic aperture lidar as a future tool for earth observation
Turbide S, Marchese L, Terroux M, Bergeron A. Synthetic aperture lidar as a future tool for earth observation. Proc. SPIE. 2017;10563:1115-1122
2017
-
[36]
Kinect based real-time synthetic aperture imaging through occlusion
Yang T, Ma W, Wang S, Li J, Yu J, Zhang Y. Kinect based real-time synthetic aperture imaging through occlusion. Multimed. Tools Appl. 2016;75:6925–6943
2016
-
[37]
Occluded-object 3D reconstruction using camera array synthetic aperture imaging
Pei Z, Li Y, Ma M, Li J, Leng C, Zhang X, Zhang Y. Occluded-object 3D reconstruction using camera array synthetic aperture imaging. Sensors. 2019;19:607
2019
-
[38]
Synthetic aperture radio telescopes
Levanda R, Leshem A. Synthetic aperture radio telescopes. IEEE Signal Process. Mag. 2010;27:14–29
2010
-
[39]
Optical aperture synthesis with electronically connected telescopes
Dravins D, Lagadec T, Nuñez PD. Optical aperture synthesis with electronically connected telescopes. Nat. Commun. 2015;6:6852
2015
-
[40]
Airborne Optical Sectioning
Kurmi I, Schedl DC, Bimber O. Airborne Optical Sectioning. J. Imaging. 2018;4:102
2018
-
[41]
Synthetic aperture imaging with drones
Bimber O, Kurmi I, Schedl DC. Synthetic aperture imaging with drones. IEEE Computer Graphics and Applications. 2019;39:8 – 15
2019
-
[42]
A statistical view on synthetic aperture imaging for occlusion removal
Kurmi I, Schedl DC, Bimber O. A statistical view on synthetic aperture imaging for occlusion removal. IEEE Sensors J. 2019;19:9374 – 9383
2019
-
[43]
Thermal airborne optical sectioning
Kurmi I, Schedl DC, Bimber O. Thermal airborne optical sectioning. Remote Sens. 2019;11:1668
2019
-
[44]
Airborne Optical Sectioning for Nesting Observation
Schedl DC, Kurmi I, Bimber O. Airborne Optical Sectioning for Nesting Observation. Sci Rep. 2020;10:7254
2020
-
[45]
Fast automatic visibility optimization for thermal synthetic aperture visualization
Kurmi I, Schedl DC, Bimber O. Fast automatic visibility optimization for thermal synthetic aperture visualization. IEEE Geosci. Remote Sens. 2020;18:836-840
2020
-
[46]
Pose Error Reduction for Focus Enhancement in Thermal Synthetic Aperture Visualization
Kurmi I, Schedl DC, Bimber O. Pose Error Reduction for Focus Enhancement in Thermal Synthetic Aperture Visualization. IEEE Geosci. Remote Sens. 2021;19:1-5
2021
-
[47]
Search and rescue with airborne optical sectioning
Schedl DC, Kurmi I, Bimber O. Search and rescue with airborne optical sectioning. Nat. Mach. Intell. 2020;2:783-790
2020
-
[48]
An autonomous drone for search and rescue in forests using airborne optical sectioning
Schedl DC, Kurmi I, Bimber O. An autonomous drone for search and rescue in forests using airborne optical sectioning. Sci. Robot. 2021;6(55):1188
2021
-
[49]
Combined Person Classification with Airborne Optical Sectioning
Kurmi I, Schedl DC, Bimber O. Combined Person Classification with Airborne Optical Sectioning. Nature Scientific Reports. 2022;12:3804
2022
-
[50]
Through-Foliage Tracking with Airborne Optical Sectioning
Nathan RJAA, Kurmi I, Schedl DC, Bimber O. Through-Foliage Tracking with Airborne Optical Sectioning. J. Remote Sens. 2022;2022:9812765
2022
-
[51]
Inverse Airborne Optical Sectioning
Nathan RJAA, Kurmi I, Bimber O. Inverse Airborne Optical Sectioning. Drones. 2022;6:9. Page 26 of 34
2022
-
[52]
Evaluation of Color Anomaly Detection in Multispectral Images For Synthetic Aperture Sensing, Eng
Seits F, Kurmi I, Bimber O. Evaluation of Color Anomaly Detection in Multispectral Images For Synthetic Aperture Sensing, Eng. 2022;3(4):541-553
2022
-
[53]
Drone swarm strategy for the detection and tracking of occluded targets in complex environments
Nathan RJAA, Kurmi I, Bimber O. Drone swarm strategy for the detection and tracking of occluded targets in complex environments. Commun Eng. 2023;2:55
2023
-
[54]
Synthetic Aperture Anomaly Imaging for Through-Foliage Target Detection
Nathan RJAA, Bimber O. Synthetic Aperture Anomaly Imaging for Through-Foliage Target Detection. Remote Sens. 2023;15:18
2023
-
[55]
Stereoscopic Depth Perception Through Foliage
Kerschner R, Nathan RJAA, Mantiuk R, Bimber O. Stereoscopic Depth Perception Through Foliage. Nature Scientific Reports. 2024;14:23056
2024
-
[56]
Fusion of Single and Integral Multispectral Aerial Images
Youssef M, Bimber O. Fusion of Single and Integral Multispectral Aerial Images. Remote Sens. 2024;16(4):673
2024
-
[57]
Reciprocal Visibility for Guided Occlusion Removal With Drones
Nathan RJAA, Strand S, Shutin D, Bimber O. Reciprocal Visibility for Guided Occlusion Removal With Drones. IEEE Geosci. Remote Sens. 2024;21:1–5
2024
-
[58]
DeconvolutionLab2: An open-source software for deconvolution microscopy
Sage D, Lauréne D, Ferréol S, Denis F, Guillaume S, Arne S, Romain G, Cédric V, Michael U. DeconvolutionLab2: An open-source software for deconvolution microscopy. Methods. 2017;115:28-41
2017
-
[59]
Three-dimensional imaging by deconvolution microscopy
McNally JG, Karpova T, Cooper J, Conchello JA. Three-dimensional imaging by deconvolution microscopy. Methods. 1999;19(3):373–385
1999
-
[60]
Deconvolution methods for 3-D fluorescence microscopy images, IEEE Signal Processing Mag
Sarder P, Nehorai A. Deconvolution methods for 3-D fluorescence microscopy images, IEEE Signal Processing Mag. 2006;23(3):32–45
2006
-
[61]
Blind depth-variant deconvolution of 3D data in wide-field fluorescence microscopy, Sci
Kim B, Naemura T. Blind depth-variant deconvolution of 3D data in wide-field fluorescence microscopy, Sci. Rep. 2015;5:9894
2015
-
[62]
A novel variational approach for multiphoton microscopy image restoration: from PSF estimation to 3D deconvolution
Ajdenbaum J, Chouzenoux E, Lefort C, Martin S, Pesquet JC. A novel variational approach for multiphoton microscopy image restoration: from PSF estimation to 3D deconvolution. Inverse Probl. 2024;40(6):065003
2024
-
[63]
Depth and DOF Cues Make A Better Defocus Blur Detector
Jin Y, Qian M, Xiong J, Xue N, Xia GS. Depth and DOF Cues Make A Better Defocus Blur Detector. Paper presented at: ICME 2023. Proceeding of IEEE International Conference on Multimedia and Expo; 2023 Jul 10; Brisbane, Australia
2023
-
[64]
Depth from Defocus vs
Schechner YY, Kiryati N. Depth from Defocus vs. Stereo: How Different Really Are They?. International Journal of Computer Vision. 2000;39:141–162
2000
-
[65]
A state-of-the-art review of image motion deblurring techniques in precision agriculture
Huihui Y, Daoliang L, Yingyi C. A state-of-the-art review of image motion deblurring techniques in precision agriculture. Heliyon. 2023;9:6
2023
-
[66]
Correction of out-of-focus microscopic images by deep learning
Zhang C, Jiang H, Liu W, Li J, Tang S, Juhas M, Zhang Y. Correction of out-of-focus microscopic images by deep learning. Computational and Structural Biotechnology Journal. 2022;20:1957–1966
2022
-
[67]
Monitoring vegetation systems in the Great Plains with ERTS
Rouse JW, Haas RH, Schell JA, Deering DW. Monitoring vegetation systems in the Great Plains with ERTS. NASA Spec. Publ. 1974;351(1):309. Page 27 of 34
1974
-
[68]
Monitoring forest structure to guide adaptive management of forest restoration: a review of remote sensing approaches
Camarretta N, Harrison PA, Bailey T, Potts B, Lucieer A, Davidson N, Hunt M. Monitoring forest structure to guide adaptive management of forest restoration: a review of remote sensing approaches. New Forests. 2020;51(4):573-596
2020
-
[69]
Global patterns and climatic controls of forest structural complexity
Ehbrecht M, Seidel D, Annighöfer P, Kreft H, Köhler M, Zemp DC, Puettmann K, Nilus R, Babweteera F, Willim K, Stiers M. Global patterns and climatic controls of forest structural complexity. Nat. Commun. 2021;12(1):519
2021
-
[70]
Mahecha MD, Bastos A, Bohn FJ, Eisenhauer N, Feilhauer H, Hartmann H, Hickler T, Kalesse-Los H, Migliavacca M, Otto FE, Peng J, Biodiversity loss and climate extremes— study the feedbacks. Nature. 2022;612(7938):30-32
2022
-
[71]
Improved allometric models to estimate the aboveground biomass of tropical trees
Chave J, Réjou‐Méchain M, Búrquez A, Chidumayo E, Colgan MS, Delitti WBC, Duque A, Eid T, Fearnside PM, Goodman RC, Henry M. Improved allometric models to estimate the aboveground biomass of tropical trees. Global change biology, 2014; 20(10):3177- 3190
2014
-
[72]
Mapping carbon accumulation potential from global natural forest regrowth
Cook-Patton SC, Leavitt SM, Gibbs D, Harris NL, Lister K, Anderson-Teixeira KJ, Briggs RD, Chazdon RL, Crowther TW, Ellis PW, Griscom HP. Mapping carbon accumulation potential from global natural forest regrowth. Nature. 2020; 585:545–550
2020
-
[73]
Vegetation stands biomass and carbon stock estimation using NDVI-Landsat 8 imagery in mixed garden of Rancakalong
Malik AD, Nasrudin A, Withaningsih S. Vegetation stands biomass and carbon stock estimation using NDVI-Landsat 8 imagery in mixed garden of Rancakalong. Paper presented at: IOP Conference Series: Earth and Environmental Science 2023. Proceeding of IOP Publishing; 2023 jul; Sum...
2023
-
[74]
Biodiversity loss and climate extremes—study the feedbacks
Mahecha MD, Bastos A, Bohn FJ, Eisenhauer N, Feilhauer H, Hartmann H, Hickler T, Kalesse-Los H, Migliavacca M, Otto FEL, Peng J. Biodiversity loss and climate extremes—study the feedbacks. Nature. 2022;612(7938):30-32
2022
-
[75]
Emerging signals of declining forest resilience under climate change
Forzieri G, Dakos V, McDowell NG, Ramdane A, Cescatti A. Emerging signals of declining forest resilience under climate change. Nature. 2022; 608(7923):534-539
2022
-
[76]
BeyondPixels: A comprehensive review of the evolution of neural radiance fields
Rabby AKM, Zhang C. BeyondPixels: A comprehensive review of the evolution of neural radiance fields. arXiv. 2023. https://arxiv.org/pdf/2306.03000
2023 arXiv
-
[77]
A survey on 3d gaussian splatting
Chen G, Wang W. A survey on 3d gaussian splatting. arXiv. 2024. https://arxiv.org/pdf/2401.03890
2024 arXiv
-
[78]
A new method for voxel‐based modelling of three‐dimensional forest scenes with integration of terrestrial and airborne LiDAR data
Li W, Hu X, Su Y, Tao S, Ma Q, Guo Q. A new method for voxel‐based modelling of three‐dimensional forest scenes with integration of terrestrial and airborne LiDAR data. Methods in Ecology and Evolution. 2024;15(3):569-582
2024
-
[79]
Sensitivity of voxel-based estimations of leaf area density with terrestrial LiDAR to vegetation structure and sampling limitations: A simulation experiment
Soma M, Pimont F, Dupuy JL. Sensitivity of voxel-based estimations of leaf area density with terrestrial LiDAR to vegetation structure and sampling limitations: A simulation experiment. Remote Sens. Environ. 2021;257:112354
2021
-
[80]
Beyond Vegetation: A Review Unveiling Additional Insights into Agriculture and Forestry through the Application of Vegetation Indices
Vélez S, Martínez-Peña R, Castrillo D. Beyond Vegetation: A Review Unveiling Additional Insights into Agriculture and Forestry through the Application of Vegetation Indices. J-Multidisciplinary Scientific Journal. 2023;6(3):421-436. Page 28 of 34
2023
-
[81]
Multispectral Light Detection and Ranging Technology and Applications: A Review
Takhtkeshha N, Mandlburger G, Remondino F, Hyyppä J. Multispectral Light Detection and Ranging Technology and Applications: A Review. Sensors. 2024;24:1669
2024
-
[82]
Combining multispectral imagery and synthetic aperture radar for detecting deforestation
Reinisch EC, Ziemann A, Flynn EB, Theiler J. Combining multispectral imagery and synthetic aperture radar for detecting deforestation. In Algorithms, Technologies, and Applications for Multispectral and Hyperspectral Imagery XXVI. 2020;11392:72-85
2020
-
[83]
Novel Algorithms for Remote Estimation of Vegetation Fraction
Gitelson AA, Kaufman YJ, Stark R, Rundquist D. Novel Algorithms for Remote Estimation of Vegetation Fraction. Remote Sens. Environ. 2002;80:76–87
2002
-
[84]
Under-Canopy Drone 3D Surveys for Wild Fruit Hotspot Mapping
Trybała P, Morelli L, Remondino F, Farrand L, Couceiro MS. Under-Canopy Drone 3D Surveys for Wild Fruit Hotspot Mapping. Drones. 2024;8(10):577
2024
-
[85]
Forest in situ observations through a fully automated under-canopy unmanned aerial vehicle
Liang X, Yao H, Qi H, Wang X. Forest in situ observations through a fully automated under-canopy unmanned aerial vehicle. Geo-Spatial Information Science. 2024;27(4):983–999
2024
-
[86]
A Drone-based Prototype Design and Testing for Under- the-canopy Imaging and Onboard Data Analytics
Zanone RO, Liu T, Velni JM. A Drone-based Prototype Design and Testing for Under- the-canopy Imaging and Onboard Data Analytics. IFAC-PapersOnLine. 2022;55(32):171- 176
2022
-
[87]
Exploring the potential of transmittance vegetation indices for leaf functional traits retrieval
Chen Y, Sun J, Wang L, Shi S, Qiu F, Gong W, Tagesson T. Exploring the potential of transmittance vegetation indices for leaf functional traits retrieval. GIScience & Remote Sensing. 2023;60(1):2168410
2023
-
[88]
Review of indirect optical measurements of leaf area index: Recent advances, challenges, and perspectives
Yan G, Hu R, Luo J, Weiss M, Jiang H, Mu X, Xie D, Zhang W. Review of indirect optical measurements of leaf area index: Recent advances, challenges, and perspectives. Agricultural and Forest Meteorology. 2019;265:390-411. Page 29 of 34 Supplementary Materials for DeepForest: S...
2019
-
[2016]
Proceeding of IEEE Conference on Computer Vision and Pattern Recognition;2016 Dec 12; Las Vegas, NV, USA
2016
Reviewed August 9, 2026 · model on record in the stance chip above.
Discussion (0). Continue with ORCID to comment.