REVIEW 3 major objections 5 minor 52 references
The Stellar Abundances and Galactic Evolution Survey (SAGES). II. Machine Learning-Based Stellar parameters for 21 million stars from the First Data Release
T0 review · 3 major / 5 minor · reviewed 2026-08-09 · deepseek-v4-flash
Pith's one-line read This paper claims SAGES uv photometry plus Gaia colors, run through a random forest trained on spectroscopy, recovers metallicity, surface gravity, and temperature for 21 million Northern-sky stars at 0.09-dex, 0.12-dex, and 70-K precision.
desk verdict A useful 21M-star northern photometric catalog with a clean ML pipeline, but the accuracy claims are undercut by an unaddressed 0.6 dex offset for one open cluster and an unexplained calibration shift. read the letter →
The pith
A machine-rendered reading of the paper's core claim, the machinery that carries it, and where it could break.
The reading
What carries the argument
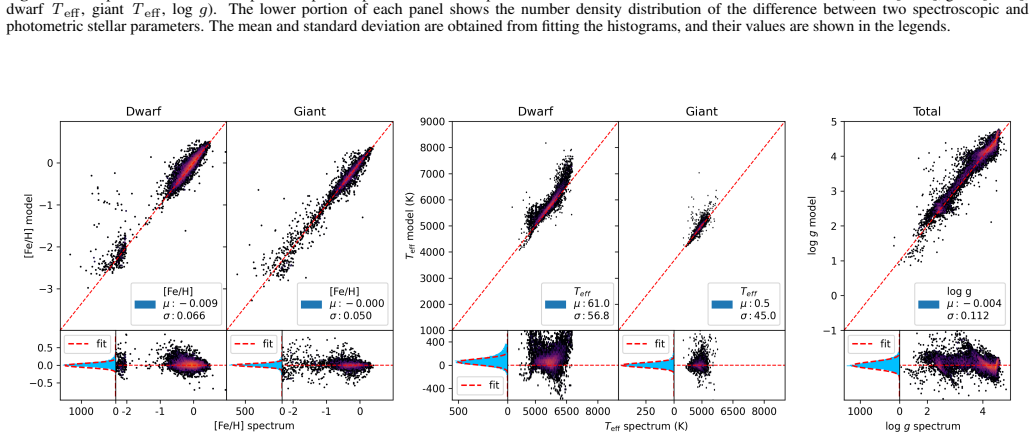
The carrying mechanism is the random forest, an ensemble of decision trees that split on the Gini index, configured with 300 trees, all features per split, and a maximum depth of 17, and trained as five separate models: $[\mathrm{Fe/H}]$ for dwarfs, $[\mathrm{Fe/H}]$ for giants, $T_{\mathrm{eff}}$ for dwarfs, $T_{\mathrm{eff}}$ for giants, and one unified $\log g$ model for both classes. The physical carrier is the SAGES filter design: the u and v bands straddle the Balmer jump, which is sensitive to surface gravity, while the v band sits on the Ca II H and K lines, which are sensitive to metallicity, and the Gaia Bp/Rp colors together with the parallax-based absolute G magnitude carry temperature and the dwarf/giant separation. Model inputs are extinction-corrected magnitudes, reddening-corrected colors, parallax, absolute G magnitude, and $\mathrm{E}(B-V)$, with the SFD98 map providing the extinction corrections. Stars redder than $(Bp-Rp)_0 = 1.598$ are excluded from the final catalog because the forest extrapolates poorly at low temperature.
What would settle it
High-resolution spectroscopy of a few hundred catalog stars in the metal-poor regime would settle the scale question: if the photometric $[\mathrm{Fe/H}]$ values below $[\mathrm{Fe/H}] \approx -2$ deviate from the spectroscopic values by more than the claimed 0.2–0.3 dex, or if the residuals trend with metallicity instead of staying flat, the single-offset scale inheritance fails. A faster check is to cross-match the nine literature metal-poor samples against LAMOST directly and test whether one constant +0.427 offset actually reconciles them.
Extended reading notes
Core claim
The central discovery claim is that the SAGES u and v bands combined with Gaia EDR3 broad-band colors and parallaxes carry enough information for a random forest to recover $[\mathrm{Fe/H}]$, $\log g$, and $T_{\mathrm{eff}}$ at precisions of 0.09 dex, 0.12 dex, and 70 K, for both dwarf and giant stars. The metallicity scale is set by the training labels: LAMOST DR10 parameters for the bulk of the sample, supplemented at the metal-poor end by PASTEL and RAVE, with nine high-resolution literature samples used as a low-metallicity test after a single +0.427 dex offset is applied to place them on the LAMOST scale. Adding 2MASS, WISE, and GALEX photometry improves precision for a subsample of 2,191,452 stars, but the authors retain the larger SAGES-plus-Gaia sample as the main catalog because the richer dataset suffers stronger selection effects. The paper further claims the precision degrades to only 0.2–0.3 dex below $[\mathrm{Fe/H}] = -2$, and that cluster and external-catalog comparisons are consistent with the quoted dispersions.
Load-bearing premise
The catalog's absolute accuracy is inherited whole from the LAMOST DR10 spectroscopic parameter scale used as training labels, together with a single +0.427 dex offset applied to nine independent metal-poor samples; if that scale is biased, or if one constant cannot reconcile the literature scales, every $[\mathrm{Fe/H}]$ in the final catalog shifts systematically, and the stated 0.09 dex is an agreement with APOGEE rather than an absolute calibration.
Editorial extensions
If this is right
- The catalog gives photometric $[\mathrm{Fe/H}]$, $\log g$, and $T_{\mathrm{eff}}$ for 21,071,305 Northern-sky stars, 19,663,040 dwarfs and 1,408,265 giants, at claimed precisions of about 0.09 dex, 0.12 dex, and 70 K.
- Dispersion grows to 0.2–0.3 dex only for $[\mathrm{Fe/H}] < -2$, so the catalog can supply very and extremely metal-poor candidates without new spectroscopy.
- The five-model setup covers giants and dwarfs with the same pipeline, so the method applies across the color-magnitude diagram rather than only to FGK dwarfs.
- Because random forests accept arbitrary feature sets, the same models can absorb the upcoming SAGES DDO51 and H-alpha bands, which the paper points out should improve $\log g$ in particular.
- In the main catalog, about 0.03% of dwarfs and 0.21% of giants sit at $[\mathrm{Fe/H}] \leq -2$, quantifying the metal-poor candidate yield the catalog offers.
Reading between the lines
- A corollary the paper leaves implicit is that the catalog extrapolates the LAMOST DR10 metallicity scale to roughly twenty times more stars, so a future recalibration of LAMOST would propagate through nearly every entry; the $[\mathrm{Fe/H}]$ values are best read as precise but anchored to that one external scale.
- The single +0.427 dex offset is the likeliest place the metal-poor tail could bend: if the offset is metallicity-dependent rather than constant, the catalog's $[\mathrm{Fe/H}] < -2$ statistics would be compressed or stretched while near-solar values stay correct.
- The ~50 K systematic temperature offset against the H23 catalog hints that part of the error budget lives in the SAGES DR1 photometry itself, which would make the planned DDO51 and H-alpha bands not just precision upgrades but a possible handle on those systematics.
- The same filter logic, a Balmer-jump straddle plus a Ca II H and K band, is shared with other recent medium-band surveys, so this random-forest recipe is a transferable template for turning their photometry into stellar parameters.
Editorial analysis
A structured set of objections, weighed in public.
Referee Report
Summary. The paper presents a machine-learning pipeline, based on the random forest algorithm, that estimates effective temperature, surface gravity, and metallicity for approximately 21 million stars by combining SAGES DR1 u/v photometry with Gaia EDR3 photometry and astrometry. A second catalog of about 2.2 million stars additionally incorporates 2MASS, WISE, and GALEX photometry. The models are trained on LAMOST DR10 parameters and tested on APOGEE, with additional external checks against the H23 and A23 catalogs and against four star clusters. The claimed precisions are about 0.09 dex in [Fe/H], 0.12 dex in log g, and 70 K in Teff. The manuscript also applies a +0.427 dex correction to the metallicities of nine metal-poor literature samples used as a low-metallicity test set. The paper concludes that the resulting catalogs are suitable for metal-poor star selection and Milky Way structure studies.
Significance. If the stated precisions are accurate, the catalog would be a valuable resource for Galactic archaeology and for selecting metal-poor and extremely metal-poor candidates for follow-up spectroscopy. The validation design is sound in outline: a separate APOGEE test set, comparisons with two published catalogs, and cluster-based checks go beyond many comparable photometric surveys. The strongest features are the use of a medium-band filter set with metallicity sensitivity and the explicit recognition that train/test separation across different spectroscopic surveys is necessary. However, the absolute calibration ultimately rests on the LAMOST scale, and the paper contains two validation issues that directly affect the accuracy claim: the unexplained +0.427 dex offset and an unaddressed ~0.6 dex discrepancy for the open cluster NGC 2420. These issues do not invalidate the catalog's usefulness as a relative indicator, but they must be resolved or clearly quantified before the absolute accuracy claims in the abstract and Section 3.3 can be accepted.
major comments (3)
- [Section 2.3] The statement that 'a correction of 0.427 in [Fe/H] is applied to the data from 9 papers' is not accompanied by any explanation of how this number was derived. If the offset was tuned to minimize residuals between the photometric predictions and the literature values for the same stars, then the subsequent low-metallicity comparison in Section 3.5 is not an independent test. Please provide the derivation, the paper-by-paper offsets and their scatter, and justify why a single additive constant is sufficient to reconcile the scales of nine different studies.
- [Section 3.5, Figure 11] Figure 11 shows that for the metal-rich open cluster NGC 2420 the catalog mean metallicity is -0.339 ± 0.088, while the quoted Cantat-Gaudin et al. (2018) value is +0.279, a discrepancy of about -0.6 dex. The paper states that the metal-poor cluster offsets are consistent with the test set but does not mention NGC 2420 at all; this is a direct test of the absolute metallicity scale in the regime where Section 3.3 claims accuracy better than 0.1 dex. The authors should either explain this offset (e.g., member contamination, metallicity scale differences, or a systematic in the model) or amend the accuracy claims in the abstract and Section 3.3 to exclude this regime.
- [Section 3.3] The quoted precision of 0.09 dex refers to the scatter against the APOGEE test set. Because the model is trained on LAMOST DR10 labels, the absolute zero point of the catalog is inherited from LAMOST, and any metallicity- or temperature-dependent bias in those labels propagates directly into the final catalog. The paper should explicitly state that the APOGEE comparison measures precision and relative accuracy, not absolute calibration against an independent standard, and should discuss the extent to which the external catalog and cluster comparisons constrain the LAMOST scale.
minor comments (5)
- [Table 3] There are typos in the table: 'parallex' should be 'parallax' and 'Uncentainty' should be 'Uncertainty' in the magnitude and proper-motion entries.
- [Section 2.2] The phrase 'the most metal-poor star reliably estimated by most pipelines in DR10 is only be about [Fe/H] ∼ −2.5' contains a grammatical error ('is only be about') and could be rephrased.
- [Figure 12] The histogram bin labels such as '1 < [Fe/H] 0' should be written with clear inequalities (e.g., '-1 < [Fe/H] ≤ 0') to avoid ambiguity.
- [Section 4] The sentence about removing low-temperature stars with (Bp − Rp)0 > 1.598 would benefit from a brief justification of this cut and a statement of how many stars were discarded; the point that random forest extrapolates poorly is made but the threshold choice is not discussed.
- [Section 3.4] The comparison with H23 shows a ~50 K systematic difference in Teff that the authors attribute to the training set; this is worth a short discussion of whether it also affects the log g or [Fe/H] zero points.
Circularity Check
Minor scale-calibration caveat at low metallicity, but the central 21-million-star parameter derivation is not circular: it is an empirical photometric-to-spectroscopic mapping validated against independent APOGEE labels.
-
other
[Section 2.3, repeated in Section 2.5; used in the low-metallicity validation in Sections 3.3 and 3.5]
"Considering the systematic differences in the parameters provided by different datasets, a correction of 0.427 in [Fe/H] is applied to the data from 9 papers to account for these systematic differences."
The nine-paper test labels are transformed to [Fe/H]_lit + 0.427 before comparison with model predictions, placing them on the LAMOST training scale. The paper's claim that the metal-poor systematic errors are consistent with the test set is therefore a statement about agreement with scale-shifted labels, not an independently calibrated absolute scale. If 0.427 was estimated from these same datasets, the mean low-metallicity residual is partly forced toward zero by construction. This compromises only the low-metallicity validation; the headline 0.09 dex precision rests on the APOGEE test set and remains an independent empirical measurement.
full rationale
The central derivation is a supervised random forest mapping from SAGES DR1 + Gaia EDR3 photometry to stellar parameters, trained on LAMOST labels and tested on APOGEE, which is an independent spectroscopic survey. The reported 0.09 dex [Fe/H] precision is an empirical generalization error from that APOGEE test set (Figures 6-8), not a fitted re-description of the training labels. The catalog values are not defined in terms of the quantities they predict. External checks with Gaia XP spectra (A23), star clusters (H10/C18), and the independent APOGEE test set provide non-circular support; the H23 comparison uses the same SAGES survey and overlapping authors and is therefore not an independent anchor, but it is not load-bearing for the main claims. The only calibration concern is the +0.427 dex offset applied to nine low-metallicity literature samples before using them as test labels (Sections 2.3 and 2.5). Because the offset is applied without derivation, the low-metallicity validation is partly dependent on a scale choice, and the NGC 2420 cluster comparison shows an unaddressed ~0.6 dex discrepancy that warrants care. However, this does not make the 21-million-star catalog derivation circular; it is a scale-calibration caveat. No self-citation chain is used to establish the central result, and no ansatz is smuggled in via citation. Overall circularity is minor.
Assumptions & free parameters
free parameters (3)
- Systematic [Fe/H] offset for nine metal-poor literature samples =
+0.427 dex
- Random forest hyperparameters =
n_estimators = 300, max_depth = 17, max_features = None
- Cool-star exclusion cut =
(Bp - Rp)0 > 1.598 removed
assumptions (5)
- domain assumption Spectroscopic stellar parameters from LAMOST DR10, APOGEE DR17, RAVE DR5, and PASTEL are accurate on a common scale sufficient for training labels.
- domain assumption The SFD98 reddening map and the adopted reddening coefficients (Table 1) correctly de-redden the SAGES, Gaia, 2MASS, WISE, and GALEX photometry.
- domain assumption Gaia parallax quality (parallax error larger than the parallax indicates a giant) reliably separates dwarfs from giants.
- domain assumption The photometric color-to-parameter relation is single-valued over the training manifold, and random forest extrapolation outside it fails only in the cool-star regime.
- ad hoc to paper A single additive +0.427 dex shift reconciles the parameter scales of nine independent metal-poor papers with the LAMOST scale.
Cite this review
Pith. "Pith review of The Stellar Abundances and Galactic Evolution Survey (SAGES). II. Machine Learning-Based Stellar parameters for 21 million stars from the First Data Release." pith.science (2026). https://pith.science/paper/JXA3FEC6
@misc{pith2026250203548,
  author       = {Pith},
  title        = {Pith review of: The Stellar Abundances and Galactic Evolution Survey (SAGES). II. Machine Learning-Based Stellar parameters for 21 million stars from the First Data Release},
  year         = {2026},
  howpublished = {\url{https://pith.science/paper/JXA3FEC6}},
  note         = {Machine review of arXiv:2502.03548}
}
abstract
Stellar parameters for large samples of stars play a crucial role in constraining the nature of stars and stellar populations in the Galaxy. An increasing number of medium-band photometric surveys are presently used in estimating stellar parameters. In this study, we present a machine-learning approach to derive estimates of stellar parameters, including [Fe/H], logg, and Teff, based on a combination of medium-band and broad-band photometric observations. Our analysis employs data primarily sourced from the SAGE Survey , which aims to observe much of the Northern Hemisphere. We combine the $uv$-band data from SAGES DR1 with photometric and astrometric data from Gaia EDR3, and apply the random forest method to estimate stellar parameters for approximately 21 million stars. We are able to obtain precisions of 0.09 dex for [Fe/H], 0.12 dex for logg, and 70 K for Teff. Furthermore, by incorporating 2MASS and WISE infrared photometric and GALEX ultraviolet data, we are able to achieve even higher precision estimates for over 2.2 million stars. These results are applicable to both giant and dwarf stars. Building upon this mapping, we construct a foundational dataset for research on metal-poor stars, the structure of the Milky Way, and beyond. With the forthcoming release of additional bands from SAGE Survey such DDO51 and H-alpha, this versatile machine learning approach is poised to play an important role in upcoming surveys featuring expanded filter sets
Figures


Figures from the paper (9 more)




Reference graph
Works this paper leans on
-
[1]
Abdurro’Uf, & et al. 2023, VizieR Online Data Catalog: APOGEE-2 DR17 final allStar catalog (Abdurro’uf+, 2022), VizieR On-line Data Catalog: III/286. Originally published in: 2022ApJS..259...35A
work page 2023
-
[2]
An, D., & Beers, T. C. 2020, ApJ, 897, 39, doi: 10.3847/1538-4357/ab8d39
-
[3]
2023, ApJS, 267, 8, doi: 10.3847/1538-4365/acd53e
Andrae, R., Rix, H.-W., & Chandra, V . 2023, ApJS, 267, 8, doi: 10.3847/1538-4365/acd53e
-
[4]
Aoki, W., Beers, T. C., Lee, Y . S., et al. 2013, AJ, 145, 13, doi: 10.1088/0004-6256/145/1/13
-
[5]
2019, AJ, 158, 93, doi: 10.3847/1538-3881/ab3048
Bai, Y ., Liu, J., Bai, Z., Wang, S., & Fan, D. 2019, AJ, 158, 93, doi: 10.3847/1538-3881/ab3048
-
[6]
Bianchi, L., Conti, A., & Shiao, B. 2014, VizieR Online Data Catalog: GALEX-GR6/7 data release (Bianchi+ 2014), VizieR On-line Data Catalog: II/335. Originally published in: 2014AdSpR..53..900B
work page 2014
-
[7]
2009, A&A, 501, 519, doi: 10.1051/0004-6361/200810610
Bonifacio, P., Spite, M., Cayrel, R., et al. 2009, A&A, 501, 519, doi: 10.1051/0004-6361/200810610
-
[8]
2021, A&A, 653, A31, doi: 10.1051/0004-6361/202038841
Bonoli, S., Mar´ın-Franch, A., Varela, J., et al. 2021, A&A, 653, A31, doi: 10.1051/0004-6361/202038841
Show all 52 references
-
[9]
2001, Machine Learning, 45, 5, doi: 10.1023/A:1010933404324
Breiman, L. 2001, Machine Learning, 45, 5, doi: 10.1023/A:1010933404324
2001 doi
-
[10]
2018, A&A, 618, A93, doi: 10.1051/0004-6361/201833476
Cantat-Gaudin, T., Jordi, C., Vallenari, A., et al. 2018, A&A, 618, A93, doi: 10.1051/0004-6361/201833476
2018 doi
-
[11]
J., Moles, M., Crist´obal-Hornillos, D., et al
Cenarro, A. J., Moles, M., Crist´obal-Hornillos, D., et al. 2019, A&A, 622, A176, doi: 10.1051/0004-6361/201833036
2019 doi
-
[12]
K., et al
Chiti, A., Frebel, A., Mardini, M. K., et al. 2021, ApJS, 254, 31, doi: 10.3847/1538-4365/abf73d
2021 doi
-
[13]
L., Barnes, J
Crawford, D. L., Barnes, J. V ., & Golson, J. C. 1970, AJ, 75, 624, doi: 10.1086/110996
1970 doi
-
[14]
2012, Research in Astronomy and Astrophysics, 12, 1197, doi: 10.1088/1674-4527/12/9/003
Cui, X.-Q., Zhao, Y .-H., Chu, Y .-Q., et al. 2012, Research in Astronomy and Astrophysics, 12, 1197, doi: 10.1088/1674-4527/12/9/003
2012 doi
-
[15]
M., Skrutskie, M
Cutri, R. M., Skrutskie, M. F., van Dyk, S., et al. 2003, 2MASS All Sky Catalog of point sources
2003
-
[16]
M., Wright, E
Cutri, R. M., Wright, E. L., Conrow, T., et al. 2021, VizieR Online Data
2021
-
[17]
2020, ApJ, 898, 150, doi: 10.3847/1538-4357/ab9d1a
Ezzeddine, R., Rasmussen, K., Frebel, A., et al. 2020, ApJ, 898, 150, doi: 10.3847/1538-4357/ab9d1a
2020 doi
-
[18]
2023, ApJS, 268, 9, doi: 10.3847/1538-4365/ace04a Franc ¸ois, P., Caffau, E., Bonifacio, P., et al
Fan, Z., Zhao, G., Wang, W., et al. 2023, ApJS, 268, 9, doi: 10.3847/1538-4365/ace04a Franc ¸ois, P., Caffau, E., Bonifacio, P., et al. 2018, A&A, 620, A187, doi: 10.1051/0004-6361/201834375 Gaia Collaboration, Brown, A. G. A., Vallenari, A., et al. 2021, A&A, 649, A1, doi: 10...
2023 doi
-
[19]
A., Daflon, S., Placco, V
Galarza, C. A., Daflon, S., Placco, V . M., et al. 2022, A&A, 657, A35, doi: 10.1051/0004-6361/202141717
2022 doi
- [20]
-
[21]
1998, A&AS, 129, 431, doi: 10.1051/aas:1998195
Hauck, B., & Mermilliod, M. 1998, A&AS, 129, 431, doi: 10.1051/aas:1998195
1998 doi
-
[22]
Q., Yuan, H
Huang, Y ., Chen, B. Q., Yuan, H. B., et al. 2019, ApJS, 243, 7, doi: 10.3847/1538-4365/ab1f72
2019 doi
-
[23]
C., Wolf, C., et al
Huang, Y ., Beers, T. C., Wolf, C., et al. 2022, ApJ, 925, 164, doi: 10.3847/1538-4357/ac21cb
2022 doi
-
[24]
C., Yuan, H., et al
Huang, Y ., Beers, T. C., Yuan, H., et al. 2023, ApJ, 957, 65, doi: 10.3847/1538-4357/ace628 Ivezi´c, ˇZ., Sesar, B., Juri´c, M., et al. 2008, ApJ, 684, 287, doi: 10.1086/589678
2023 doi
-
[25]
2007, in Astronomical Society of the Pacific Conference Series, V ol
Keller, S., Bessell, M., Schmidt, B., & Francis, P. 2007, in Astronomical Society of the Pacific Conference Series, V ol. 364, The Future of
2007
-
[26]
F., Ardizzone, L., Klessen, R., et al
Ksoll, V . F., Ardizzone, L., Klessen, R., et al. 2020, MNRAS, 499, 5447, doi: 10.1093/mnras/staa2931
2020 doi
-
[27]
2017, AJ, 153, 75, doi: 10.3847/1538-3881/153/2/75
Kunder, A., Kordopatis, G., Steinmetz, M., et al. 2017, AJ, 153, 75, doi: 10.3847/1538-3881/153/2/75
2017 doi
-
[28]
K., Bolte, M., Johnson, J
Lai, D. K., Bolte, M., Johnson, J. A., & Lucatello, S. 2004, in American Astronomical Society Meeting Abstracts, V ol. 205, American Astronomical Society Meeting Abstracts, 52.10
2004
-
[29]
2018, ApJS, 238, 16, doi: 10.3847/1538-4365/aada4a
Li, H., Tan, K., & Zhao, G. 2018, ApJS, 238, 16, doi: 10.3847/1538-4365/aada4a
2018 doi
-
[30]
C., et al
Limberg, G., Rossi, S., Beers, T. C., et al. 2021, ApJ, 907, 10, doi: 10.3847/1538-4357/abcb87
2021 doi
-
[31]
2024, ApJS, 271, 26, doi: 10.3847/1538-4365/ad1eea
Lu, X., Yuan, H., Xu, S., et al. 2024, ApJS, 271, 26, doi: 10.3847/1538-4365/ad1eea
2024 doi
-
[32]
R., Schiavon, R
Majewski, S. R., Schiavon, R. P., Frinchaboy, P. M., et al. 2017, AJ, 154, 94, doi: 10.3847/1538-3881/aa784d
2017 doi
-
[33]
F., Starkenburg, E., Yuan, Z., et al
Martin, N. F., Starkenburg, E., Yuan, Z., et al. 2023, arXiv e-prints, arXiv:2308.01344, doi: 10.48550/arXiv.2308.01344 Mendes de Oliveira, C., Ribeiro, T., Schoenell, W., et al. 2019, MNRAS, 489, 241, doi: 10.1093/mnras/stz1985 Nordstr¨om, B., Andersen, J., Holmberg, J., et a...
-
[34]
M., Lee, Y
Rockosi, C. M., Lee, Y . S., Morrison, H. L., et al. 2022, ApJS, 259, 60, doi: 10.3847/1538-4365/ac5323
2022 doi
-
[35]
C., & Casey, A
Schlaufman, K. C., & Casey, A. R. 2014, ApJ, 797, 13, doi: 10.1088/0004-637X/797/1/13
2014 doi
-
[36]
J., Finkbeiner, D
Schlegel, D. J., Finkbeiner, D. P., & Davis, M. 1998, ApJ, 500, 525, doi: 10.1086/305772
1998 doi
-
[37]
2016, A&A, 591, A118, doi: 10.1051/0004-6361/201628497
Soubiran, C., Le Campion, J.-F., Brouillet, N., & Chemin, L. 2016, A&A, 591, A118, doi: 10.1051/0004-6361/201628497
2016 doi
-
[38]
2017, MNRAS, 471, 2587, doi: 10.1093/mnras/stx1068 Str¨omgren, B
Starkenburg, E., Martin, N., Youakim, K., et al. 2017, MNRAS, 471, 2587, doi: 10.1093/mnras/stx1068 Str¨omgren, B. 1964, Astrophysica Norvegica, 9, 333
2017 doi
-
[39]
2022, Research in Astronomy and Astrophysics, 22, 105004, doi: 10.1088/1674-4527/ac8b5b
Tan, K.-F., Zhao, G., Fan, Z., et al. 2022, Research in Astronomy and Astrophysics, 22, 105004, doi: 10.1088/1674-4527/ac8b5b
2022 doi
-
[40]
2014, in Setting the scene for Gaia and LAMOST, ed
Wang, W., Zhao, G., Chen, Y ., & Liu, Y . 2014, in Setting the scene for Gaia and LAMOST, ed. S. Feltzing, G. Zhao, N. A. Walton, & P. Whitelock, V ol. 298, 326–330, doi:10.1017/S1743921313006534
2014 doi
-
[41]
D., Placco, V
Whitten, D. D., Placco, V . M., Beers, T. C., et al. 2021, ApJ, 912, 147, doi: 10.3847/1538-4357/abee7e
2021 doi
-
[42]
2022, ApJS, 263, 29, doi: 10.3847/1538-4365/ac9908
Xu, S., Yuan, H., Zhang, R., et al. 2022, ApJS, 263, 29, doi: 10.3847/1538-4365/ac9908
2022 doi
-
[43]
2022, A&A, 659, A181, doi: 10.1051/0004-6361/202142724
Yang, L., Yuan, H., Xiang, M., et al. 2022, A&A, 659, A181, doi: 10.1051/0004-6361/202142724
2022 doi
-
[44]
J., et al
Yanny, B., Rockosi, C., Newberg, H. J., et al. 2009, AJ, 137, 4377, doi: 10.1088/0004-6256/137/5/4377
2009 doi
-
[45]
E., Bessell, M
Yong, D., Norris, J. E., Bessell, M. S., et al. 2013, ApJ, 762, 26, doi: 10.1088/0004-637X/762/1/26
2013 doi
-
[46]
C., Placco, V
Yoon, J., Beers, T. C., Placco, V . M., et al. 2016, ApJ, 833, 20, doi: 10.3847/0004-637X/833/1/20
2016 doi
-
[47]
G., Adelman, J., Anderson, John E., J., et al
York, D. G., Adelman, J., Anderson, John E., J., et al. 2000, AJ, 120, 1579, doi: 10.1086/301513
2000 doi
-
[48]
2015, ApJ, 803, 13, doi: 10.1088/0004-637X/803/1/13
Yuan, H., Liu, X., Xiang, M., Huang, Y ., & Chen, B. 2015, ApJ, 803, 13, doi: 10.1088/0004-637X/803/1/13
2015 doi
-
[49]
2023, ApJS, 264, 14, doi: 10.3847/1538-4365/ac9dfa
Zhang, R., & Yuan, H. 2023, ApJS, 264, 14, doi: 10.3847/1538-4365/ac9dfa
2023 doi
-
[50]
2021, Research in Astronomy and Astrophysics, 21, 319, doi: 10.1088/1674-4527/21/12/319
Zhang, R.-Y ., Yuan, H.-B., Liu, X.-W., et al. 2021, Research in Astronomy and Astrophysics, 21, 319, doi: 10.1088/1674-4527/21/12/319
2021 doi
-
[51]
2012, Research in Astronomy and Astrophysics, 12, 723, doi: 10.1088/1674-4527/12/7/002
Zhao, G., Zhao, Y .-H., Chu, Y .-Q., Jing, Y .-P., & Deng, L.-C. 2012, Research in Astronomy and Astrophysics, 12, 723, doi: 10.1088/1674-4527/12/7/002
2012 doi
-
[52]
2018, Research in Astronomy and Astrophysics, 18, 147, doi: 10.1088/1674-4527/18/12/147 —
Zheng, J., Zhao, G., Wang, W., et al. 2018, Research in Astronomy and Astrophysics, 18, 147, doi: 10.1088/1674-4527/18/12/147 —. 2019, Research in Astronomy and Astrophysics, 19, 003, doi: 10.1088/1674-4527/19/1/3
2018 doi
Reviewed August 9, 2026 · model on record in the stance chip above.
Discussion (0). Continue with ORCID to comment.