REVIEW 3 major objections 4 minor 1 cited by
Insight-HXMT observations of the extremely bright GRB 221009A
T0 review · 3 major / 4 minor · reviewed 2026-08-16 · deepseek-v4-flash
Pith's one-line read A 0.10-second minimum variability timescale is measured for the main burst of GRB 221009A using secondary-particle signals recorded by Insight-HXMT.
desk verdict A useful recovery of HXMT light curves for GRB 221009A, but the headline MVT of 0.10 s rests on an unquantified temporal-fidelity assumption that needs a dedicated test before the value should be treated as a source property. read the letter →
The pith
A machine-rendered reading of the paper's core claim, the machinery that carries it, and where it could break.
The reading
What carries the argument
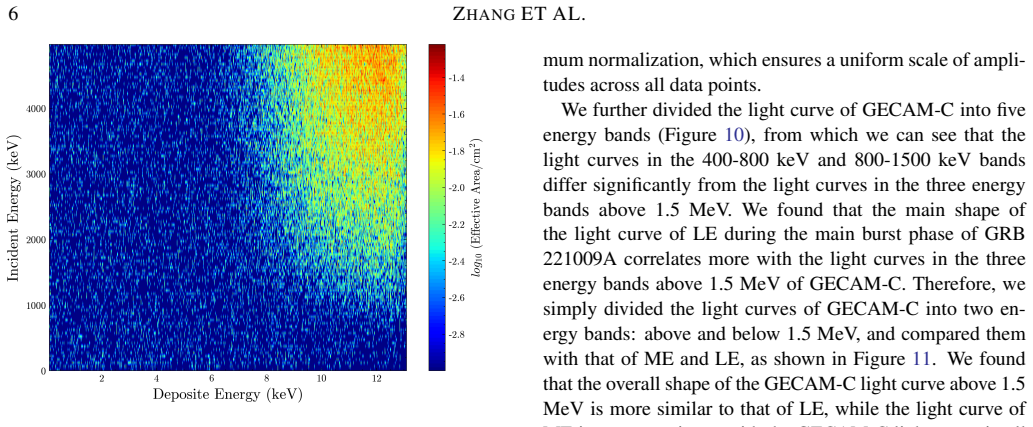
The load-bearing mechanism is indirect detection via secondary particles: gamma rays from the burst strike the satellite platform and the material surrounding the ME and LE detectors, producing electrons that deposit energy and trigger events. A Monte Carlo simulation with a mass model of the spacecraft explains the effective-area curves that make the recovered light curves energy-dependent. The temporal recovery depends on dead-time correction for ME and on saturation correction plus a special SAA-mode rescaling for LE, which the paper applies to reconstruct nearly full light curves. The minimum variability timescale (MVT, the shortest timescale at which the light curve shows significant fluctuation above background) is then measured by wavelet analysis of the 10 ms-binned ME light curve, using $10^4$ simulated background light curves to define the 99% containment band.
What would settle it
A quantitative test would be to measure the instrument's time response to a brief, well-localized gamma-ray flash in the same geometry, or to cross-correlate the 10 ms-binned, dead-time-corrected ME light curve with GECAM-C low-gain data binned at 10 ms. If the cross-correlation shows structure broader than about 0.1 s, or if the wavelet power at 0.1 s appears only after corrections are applied, the reported MVT would be an artifact rather than a property of the burst.
Extended reading notes
Core claim
The central claim is that the ME and LE telescopes detected GRB 221009A not through their nominal X-ray response but through secondary electrons produced when the burst's gamma rays interacted with satellite material, and that these indirect signals faithfully reproduce the temporal structure of the original gamma-ray light curve. The paper shows via Monte Carlo simulation that the effective area for this indirect detection rises with incident photon energy, matching the observed energy-dependent agreement: ME best follows GECAM-C above 400 keV, LE above 1.5 MeV. From the dead-time-corrected ME light curve binned at 10 ms, a wavelet analysis yields MVT = $0.10 \pm 0.01$ s for the first main bump and $0.15 \pm 0.02$ s for the second, with the former taken as the minimum variability timescale of the main burst. The authors then use this 0.10 s timescale, together with $\Gamma \approx 600$, to estimate a prompt-emission radius of about $6\times 10^{15}$ cm, consistent with the radius inferred for the evolving MeV emission line.
Load-bearing premise
The timing analysis depends on the assumption that the secondary-particle signal follows the incident gamma-ray flux with no time smearing at 0.1-second scales, and that the dead-time and saturation corrections (including the LE SAA-mode factor of $100 \times 3/4$) do not inject artificial variability; the paper validates this only by visual comparison with GECAM-C rather than with a quantitative transfer function.
Editorial extensions
If this is right
- The ME and LE light curves can be used to study the temporal structure of extremely bright GRBs even when direct gamma-ray detectors are saturated or out of field of view.
- GRB 221009A's main burst has a minimum variability timescale of $0.10 \pm 0.01$ s, placing it in the overlapping region of long and short GRBs in the MVT-duration diagram.
- Combining this MVT with $\Gamma \approx 600$ yields an internal-shock radius of roughly $6\times 10^{15}$ cm, consistent with the radius inferred for the evolving MeV emission line.
- The agreement between the corrected ME/LE light curves and GECAM-C independently supports the conclusion that GECAM-C low-gain data were unaffected by instrumental saturation.
Reading between the lines
- Beyond the paper, if secondary-particle tracking is as faithful as the visual match suggests, particle detectors on other spacecraft could be repurposed as high-time-resolution monitors for the brightest gamma-ray bursts.
- Because the indirect effective area rises with energy, the ME light curve is effectively a $\gtrsim 400$ keV light curve and the LE light curve a $\gtrsim 1.5$ MeV light curve; energy-band differences therefore matter when comparing MVT values across bursts.
- A decisive extension would be applying the same correction pipeline to a dimmer burst detected simultaneously by ME/LE and GECAM-C, to check that 0.1 s structures persist in a regime with no saturation corrections.
Signed reviews
Editorial analysis
A structured set of objections, weighed in public.
Referee Report
Summary. The paper reports Insight-HXMT observations of GRB 221009A with all three telescopes. The HE data are heavily saturated and are not analyzed in detail; the ME and LE light curves are corrected for dead time and saturation, and the LE data are additionally corrected for the SAA working mode with a factor of 100 times 3/4. The corrected ME and LE light curves are compared visually with GECAM-C low-gain light curves and are claimed to track them well, with ME matching the >400 keV band and LE matching the >1.5 MeV band. Geant4 simulations are used to argue that the ME and LE signals are dominated by secondary particles produced by the burst gamma-rays interacting with satellite material. Using the dead-time-corrected ME light curve binned at 10 ms, the authors apply a wavelet analysis and report a minimum variability timescale of MVT = 0.10 ± 0.01 s for the first main bump and 0.15 ± 0.02 s for the second, and use the former to estimate a prompt emission radius.
Significance. If the central claims hold, the paper provides a rare recovery of temporal structure during the main burst of GRB 221009A, where Fermi/GBM and HXMT/HE saturated, and it would be the first MVT measurement of the main burst episode. The external comparison with GECAM-C, which is unaffected by saturation, is a strong sanity check, and the Geant4-based interpretation in terms of secondary particles is a physically plausible explanation for why ME and LE, whose nominal response to direct gamma-rays is very small, saw the burst. However, the paper's headline quantitative result, the MVT, rests on an unquantified temporal-fidelity assumption: no injected-signal recovery test, impulse-response simulation, or quantitative cross-instrument timing comparison demonstrates that the secondary-particle-measured ME light curve preserves 0.1 s variability after dead-time correction. The comparison with GECAM-C is presented only visually and at bin sizes no finer than 50 ms, so it cannot certify fidelity at the 10 ms binning used for the MVT. The paper is therefore scientifically interesting but needs additional quantitative validation before the MVT can be accepted as a source property.
major comments (3)
- [Section 4.2, Figure 14] The MVT = 0.10 ± 0.01 s is computed from the dead-time-corrected ME light curve binned at 10 ms, but the paper provides no test showing that the secondary-particle signal and the dead-time correction preserve variability on 0.1 s timescales. The only temporal validation is visual agreement with GECAM-C at bin sizes from 0.05 s to 1 s, and GECAM-C itself has 50 ms time bins; agreement at those bin sizes does not establish fidelity at 10 ms binning. The authors should add an injected-signal recovery test (e.g., embed a synthetic 0.1 s feature into the raw ME event stream, apply the same dead-time correction and wavelet analysis, and show it is recovered) or a simulation of the temporal impulse response of the ME chain, including count-rate-dependent dead time. Without such a test, the possibility remains that 0.10 s is an instrumental floor set by the secondary-particle response or by the correction procedure rather than an intrinsic GRB timescale.
- [Section 4.1, Figures 9-13] The claim that the ME and LE light curves 'track' or 'match' the GECAM-C light curves is supported only by visual inspection and maximum-normalized overlays. No quantitative metric (cross-correlation coefficient, χ², or time-dependent residual statistics with uncertainties) is reported, and the maximum-normalization procedure can hide additive or multiplicative distortions in the recovery. This matters because the authors use this agreement to argue that the secondary-particle light curves 'can largely reproduce the temporal structure of the original high-energy gamma photons,' which is the basis for trusting the ME light curve at higher time resolution. A quantitative comparison, at least in the form of residual plots with error bars and a correlation coefficient over the main-burst interval, should be added.
- [Section 2.2, Figures 5 and 12] The LE SAA-mode correction multiplies the measured count rate by a factor of 100 times 3/4, and the paper explicitly states that 'the margin of error is significant due to the small number of counts actually detected.' The gray regions in Figures 5, 9, and 12 mark the SAA intervals, and the figure captions concede that the correction factor 'may require further refinement in the regions.' Since the LE light curve is used to support the full-coverage temporal comparison and the energy-band-dependent matching with GECAM-C, the uncertainty in these corrected intervals should be propagated into the comparison; at present it is not clear whether the agreement in the SAA-recovered intervals is consistent with the stated uncertainty or is merely qualitative.
minor comments (4)
- [Abstract and text] There are several typographical errors that should be corrected: 'Espeically' (Abstract), 'caculated' (Section 4.2), 'secondariy' (Section 5), 'unalbe' (Section 4.2), 'becuase' (Section 5), 'evlove' (Section 5), and 'bight flare' (Section 1).
- [Figure 9] The caption states that the ME light curve is multiplied by a factor of five, but the text and later figures use maximum normalization for comparisons; the relationship between the raw scaling and the normalized comparison should be clarified.
- [Section 4.1] The sentence 'the light curve of ME is most consistent with the GECAM-C light curve in all energy band' is ambiguous; the authors likely mean that ME matches the summed low-gain light curve, but this should be stated explicitly with respect to the two energy bands defined earlier.
- [Section 4.2] The wavelet background simulation uses 10^4 simulated light curves and a 99% containment interval, but the paper does not specify whether the background rate is estimated from a time interval with no burst emission or how the Poisson noise of the dead-time-corrected counts is modeled; this detail should be added for reproducibility.
Circularity Check
No significant circularity: the MVT is read off a wavelet significance test against simulated background, not fitted; the GECAM-C comparison is external; self-citations are calibration references, not load-bearing.
full rationale
The paper's central quantitative claim is the minimum variability timescale (MVT = 0.10 s) of the main burst episode, derived in Section 4.2 from the dead-time-corrected ME light curve using the wavelet method. The calculation is self-contained: the MVT is defined as the smallest timescale whose wavelet power deviates from the 99% containment interval of 10^4 simulated background light curves, with the background rate estimated from an off-burst interval. No parameter of the source light curve is fitted into the MVT, and the GECAM-C light curves are used only as an external cross-check of the temporal shape, not as an input to the wavelet analysis. The secondary-particle interpretation of the ME and LE signals is supported by a forward Geant4 simulation of the instrument mass model; the simulated effective areas are used to explain the energy-band matching with GECAM-C, but the MVT measurement does not depend on the simulation outputs. The paper's self-citations are to instrument papers, calibration references, and the dead-time correction software (e.g., Zhang et al. 2020; Xiao et al. 2020; Ge et al. 2023), which are normal load-bearing references for data reduction, not circular imports of the result. The paper explicitly acknowledges limitations, including significant uncertainty in the LE SAA-mode correction factor, and the absence of a quantitative temporal transfer-function test is a correctness/robustness concern rather than a circularity: no equation or fitted parameter reduces the MVT to an input by construction. The post hoc 1.5 MeV energy division of GECAM-C light curves shapes the interpretation of which energy band LE tracks, but it does not enter the variability measurement. Overall, the derivation chain is independent, and the central claim is validated against an external instrument, so no circular step is identified.
Assumptions & free parameters
free parameters (1)
- GECAM-C comparison band split =
1.5 MeV
assumptions (5)
- domain assumption GECAM-C low-gain light curves are free of saturation and instrumental distortions (An et al. 2023).
- domain assumption ME and LE signals are dominated by secondary particles produced by GRB gamma rays interacting with satellite material, not by direct photon detection or unrelated background.
- domain assumption Dead-time and saturation corrections, including the LE SAA-mode factor of 100 times 3/4, recover true count rates without introducing artificial variability at millisecond to 0.1 second timescales.
- standard math Wavelet significance against 10^4 simulated background light curves yields a valid MVT (Torrence and Compo 1998; Vianello et al. 2018).
- domain assumption The prompt emission radius estimate r_IS approximately 2 Gamma squared c t_v with Gamma approximately 600 from Zhang et al. 2024a is valid for this burst.
Cite this review
Pith. "Pith review of Insight-HXMT observations of the extremely bright GRB 221009A." pith.science (2026). https://pith.science/paper/4OOQTOJA
@misc{pith2026250418952,
  author       = {Pith},
  title        = {Pith review of: Insight-HXMT observations of the extremely bright GRB 221009A},
  year         = {2026},
  howpublished = {\url{https://pith.science/paper/4OOQTOJA}},
  note         = {Machine review of arXiv:2504.18952}
}
read the original abstract
The Hard X-ray Modulation Telescope (\insight) detected GRB 221009A, the brightest gamma-ray burst observed to date, with all its three telescopes, i.e. High Energy telescope (HE, 20-250 keV), Medium Energy telescope (ME, 5-30 keV), and Low Energy telescope (LE, 1-10 keV). Here we present the detailed observation results of all three telescopes of \insight~ on the prompt emission of GRB 221009A. After dead-time and data saturation correction, we recovered the light curves of HE, ME and LE telescopes and find that they generally track the GECAM-C low gain light curves that are free of data saturation issues. Particularly, the ME light curve matches the GECAM-C light curve in low gain mode above 400 keV, while the LE light curve is more consistent with the GECAM-C above 1.5 MeV. Based on simulation, we find that the signals recorded by the ME and LE are actually caused by the secondary particles produced by the interaction between GRB gamma-ray photons and the material of the satellite. Interestingly, the consistency between ME and LE light curves and GECAM-C demonstrates that ME and LE data could be used to characterize the GRB properties. Espeically, the high time resolution light curve of ME allowed us, for the first time, to calculate the minimum variability timescale (MVT = 0.10 s) of the main burst episode of GRB 221009A.
Figures


Figures from the paper (10 more)




Forward citations
Cited by 1 Pith paper
-
A set of distinctive properties ruling the prompt emission of GRB 230307A and other long {\gamma}-ray bursts from compact object mergers
GRB 230307A and several other long merger-candidate bursts show exponential evolution of pulse intensity, waiting time, duration, and spectral peak energy, contrasting with supernova-associated long bursts.
Reference graph
Works this paper leans on
-
[1]
Agapitov, O. V ., Balikhin, M., Hull, A. J., et al. 2023, ApJL, 948, L21, doi: 10.3847/2041-8213/accfa0
-
[2]
2024, doi: 10.21203/rs.3.rs-4123241/v1
An, T., Geng, J., Zhang, Y ., et al. 2024, doi: 10.21203/rs.3.rs-4123241/v1
-
[3]
2023, arXiv e-prints, arXiv:2303.01203, doi: 10.48550/arXiv.2303.01203
An, Z.-H., Antier, S., Bi, X.-Z., et al. 2023, arXiv e-prints, arXiv:2303.01203, doi: 10.48550/arXiv.2303.01203
-
[4]
2024, arXiv e-prints, arXiv:2409.04580, doi: 10.48550/arXiv.2409.04580
Axelsson, M., Ajello, M., Arimoto, M., et al. 2024, arXiv e-prints, arXiv:2409.04580, doi: 10.48550/arXiv.2409.04580
-
[5]
Battiston, R., Neub¨user, C., Follega, F. M., et al. 2023, ApJL, 946, L29, doi: 10.3847/2041-8213/acc247
-
[6]
2022, GRB Coordinates Network, 32637, 1
Bissaldi, E., Omodei, N., Kerr, M., & Fermi-LAT Team. 2022, GRB Coordinates Network, 32637, 1
work page 2022
-
[7]
Blanchard, P. K., Villar, V . A., Chornock, R., et al. 2024, Nature Astronomy, 8, 774, doi: 10.1038/s41550-024-02237-4
-
[8]
2023, ApJL, 946, L31, doi: 10.3847/2041-8213/acc39c
Burns, E., Svinkin, D., Fenimore, E., et al. 2023, ApJL, 946, L31, doi: 10.3847/2041-8213/acc39c
Show all 62 references
-
[9]
L., Li, C
Cai, C., Xiong, S. L., Li, C. K., et al. 2021, MNRAS, 508, 3910, doi: 10.1093/mnras/stab2760
2021 doi
-
[10]
2023, MNRAS, 518, 2005, doi: 10.1093/mnras/stac3075
Cai, C., Xiong, S.-L., Xue, W.-C., et al. 2023, MNRAS, 518, 2005, doi: 10.1093/mnras/stac3075
2023 doi
-
[11]
2020, Science China Physics, Mechanics, and Astronomy, 63, 249504, doi: 10.1007/s11433-019-1506-1
Cao, X., Jiang, W., Meng, B., et al. 2020, Science China Physics, Mechanics, and Astronomy, 63, 249504, doi: 10.1007/s11433-019-1506-1
2020 doi
-
[12]
2023, Science Advances, 9, eadj2778, doi: 10.1126/sciadv.adj2778
Cao, Z., Aharonian, F., An, Q., et al. 2023, Science Advances, 9, eadj2778, doi: 10.1126/sciadv.adj2778
2023 doi
-
[13]
X., et al
Cao, Z., Aharonian, F., Axikegu, Bai, Y . X., et al. 2024, PhRvL, 133, 071501, doi: 10.1103/PhysRevLett.133.071501
2024 doi
-
[14]
2020, Science China Physics, Mechanics, and Astronomy, 63, 249505, doi: 10.1007/s11433-019-1469-5
Chen, Y ., Cui, W., Li, W., et al. 2020, Science China Physics, Mechanics, and Astronomy, 63, 249505, doi: 10.1007/s11433-019-1469-5
2020 doi
-
[15]
2024, The Astrophysical Journal, 971, 55, doi: 10.3847/1538-4357/ad5cec de Ugarte Postigo, A., Izzo, L., Pugliese, G., et al
Cheng, W., Xu, W., Xiong, S., et al. 2024, The Astrophysical Journal, 971, 55, doi: 10.3847/1538-4357/ad5cec de Ugarte Postigo, A., Izzo, L., Pugliese, G., et al. 2022, GRB Coordinates Network, 32648, 1
2024 doi
-
[16]
D., Kennea, J
Dichiara, S., Gropp, J. D., Kennea, J. A., et al. 2022, GRB Coordinates Network, 32632, 1
2022
-
[17]
2022, GRB Coordinates Network, 32668, 1
Frederiks, D., Lysenko, A., Ridnaia, A., et al. 2022, GRB Coordinates Network, 32668, 1
2022
-
[18]
L., et al
Frederiks, D., Svinkin, D., Lysenko, A. L., et al. 2023, ApJL, 949, L7, doi: 10.3847/2041-8213/acd1eb
2023 doi
-
[19]
Y ., Liu, C
Ge, M. Y ., Liu, C. Z., Zhang, S. N., et al. 2023, ApJ, 953, 67, doi: 10.3847/1538-4357/acda1d
2023 doi
-
[20]
2023, GRB Coordinates Network, 33243, 1
Giarratana, S., Giroletti, M., An, T., et al. 2023, GRB Coordinates Network, 33243, 1
2023
-
[21]
Z., Butler, N
Golkhou, V . Z., Butler, N. R., & Littlejohns, O. M. 2015, ApJ, 811, 93, doi: 10.1088/0004-637X/811/2/93
2015 doi
-
[22]
2022, GRB Coordinates Network, 32660, 1
Gotz, D., Mereghetti, S., Savchenko, V ., et al. 2022, GRB Coordinates Network, 32660, 1
2022
-
[23]
A., & Gallagher, P
Hayes, L. A., & Gallagher, P. T. 2022, Research Notes of the American Astronomical Society, 6, 222, doi: 10.3847/2515-5172/ac9d2f
2022 doi
-
[24]
2022, GRB Coordinates Network, 32677, 1
Huang, Y ., Hu, S., Chen, S., et al. 2022, GRB Coordinates Network, 32677, 1
2022
-
[25]
Kocevski, D., Butler, N., & Bloom, J. S. 2007, ApJ, 667, 1024, doi: 10.1086/520041
2007 doi
-
[26]
D., Margutti, R., et al
Laskar, T., Alexander, K. D., Margutti, R., et al. 2023, ApJL, 946, L23, doi: 10.3847/2041-8213/acbfad
2023 doi
-
[27]
S., et al
Lesage, S., Veres, P., Briggs, M. S., et al. 2023, ApJL, 952, L42, doi: 10.3847/2041-8213/ace5b4 LHAASO Collaboration, Cao, Z., Aharonian, F., et al. 2023, Science, 380, 1390, doi: 10.1126/science.adg9328
2023 doi
-
[28]
K., Lin, L., Xiong, S
Li, C. K., Lin, L., Xiong, S. L., et al. 2021, Nature Astronomy, 5, 378, doi: 10.1038/s41550-021-01302-6
2021 doi
-
[29]
2018, Sci
Li, T., et al. 2018, Sci. China Phys. Mech. Astron., 61, 031011, doi: 10.1007/s11433-017-9107-5
2018 doi
-
[30]
2020a, Journal of High Energy Astrophysics, 27, 64, doi: 10.1016/j.jheap.2020.02.009 —
Li, X., Li, X., Tan, Y ., et al. 2020a, Journal of High Energy Astrophysics, 27, 64, doi: 10.1016/j.jheap.2020.02.009 —. 2020b, Journal of High Energy Astrophysics, 27, 64, doi: 10.1016/j.jheap.2020.02.009
2020 doi
- [31]
- [32]
-
[33]
2023, arXiv e-prints, arXiv:2302.14459
Liao, J.-Y ., Zhang, S., Zhang, J., et al. 2023, arXiv e-prints, arXiv:2302.14459. https://arxiv.org/abs/2302.14459 11
2023 arXiv
-
[34]
2020, Science China Physics, Mechanics, and Astronomy, 63, 249503, doi: 10.1007/s11433-019-1486-x
Liu, C., Zhang, Y ., Li, X., et al. 2020, Science China Physics, Mechanics, and Astronomy, 63, 249503, doi: 10.1007/s11433-019-1486-x
2020 doi
-
[35]
2023, ApJL, 943, L2, doi: 10.3847/2041-8213/acaf5e
Liu, R.-Y ., Zhang, H.-M., & Wang, X.-Y . 2023, ApJL, 943, L2, doi: 10.3847/2041-8213/acaf5e
2023 doi
-
[36]
2020, Journal of High Energy Astrophysics, 27, 1, doi: https://doi.org/10.1016/j.jheap.2020.04.004
Luo, Q., Liao, J.-Y ., Li, X.-F., et al. 2020, Journal of High Energy Astrophysics, 27, 1, doi: https://doi.org/10.1016/j.jheap.2020.04.004
2020 doi
-
[37]
2021, Nature Astronomy, 5, 94, doi: 10.1038/s41550-020-1192-2
Ma, X., Tao, L., Zhang, S.-N., et al. 2021, Nature Astronomy, 5, 94, doi: 10.1038/s41550-020-1192-2
2021 doi
- [38]
-
[39]
2023, ApJL, 946, L21, doi: 10.3847/2041-8213/acba17
Negro, M., Di Lalla, N., Omodei, N., et al. 2023, ApJL, 946, L21, doi: 10.3847/2041-8213/acba17
2023 doi
- [40]
-
[41]
2022, GRB Coordinates Network, 32658, 1
Pillera, R., Bissaldi, E., Omodei, N., et al. 2022, GRB Coordinates Network, 32658, 1
2022
-
[42]
E., Salafia, O
Ravasio, M. E., Salafia, O. S., Oganesyan, G., et al. 2023, A bright megaelectronvolt emission line inγ-ray burst GRB 221009A. https://arxiv.org/abs/2303.16223
2023 arXiv
-
[43]
E., Salafia, O
Ravasio, M. E., Salafia, O. S., Oganesyan, G., et al. 2024, Science, 385, 452, doi: 10.1126/science.adj3638
2024 doi
-
[44]
2022, ApJS, 259, 46, doi: 10.3847/1538-4365/ac4d22
Song, X.-Y ., Xiong, S.-L., Zhang, S.-N., et al. 2022, ApJS, 259, 46, doi: 10.3847/1538-4365/ac4d22
2022 doi
-
[45]
J., Li, C
Tan, W. J., Li, C. K., Ge, M. Y ., et al. 2022, The Astronomer’s Telegram, 15660, 1
2022
-
[46]
2023, ApJL, 946, L30, doi: 10.3847/2041-8213/acc1dc
Tiengo, A., Pintore, F., Vaia, B., et al. 2023, ApJL, 946, L30, doi: 10.3847/2041-8213/acc1dc
2023 doi
-
[47]
Torrence, C., & Compo, G. P. 1998, Bulletin of the American Meteorological Society, 79, 61, doi: 10.1175/1520-0477(1998)079⟨0061:APGTW A⟩2.0.CO;2
1998 doi
-
[48]
2022, GRB Coordinates Network, 32650, 1
Ursi, A., Panebianco, G., Pittori, C., et al. 2022, GRB Coordinates Network, 32650, 1
2022
-
[49]
2022, GRB Coordinates Network, 32636, 1
Veres, P., Burns, E., Bissaldi, E., et al. 2022, GRB Coordinates Network, 32636, 1
2022
-
[50]
2018, ApJ, 864, 163, doi: 10.3847/1538-4357/aad6ea ˇR´ıpa, J., Takahashi, H., Fukazawa, Y ., et al
Vianello, G., Gill, R., Granot, J., et al. 2018, ApJ, 864, 163, doi: 10.3847/1538-4357/aad6ea ˇR´ıpa, J., Takahashi, H., Fukazawa, Y ., et al. 2023, A&A, 677, L2, doi: 10.1051/0004-6361/202346128 ˇSiljeg, B., Boˇsnjak, ˇZ., Jeli´c, V ., et al. 2023, MNRAS, 526, 2605, doi: 10.1...
2018 doi
-
[51]
2024, ApJL, 968, L5, doi: 10.3847/2041-8213/ad4ce1
Wei, Y .-J., Ren, J., He, H.-N., et al. 2024, ApJL, 968, L5, doi: 10.3847/2041-8213/ad4ce1
2024 doi
-
[52]
A., Kennea, J
Williams, M. A., Kennea, J. A., Dichiara, S., et al. 2023, ApJL, 946, L24, doi: 10.3847/2041-8213/acbcd1
2023 doi
-
[53]
L., Liu, C
Xiao, S., Xiong, S. L., Liu, C. Z., et al. 2020, Journal of High Energy Astrophysics, 26, 58, doi: 10.1016/j.jheap.2020.02.003
2020 doi
-
[54]
S., et al
Yi, S.-X., Zhang, Z., Yorgancioglu, E. S., et al. 2024, MNRAS, 535, 982, doi: 10.1093/mnras/stae2403
2024 doi
-
[55]
2023, Science, 381, 961, doi: 10.1126/science.abo4504
You, B., Cao, X., Yan, Z., et al. 2023, Science, 381, 961, doi: 10.1126/science.abo4504
2023 doi
-
[56]
2020, Science China Physics, Mechanics, and Astronomy, 63, 249502, doi: 10.1007/s11433-019-1432-6
Zhang, S.-N., Li, T., Lu, F., et al. 2020, Science China Physics, Mechanics, and Astronomy, 63, 249502, doi: 10.1007/s11433-019-1432-6
2020 doi
-
[57]
2025, A&A, 693, A290, doi: 10.1051/0004-6361/202453174
Zhang, W.-L., Yi, S.-X., Zou, Y .-C., et al. 2025, A&A, 693, A290, doi: 10.1051/0004-6361/202453174
2025 doi
-
[58]
2024a, ApJL, 972, L25, doi: 10.3847/2041-8213/ad6df8
Zhang, Y .-Q., Lin, H., Xiong, S.-L., et al. 2024a, ApJL, 972, L25, doi: 10.3847/2041-8213/ad6df8
-
[59]
Physics, Mechanics, and Astronomy, 67, 289511, doi: 10.1007/s11433-023-2381-0
-
[60]
2024c, ApJL, 973, L17, doi: 10.3847/2041-8213/ad758e
Zhang, Z., Lin, H., Li, Z., et al. 2024c, ApJL, 973, L17, doi: 10.3847/2041-8213/ad758e
-
[61]
2020, in Astronomical Society of the Pacific Conference
Zhao, H. 2020, in Astronomical Society of the Pacific Conference
2020
-
[62]
2024, ApJL, 962, L2, doi: 10.3847/2041-8213/ad2073
Zheng, C., Zhang, Y .-Q., Xiong, S.-L., et al. 2024, ApJL, 962, L2, doi: 10.3847/2041-8213/ad2073
2024 doi
Reviewed August 16, 2026 · model on record in the stance chip above.
Discussion (0). Continue with ORCID to comment.