Enhanced timing of a 113 km O-TWTFT link with digital maximum likelihood estimation process
Pith reviewed 2026-05-22 17:19 UTC · model grok-4.3
The pith
A Complex Least Squares estimator that uses both amplitude and phase data extracts timing from optical sampling signals at received powers ten times lower than prior records.
A machine-rendered reading of the paper's core claim, the machinery that carries it, and where it could break.
Core claim
The authors introduce the Complex Least Squares method as a maximum-likelihood estimator for time extraction in O-TWTFT. Unlike earlier approaches that rely only on phase, the new estimator incorporates both amplitude and phase of the sampled frequency-comb signals. Over a 113 km free-space link the method sustains operation at an average received power of 0.1 nW, more than ten times lower than previous benchmarks, while the achieved precision nears the quantum limit.
What carries the argument
The Complex Least Squares (CLS) estimator, a maximum-likelihood technique that jointly fits amplitude and phase information from the linear optical sampling waveform.
If this is right
- Time extraction error ceases to dominate system sensitivity at ultra-low received powers.
- O-TWTFT links remain functional with average losses up to 100 dB.
- Timing precision reaches levels set by the quantum limit rather than algorithmic noise.
- Minimum received power of 0.1 nW enables tenfold reduction compared with earlier free-space demonstrations.
Where Pith is reading between the lines
- The same estimator could be tested on other comb-based optical sampling tasks to check whether amplitude-plus-phase fitting improves sensitivity there as well.
- Pairing the method with real-time turbulence compensation might push the operating range even farther without increasing transmitter power.
- Lower required received power reduces the size and cost of ground stations needed for a continental-scale optical clock network.
Load-bearing premise
The actual noise statistics of the free-space channel, including turbulence and detector effects, match the statistical model used to derive the Complex Least Squares estimator as the true maximum-likelihood solution.
What would settle it
A direct comparison of measured timing jitter at 0.1 nW received power against the photon-shot-noise quantum limit calculated for the same integration time and link parameters.
Figures


read the original abstract
Optical two-way time-frequency transfer (O-TWTFT), employing linear optical sampling and based on frequency combs, is a promising approach for future large-scale optical clock synchronization. It offers the dual benefits of high temporal resolution and an extensive unambiguous range. A critical challenge in establishing long-distance free-space optical links is enhancing detection sensitivity. Particularly at ultra-low received power levels, the error caused by time extraction algorithms for linear optical sampling becomes a significant hindrance to system sensitivity, surpassing the constraints imposed by quantum limitations. In this work, we introduce the Complex Least Squares (CLS) method to enhance both the accuracy and sensitivity of time extraction. Unlike most previous methods that relied solely on phase information, our scheme utilizes a maximum likelihood estimation technique incorporating both amplitude and phase data. Our experiments, conducted over a 113 km free-space link with an average link loss of up to 100 dB, achieved a record minimum received power of 0.1 nW, which is over ten times lower than previous benchmarks. The precision also approaches the quantum limitation.
Editorial analysis
A structured set of objections, weighed in public.
Referee Report
Summary. The paper reports an experimental demonstration of optical two-way time-frequency transfer (O-TWTFT) over a 113 km free-space link using a Complex Least Squares (CLS) estimator framed as a maximum-likelihood method that incorporates both amplitude and phase information from linear optical sampling. The central result is a record minimum received power of 0.1 nW under up to 100 dB average link loss, with timing precision stated to approach the quantum limit.
Significance. If validated, the reported sensitivity improvement would represent a meaningful advance for practical long-distance free-space optical clock synchronization by enabling operation at received powers an order of magnitude below prior benchmarks. The experimental scale (113 km link) adds value, though the attribution of the gain specifically to the CLS approach requires stronger support.
major comments (2)
- [CLS derivation and noise model] The section deriving the Complex Least Squares estimator as the maximum-likelihood solution assumes complex circular Gaussian noise statistics. Over a 113 km link with 100 dB loss, atmospheric turbulence introduces multiplicative scintillation and non-Gaussian intensity fluctuations that are not modeled or validated against measured data in the manuscript. This assumption is load-bearing for the claim that the 0.1 nW sensitivity and approach to the quantum limit are due to the amplitude-plus-phase estimator rather than other experimental factors.
- [Experimental results] The experimental results section reports the 0.1 nW minimum received power and near-quantum-limited precision but provides no quantitative error bars, details on averaging or statistical significance, or direct baseline comparisons to prior phase-only extraction methods under identical link conditions. These omissions weaken the quantitative support for the record sensitivity claim.
minor comments (2)
- [Experimental setup] Clarify the exact procedure used to determine the 100 dB link loss and 0.1 nW received power values, including any calibration steps or averaging windows.
- [Discussion] Add a brief discussion or citation addressing how the quantum limit is computed for this specific comb-based O-TWTFT configuration.
Simulated Author's Rebuttal
We thank the referee for their careful reading and constructive comments on our manuscript. We address each major comment below and describe the revisions we will incorporate.
read point-by-point responses
-
Referee: [CLS derivation and noise model] The section deriving the Complex Least Squares estimator as the maximum-likelihood solution assumes complex circular Gaussian noise statistics. Over a 113 km link with 100 dB loss, atmospheric turbulence introduces multiplicative scintillation and non-Gaussian intensity fluctuations that are not modeled or validated against measured data in the manuscript. This assumption is load-bearing for the claim that the 0.1 nW sensitivity and approach to the quantum limit are due to the amplitude-plus-phase estimator rather than other experimental factors.
Authors: We agree that the maximum-likelihood derivation of the CLS estimator assumes complex circular Gaussian noise, which is standard for heterodyne detection with a strong local oscillator in linear optical sampling. While atmospheric turbulence induces scintillation, the post-mixing sampled complex amplitudes remain approximately Gaussian due to the dominant shot-noise contribution from the local oscillator. Nevertheless, we acknowledge that explicit discussion and validation would strengthen the manuscript. In revision we will add a dedicated subsection on the noise model, its applicability under turbulence, and comparison to measured intensity statistics from the 113 km link. revision: yes
-
Referee: [Experimental results] The experimental results section reports the 0.1 nW minimum received power and near-quantum-limited precision but provides no quantitative error bars, details on averaging or statistical significance, or direct baseline comparisons to prior phase-only extraction methods under identical link conditions. These omissions weaken the quantitative support for the record sensitivity claim.
Authors: We accept that additional quantitative details are needed to support the sensitivity claims. In the revised manuscript we will include error bars derived from repeated measurements, specify the number of samples and averaging intervals used, report statistical significance, and add direct side-by-side comparisons of CLS versus phase-only extraction performed on the same 113 km link data sets. These additions will clarify the contribution of the amplitude-plus-phase estimator. revision: yes
Circularity Check
No significant circularity; experimental result is self-contained
full rationale
The paper reports an experimental demonstration of record 0.1 nW sensitivity over a 113 km free-space O-TWTFT link using the Complex Least Squares estimator, presented as a maximum-likelihood method that incorporates amplitude and phase. No derivation chain reduces a claimed prediction or first-principles result to its own inputs by construction, and the central performance claims are validated by direct measurement rather than by fitting parameters to the target outcomes or by load-bearing self-citations. The noise-model assumptions are stated explicitly but do not create a self-referential loop within the reported work.
Axiom & Free-Parameter Ledger
axioms (1)
- domain assumption The received optical sampling signal follows a statistical model for which the Complex Least Squares estimator is the maximum-likelihood solution.
Lean theorems connected to this paper
-
IndisputableMonolith/Cost/FunctionalEquation.leanwashburn_uniqueness_aczel unclear?
unclearRelation between the paper passage and the cited Recognition theorem.
we apply a least squares fitting method to the complex results of the Fourier-transformed interferograms, which is equivalent to MLE in this context... helical curve is defined by three parameters: the attenuation coefficient β, the initial phase difference term γ, and the common difference α
What do these tags mean?
- matches
- The paper's claim is directly supported by a theorem in the formal canon.
- supports
- The theorem supports part of the paper's argument, but the paper may add assumptions or extra steps.
- extends
- The paper goes beyond the formal theorem; the theorem is a base layer rather than the whole result.
- uses
- The paper appears to rely on the theorem as machinery.
- contradicts
- The paper's claim conflicts with a theorem or certificate in the canon.
- unclear
- Pith found a possible connection, but the passage is too broad, indirect, or ambiguous to say the theorem truly supports the claim.
Reference graph
Works this paper leans on
-
[20]
M. Dmitrieva, J. Lefebvre, K. delas Penas, H. L. Zen- ner, J. Richens, D. St Johnston, and J. Rittscher, Short trajectory segmentation with 1d unet framework: Appli- cation to secretory vesicle dynamics, in2020 IEEE 17th International Symposium on Biomedical Imaging (ISBI) (IEEE, 2020) pp. 891–894
work page 2020
-
[27]
M. A. Richardset al.,Fundamentals of radar signal pro- cessing, Vol. 1 (Mcgraw-hill New York, 2005). 1 Supplemental Material CLS ALGORITHM Comprehensive Description of the CLS Algorithm FIG. 4: Depiction of initial frame data points on the complex plane post-Fourier transformation. Green points A1, A2, A3, A4, A5, . . .are presented with their respective ...
work page 2005
-
[28]
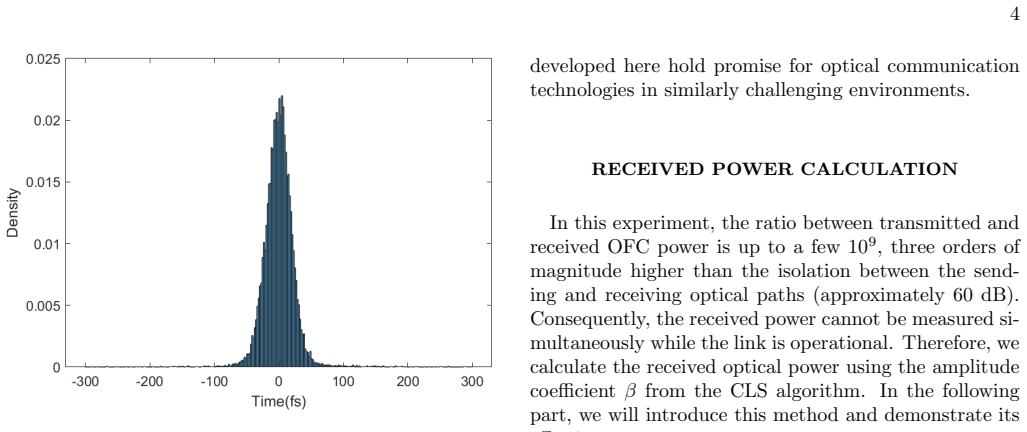
The results exhibit a normal distribution, indicat- ing that outliers are uncommon
-
[29]
Bias is absent in the estimation of delay time, en- suring the reliability of the estimation
-
[30]
Among all possible unbiased algorithms, CLS achieves the lowest error variance, signifying its su- perior precision. . DA T A FIL TERING In our experiment, due to the introduction of attenua- tors, the link loss for the 1,545-nm link was increased, po- tentially obscuring the interference patterns generated by 3 the optical comb with environmental noise. ...
-
[31]
Select high-SNR interferograms (signal power above 5 nW) and calculate the delay
-
[32]
Estimate the one-way delay of each sampling time by interpolating the high-SNR delay data
-
[33]
First, we justify the feasibility of selecting high SNR interferograms
Calculate the one-way delay for each interferogram; if it deviates by more than 1000 fs from the delay estimated from the sampling timestamp of that in- terferogram, it is deemed a noise frame. First, we justify the feasibility of selecting high SNR interferograms. According to the findings in [12], the received power is log-normally distributed due to at...
-
[34]
S. M. Brewer, J.-S. Chen, A. M. Hankin, E. R. Clements, C.-w. Chou, D. J. Wineland, D. B. Hume, and D. R. Leibrandt, Al+ 27 quantum-logic clock with a systematic uncertainty below 10- 18, Physical review letters123, 033201 (2019)
work page 2019
-
[35]
T. Bothwell, D. Kedar, E. Oelker, J. M. Robinson, S. L. Bromley, W. L. Tew, J. Ye, and C. J. Kennedy, Jila sri optical lattice clock with uncertainty of, Metrologia56, 065004 (2019)
work page 2019
-
[36]
T. L. Nicholson, S. Campbell, R. Hutson, G. E. Marti, B. Bloom, R. L. McNally, W. Zhang, M. Barrett, M. S. Safronova, G. Strouse,et al., Systematic evaluation of an atomic clock at 2×10- 18 total uncertainty, Nature communications6, 1 (2015)
work page 2015
-
[37]
N. Huntemann, C. Sanner, B. Lipphardt, C. Tamm, and E. Peik, Single-ion atomic clock with 3×10- 18 sys- tematic uncertainty, Physical review letters116, 063001 (2016)
work page 2016
- [38]
-
[39]
N. Dimarcq, M. Gertsvolf, G. Mileti, S. Bize, C. Oates, E. Peik, D. Calonico, T. Ido, P. Tavella, F. Meynadier, et al., Roadmap towards the redefinition of the second, Metrologia61, 012001 (2024)
work page 2024
-
[40]
T. E. Mehlst¨ aubler, G. Grosche, C. Lisdat, P. O. Schmidt, and H. Denker, Atomic clocks for geodesy, Re- ports on Progress in Physics81, 064401 (2018)
work page 2018
- [41]
-
[42]
P. Exertier, E. Samain, P. Bonnefond, and P. Guillemot, Status of the t2l2/jason2 experiment, Advances in Space Research46, 1559 (2010)
work page 2010
-
[43]
P. Exertier, E. Samain, N. Martin, C. Courde, M. Laas- Bourez, C. Foussard, and P. Guillemot, Time transfer by laser link: data analysis and validation to the ps level, Advances in Space Research54, 2371 (2014)
work page 2014
-
[44]
F. R. Giorgetta, W. C. Swann, L. C. Sinclair, E. Bau- mann, I. Coddington, and N. R. Newbury, Optical two- way time and frequency transfer over free space, Nature Photonics7, 434 (2013)
work page 2013
-
[45]
Q. Shen, J.-Y. Guan, J.-G. Ren, T. Zeng, L. Hou, M. Li, Y. Cao, J.-J. Han, M.-Z. Lian, Y.-W. Chen,et al., Free- space dissemination of time and frequency with 10- 19 instability over 113 km, Nature610, 661 (2022)
work page 2022
-
[46]
E. D. Caldwell, L. C. Sinclair, N. R. Newbury, and J.- D. Deschenes, The time-programmable frequency comb and its use in quantum-limited ranging, Nature610, 667 (2022)
work page 2022
-
[47]
E. D. Caldwell, J.-D. Deschenes, J. Ellis, W. C. Swann, B. K. Stuhl, H. Bergeron, N. R. Newbury, and L. C. Sinclair, Quantum-limited optical time transfer for future geosynchronous links, Nature618, 721 (2023)
work page 2023
-
[48]
H. Bergeron, L. C. Sinclair, W. C. Swann, I. Khader, K. C. Cossel, M. Cermak, J.-D. Deschˆ enes, and N. R. Newbury, Femtosecond time synchronization of optical clocks off of a flying quadcopter, Nature communications 10, 1819 (2019)
work page 2019
-
[49]
L. Kong, K. Cui, J. Shi, M. Zhu, and S. Li, 1d phase un- wrapping based on the quasi-gramian matrix and deep learning for interferometric optical fiber sensing applica- tions, Journal of Lightwave Technology40, 252 (2022)
work page 2022
-
[50]
Itoh, Analysis of the phase unwrapping algorithm, Applied optics21, 2470 (1982)
K. Itoh, Analysis of the phase unwrapping algorithm, Applied optics21, 2470 (1982)
work page 1982
- [51]
-
[52]
R. Kulkarni and P. Rastogi, Simultaneous unwrapping and low pass filtering of continuous phase maps based on autoregressive phase model and wrapped kalman fil- tering, Optics and Lasers in Engineering124, 105826 (2020)
work page 2020
-
[53]
M. Dmitrieva, J. Lefebvre, K. delas Penas, H. L. Zen- ner, J. Richens, D. St Johnston, and J. Rittscher, Short trajectory segmentation with 1d unet framework: Appli- cation to secretory vesicle dynamics, in2020 IEEE 17th 6 International Symposium on Biomedical Imaging (ISBI) (IEEE, 2020) pp. 891–894
work page 2020
-
[54]
Q. Shen, J.-Y. Guan, T. Zeng, Q.-M. Lu, L. Huang, Y. Cao, J.-P. Chen, T.-Q. Tao, J.-C. Wu, L. Hou,et al., Experimental simulation of time and frequency transfer via an optical satellite–ground link at 10-18 instability, Optica8, 471 (2021)
work page 2021
-
[55]
A. Charnes, E. L. Frome, and P.-L. Yu, The equivalence of generalized least squares and maximum likelihood esti- mates in the exponential family, Journal of the American Statistical Association71, 169 (1976)
work page 1976
-
[56]
G. Casella and R. L. Berger,Statistical inference(Cen- gage Learning, 2021)
work page 2021
- [57]
-
[58]
M. Schioppo, R. C. Brown, W. F. McGrew, N. Hinkley, R. J. Fasano, K. Beloy, T. Yoon, G. Milani, D. Nicolodi, J. Sherman,et al., Ultrastable optical clock with two cold-atom ensembles, Nature Photonics11, 48 (2017)
work page 2017
-
[59]
J. L. Ellis, M. I. Bodine, W. C. Swann, S. A. Steven- son, E. D. Caldwell, L. C. Sinclair, N. R. Newbury, and J.-D. Deschˆ enes, Scaling up frequency-comb-based opti- cal time transfer to long terrestrial distances, Physical Review Applied15, 034002 (2021)
work page 2021
-
[60]
M. A. Richardset al.,Fundamentals of radar signal pro- cessing, Vol. 1 (Mcgraw-hill New York, 2005)
work page 2005
discussion (0)
Sign in with ORCID, Apple, or X to comment. Anyone can read and Pith papers without signing in.