REVIEW 3 major objections 4 minor 126 references
FAUST XXVI. The dust opacity spectral indices of protostellar envelopes bridge the gap between interstellar medium and disks
T0 review · 3 major / 4 minor · reviewed 2026-08-07 · deepseek-v4-flash
Pith's one-line read Dust opacity spectral indices measured in protostellar envelope emission from the ALMA FAUST program fill the gap between interstellar medium and disk values, showing mostly ISM-like β and a significant decrease of β with envelope mass.
desk verdict Nine new envelope beta measurements are a real advance, but the headline correlation rests on pooling two statistically incompatible samples and an internal RCrA-IRS7B inconsistency needs fixing. read the letter →
The pith
A machine-rendered reading of the paper's core claim, the machinery that carries it, and where it could break.
The reading
What carries the argument
The central tool is a uv-plane decomposition of the ALMA continuum visibilities at 1.2 mm and 3.1 mm into a Plummer envelope model and one or more Gaussian components representing the optically thick inner disk. The spectral index $\alpha$ is computed from the binned flux ratios of the envelope emission after the compact component is subtracted, and $\beta$ is derived from $\alpha$ using an assumed dust temperature profile $T(R)=38\,(L/L_\odot)^{0.2}\,(R/100\,\mathrm{au})^{-0.4}\,\mathrm{K}$ (Eq. 4). This decomposition is what lets the authors isolate the envelope emission uncontaminated by the bright disk.
What would settle it
Measure the envelope dust spectral index at a third wavelength, for example at 0.8 mm or 7 mm, for the same FAUST sources and check whether the inferred beta and its correlation with envelope mass remain unchanged; if the derived beta shifts systematically with wavelength or when the temperature profile is replaced by temperatures measured directly from resolved molecular-line or dust-emission maps, the claim of ISM-like envelope dust would fail.
Extended reading notes
Core claim
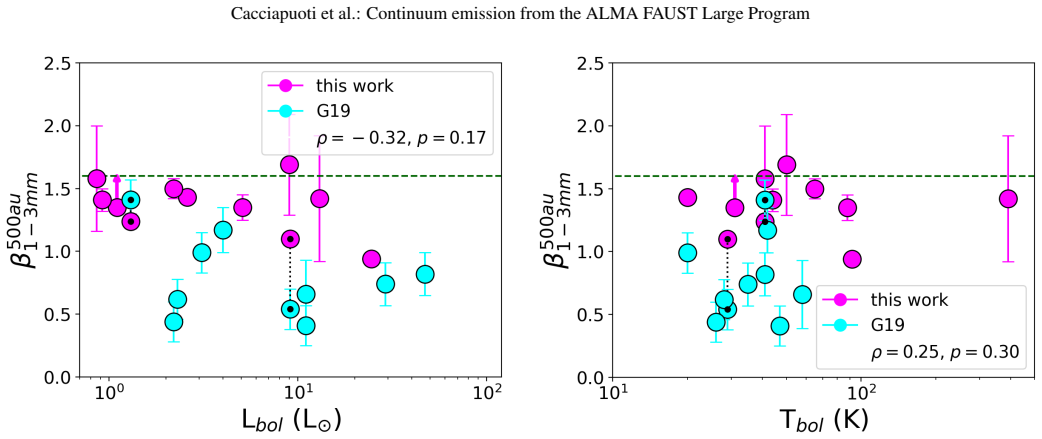
The authors measure the dust opacity spectral index $\beta$ at roughly 500 au scales in the envelopes of 11 FAUST protostars by modeling the uv-visibilities with a Plummer envelope plus Gaussian disk components and subtracting the compact optically thick emission. Eight of the eleven envelopes have $\beta$ values consistent with ISM-like dust ($\beta \approx 1.4$–$1.7$), while three sources (IRAS4A, L1551-IRS5, L1527 IRS) show lower $\beta$ ($\lesssim 1.1$), indicating either large grains or optical-depth effects. Pooling their results with the nine envelopes from the CALYPSO sample (total n=18), they confirm at p=0.01 that $\beta$ decreases with envelope mass and that the spatial gradient of $\beta$ correlates with envelope mass at p=0.001. They interpret the overall distribution as evidence that dust optical properties vary continuously from the ISM to protoplanetary disks.
Load-bearing premise
The conversion of the measured flux spectral index into the dust opacity index assumes a specific temperature profile for the envelope dust; if the envelopes are actually warmer or cooler than this profile by more than about 10 K, all the reported beta values shift.
Editorial extensions
If this is right
- Dust growth to sizes larger than about 100 $\mu$m does not appear to be the norm in protostellar envelopes, so the large grain populations seen in many disks must form within the disk itself.
- The significant anti-correlation between $\beta$ and envelope mass, if real, suggests that either more massive envelopes host larger grains or their inner regions are partially optically thick at 1 mm.
- The bridging distribution from ISM to disks provides a reference for theoretical models of dust evolution during collapse, which currently struggle to grow grains beyond roughly 2 $\mu$m in envelopes.
Reading between the lines
- Because the FAUST and CALYPSO samples have statistically different $\beta$ distributions (KS p=0.003), the pooled correlation with envelope mass may partly reflect the sample composition; a single sample with uniform selection is needed to test the correlation within a homogeneous population.
- If the low $\beta$ values in massive envelopes are due to optical depth rather than large grains, longer-wavelength observations (e.g., at 7 mm) should recover higher $\beta$, which would resolve the degeneracy.
- The ISM-like envelope $\beta$ values for most sources imply that the dust-to-gas ratio and grain-size distribution delivered to planet-forming disks may be close to pristine ISM, with implications for early planetesimal formation models.
Editorial analysis
A structured set of objections, weighed in public.
Referee Report
Summary. The paper uses ALMA FAUST 1.2 and 3.1 mm continuum observations of 13 Class 0/I protostars to measure the dust opacity spectral index beta in their envelopes. The method models the visibilities with a Plummer envelope plus one or more Gaussian compact components, subtracts the compact component, and derives alpha and beta as functions of uv-distance (physical scale). Envelope beta values are reported for 11 sources (9 new), with most values in the range 0.9-1.7. Combining these with the Galametz et al. (2019) CALYPSO measurements (total n=18), the paper argues that envelope beta values bridge the ISM (beta~1.5-1.9) and disk (beta<1) regimes, and reports a significant correlation between beta and envelope mass (p=0.01) and between the beta gradient and envelope mass (p=0.001).
Significance. If the measurements are robust, this is a valuable contribution: it effectively doubles the number of protostellar envelope beta measurements with a consistent, benchmarked methodology, and it provides an observational anchor for dust evolution models between cloud and disk scales. The paper has concrete strengths: the uv-plane modeling separates compact and extended emission; the results for IRAS4A and L1527 are cross-checked against G19; flux calibration uncertainties are propagated; and a temperature-profile robustness test is attempted. The 'bridge' claim is qualitatively supported by the new FAUST data alone, since the measured beta values (0.9-1.7) lie between typical ISM and disk values. However, the claimed statistical correlation between beta and envelope mass is not yet established because the two pooled samples have incompatible beta distributions, and the internal RCrA-IRS7B inconsistency must be resolved before the pooled statistics can be trusted.
major comments (3)
- [Section 5.4, Figs. 11-12] The headline correlation between beta and envelope mass is computed on the pooled FAUST+G19 sample, yet the paper itself reports a KS test that the two samples' beta distributions are inconsistent (p=0.003). Since CALYPSO selected bright, massive envelopes and FAUST includes fainter, lower-mass envelopes, the pooled correlation could be an artifact of concatenating a high-beta/low-mass cluster with a low-beta/high-mass cluster. Please report the correlation within the FAUST sample alone and within the G19 sample alone, and/or perform a regression that includes a sample indicator or a partial correlation controlling for sample membership. Without such a test, the statement 'we statistically confirm a significant correlation' (abstract and Section 5.4) is not supported.
- [Table 4 and Section 4.4] There is an internal inconsistency for RCrA-IRS7B: Section 4.4 states that the measured spectral index is alpha=3.3±0.1 and, assuming high temperatures along the cavity walls, beta=alpha-2=1.3, while Table 4 lists beta=3.3±0.1 for the same source. The Table 4 entry appears to be alpha, not beta. This is not a purely cosmetic issue: the value feeds into the FAUST mean beta and into the correlation analysis. Please correct Table 4 and recompute the affected mean values and correlation statistics.
- [Section 4, Eq. (4), and Section 4.4] The temperature robustness test described in Section 4 varies the normalization of Eq. (4) by ±10 K and the power-law index within [-0.3,-0.6], but it does not cover the localized high-temperature regions along outflow cavity walls that the authors invoke for IRAS15398-3359, Elias 29, and RCrA-IRS7B. For IRAS15398-3359 the reported alpha~3.6 would give beta=alpha-2=1.6, whereas Table 4 reports beta=1.41±0.09 based on the Eq. (4) temperature correction; the difference (about 0.2) is comparable to the stated uncertainties. Please quantify the systematic shift in beta for these cavity-wall sources using a hotter temperature profile, or state explicitly in Table 4 and Section 4.4 which temperature assumption is used for each source.
minor comments (4)
- [Section 5.2] The text states 'we find five for which no envelope is detected either at 3.1 mm or in both bands', but Section 4.1 identifies only two such sources (GSS30 and IRS63), and Table 4 reports envelope beta values for ten sources plus a lower limit for IRAS4C. Please correct the count.
- [Figure 7 caption] The figure mixes beta values for the ISM and envelopes with alpha values for disks; because beta and alpha differ by approximately 2, the comparison is only meaningful if the temperature correction is explicitly stated. Please clarify in the caption and text which quantity is plotted for each class of object.
- [Section 4.4 heading] The heading 'Dust emission along outflow cavity walls: IRAS15398-3359, IRAS4C, Elias 29, RCrA-IRS7B, L1551-IRS' uses 'L1551-IRS' while the text and Table 4 use 'L1551-IRS5'; please make the source name consistent.
- [Section 5.4] The quoted FAUST mean beta of 1.42±0.06 does not appear to be reproducible from Table 4 values (including or excluding RCrA-IRS7B and IRAS4C). Please specify exactly which sources and weighting are used to compute the reported mean.
Circularity Check
No significant circularity: the envelope β measurements and the β–Menv correlation rest on externally anchored inputs.
full rationale
The paper's central derivation is self-contained against external benchmarks. The envelope dust opacity index β is obtained from measured uv-plane flux ratios (Eq. 3) after subtracting a modeled compact component, and the conversion to β uses the temperature profile of Eq. 4, taken from Adams & Shu (1985) and Motte & André (2001), with a robustness test for the assumed temperature normalization and power-law index. The ISM anchor (Planck Collaboration et al. 2014), disk anchors (Tazzari et al. 2021), and the envelope comparison sample (Galametz et al. 2019) are all external; the overlap checks for IRAS4A and L1527 are consistency tests rather than fitted inputs. Envelope masses in the correlation analysis come from independent literature references in Table 1, and the Pearson tests use those literature masses against the measured β values; no parameter is fitted so as to force the reported p-values. The self-citations, Cacciapuoti et al. (2023) for the pilot L1527 measurement and methodology and Cacciapuoti et al. (2024b) for an outflow-entrainment interpretation, are not load-bearing: the pilot is a prior published measurement, the method is additionally benchmarked by Maury et al. (2018), Galametz et al. (2019), and Tung et al. (2024), and the 2024b scenario is presented as an interpretation of, rather than the source of, the correlation. The known concern that pooling FAUST and CALYPSO samples with different β distributions (KS p=0.003) may affect the correlation is a sample-selection/statistical issue, not a circularity in the derivation. Likewise, the internal inconsistency for RCrA-IRS7B (Table 4 lists β=3.3±0.1 while Section 4.4 gives β=α−2=1.3) is an error, not a circular step. Under the requirement to exhibit a specific reduction of a result to its own inputs, no circular step is identifiable in this paper.
Assumptions & free parameters
free parameters (4)
- Dust temperature normalization T0 =
38 K at 100 au
- Dust temperature power-law index q_T =
-0.4
- Envelope brightness profile index p+q (per source, per band) =
1.72 to 3.18
- Compact component parameters (Gaussian sigma, inclination, PA, flux) =
Varies per source; sigma=0.03 to 0.37 arcsec
assumptions (5)
- domain assumption Envelope emission is optically thin at 1.2-3.1 mm (except IRAS4A with tau up to about 0.3)
- domain assumption Dust temperature profile follows T(R)=38(L/Lsun)^0.2(R/100 au)^-0.4 (Eq. 4)
- domain assumption Envelope brightness is described by a spherical Plummer profile (Eq. 1)
- domain assumption Flux calibration uncertainties of 2.5% (Band 3) and 5% (Band 6) with a systematic error of 0.1 on alpha
- domain assumption Envelope masses Menv from heterogeneous literature (Table 1) are comparable across samples
Cite this review
Pith. "Pith review of FAUST XXVI. The dust opacity spectral indices of protostellar envelopes bridge the gap between interstellar medium and disks." pith.science (2026). https://pith.science/paper/EHHHG4BA
@misc{pith2026250606865,
  author       = {Pith},
  title        = {Pith review of: FAUST XXVI. The dust opacity spectral indices of protostellar envelopes bridge the gap between interstellar medium and disks},
  year         = {2026},
  howpublished = {\url{https://pith.science/paper/EHHHG4BA}},
  note         = {Machine review of arXiv:2506.06865}
}
read the original abstract
The sub-millimetre dust opacity spectral index is a critical observable to constrain dust properties, such as the maximum grain size of an observed dust population. It has been widely measured at galactic scales and down to protoplanetary disks. However, because of observational and analytical challenges, quite a gap exists in measuring dust properties in the envelopes that feed newborn protostars and their disks. To fill this gap, we use sensitive dust continuum emission data at 1.2 and 3.1 mm from the ALMA FAUST Large Program and constrain the dust opacity millimetre spectral index around a sample of protostars. Our high-resolution data, along with a more refined methodology with respect to past efforts, allow us to disentangle disk and envelope contributions in the uv-plane, and thus measure spectral indices for the envelopes uncontaminated by the optically thick emission of the inner regions. First, we find that the young disks are small and optically thick. Secondly, we measure the dust opacity spectral index at envelope scales for n=11 sources: the beta of n=9 sources had never been constrained in the literature. We effectively double the number of sources for which the dust opacity spectral index beta has been measured at these scales. Third, combining the available literature measurements with our own (total n=18), we show how envelope spectral indices distribute between ISM-like and disk-like values, bridging the gap in the inferred dust evolution. Finally, we statistically confirm a significant correlation between beta and the mass of protostellar envelopes, previously suggested in the literature. Our findings indicate that the dust optical properties smoothly vary from the ISM, through envelopes and all the way down to disks. Multi-wavelength surveys are needed to further this study and make more general claims on dust evolution in its pathway from cloud to disks.
Figures


Figures from the paper (7 more)




Reference graph
Works this paper leans on
-
[1]
Adams , F. C. & Shu , F. H. 1985, , 296, 655
1985
-
[2]
E., Sz u cs , L., et al
Agurto-Gangas , C., Pineda , J. E., Sz u cs , L., et al. 2019, , 623, A147
2019
-
[3]
O., Girart , J
Alves , F. O., Girart , J. M., Caselli , P., et al. 2017, , 603, L3
2017
-
[4]
O., Girart , J
Alves , F. O., Girart , J. M., Padovani , M., et al. 2018, , 616, A56
2018
-
[5]
G., Lazarian , A., & Vaillancourt , J
Andersson , B. G., Lazarian , A., & Vaillancourt , J. E. 2015, , 53, 501
2015
-
[6]
2010, , 518, L102
Andr \'e , P., Men'shchikov , A., Bontemps , S., et al. 2010, , 518, L102
2010
-
[7]
Bate , M. R. 2022, , 514, 2145
2022
-
[8]
Mixing is easy: New insights for cosmochemical evolution from pre-stellar core collapse
Bhandare , A., Commer c on , B., Laibe , G., et al. 2024, arXiv e-prints, arXiv:2404.09257
work page Pith review arXiv 2024
Show all 126 references
-
[9]
2024, , 62, 157
Birnstiel , T. 2024, , 62, 157
2024
-
[10]
1996, , 311, 858
Bontemps , S., Andre , P., Terebey , S., & Cabrit , S. 1996, , 311, 858
1996
-
[11]
Boogert , A. C. A., Hogerheijde , M. R., Ceccarelli , C., et al. 2002, , 570, 708
2002
-
[12]
2017, , 604, A52
Bracco , A., Palmeirim , P., Andr \'e , P., et al. 2017, , 604, A52
2017
-
[13]
S., Wong , T
Bussmann , R. S., Wong , T. W., Hedden , A. S., Kulesa , C. A., & Walker , C. K. 2007, , 657, L33
2007
-
[14]
2024 a , , 682, A61
Cacciapuoti , L., Macias , E., Gupta , A., et al. 2024 a , , 682, A61
2024
-
[15]
J., et al
Cacciapuoti , L., Macias , E., Maury , A. J., et al. 2023, , 676, A4
2023
-
[16]
2024 b , , 961, 90
Cacciapuoti , L., Testi , L., Podio , L., et al. 2024 b , , 961, 90
2024
-
[17]
2019, , 883, 71
Carrasco-Gonz \'a lez , C., Sierra , A., Flock , M., et al. 2019, , 883, 71
2019
-
[18]
2022, , 134, 114501
CASA Team , Bean , B., Bhatnagar , S., et al. 2022, , 134, 114501
2022
-
[19]
2022, arXiv e-prints, arXiv:2206.13270
Ceccarelli , C., Codella , C., Balucani , N., et al. 2022, arXiv e-prints, arXiv:2206.13270
2022 arXiv
-
[20]
2024, , 531, 2653
Chahine , L., Ceccarelli , C., De Simone , M., et al. 2024, , 531, 2653
2024
-
[21]
C., Ladd , E
Chen , H., Myers , P. C., Ladd , E. F., & Wood , D. O. S. 1995, , 445, 377
1995
-
[22]
M., Gurwell , M
Chung , C.-Y., Andrews , S. M., Gurwell , M. A., et al. 2024, , 273, 29
2024
-
[23]
2021, Frontiers in Astronomy and Space Sciences, 8, 227
Codella , C., Ceccarelli , C., Chandler , C., et al. 2021, Frontiers in Astronomy and Space Sciences, 8, 227
2021
-
[24]
2022, , 515, 543
Codella , C., L \'o pez-Sepulcre , A., Ohashi , S., et al. 2022, , 515, 543
2022
-
[25]
2024 a , , 528, 7383
Codella , C., Podio , L., De Simone , M., et al. 2024 a , , 528, 7383
2024
-
[26]
2024 b , , 528, 7383
Codella , C., Podio , L., De Simone , M., et al. 2024 b , , 528, 7383
2024
-
[27]
2021, CARTA: The Cube Analysis and Rendering Tool for Astronomy
Comrie , A., Wang , K.-S., Hsu , S.-C., et al. 2021, CARTA: The Cube Analysis and Rendering Tool for Astronomy
2021
-
[28]
J., Rosotti , G
Cridland , A. J., Rosotti , G. P., Tabone , B., et al. 2022, , 662, A90
2022
-
[29]
B., & Takami , M
Cruz-S \'a enz de Miera , F., K \'o sp \'a l , \'A ., \'A brah \'a m , P., Liu , H. B., & Takami , M. 2019, , 882, L4
2019
-
[30]
A., Caselli , P., et al
Dartois , E., Noble , J. A., Caselli , P., et al. 2024, Nature Astronomy, 8, 359
2024
-
[31]
2020, , 896, L3
De Simone , M., Ceccarelli , C., Codella , C., et al. 2020, , 896, L3
2020
-
[32]
2024, arXiv e-prints, arXiv:2405.14501
Delussu , L., Birnstiel , T., Miotello , A., et al. 2024, arXiv e-prints, arXiv:2405.14501
2024 arXiv
-
[33]
Draine , B. T. 2011, Physics of the Interstellar and Intergalactic Medium
2011
-
[34]
2023, arXiv e-prints, arXiv:2309.07040
Duchene , G., Menard , F., Stapelfeldt , K., et al. 2023, arXiv e-prints, arXiv:2309.07040
2023 arXiv
-
[35]
2023, , 678, A160
Evans , L., Vastel , C., Fontani , F., et al. 2023, , 678, A160
2023
-
[36]
W., Lang , D., & Goodman , J
Foreman-Mackey , D., Hogg , D. W., Lang , D., & Goodman , J. 2013, , 125, 306
2013
-
[37]
2025, arXiv e-prints, arXiv:2501.19188
Frediani , J., De Simone , M., Testi , L., et al. 2025, arXiv e-prints, arXiv:2501.19188
2025 arXiv
-
[38]
2005, , 156, 169
Froebrich , D. 2005, , 156, 169
2005
-
[39]
J., Valdivia , V., et al
Galametz , M., Maury , A. J., Valdivia , V., et al. 2019, , 632, A5
2019
-
[40]
2025, , 694, A290
Garufi , A., Carrasco-Gonz \'a lez , C., Mac \' as , E., et al. 2025, , 694, A290
2025
-
[41]
M., van der Marel , N., Di Francesco , J., et al
Guerra-Alvarado , O. M., van der Marel , N., Di Francesco , J., et al. 2024, , 681, A82
2024
-
[42]
2020, , 643, A17
Guillet , V., Hennebelle , P., Pineau des For \^e ts , G., et al. 2020, , 643, A17
2020
-
[43]
Hall , J. S. 1949, Science, 109, 166
1949
-
[44]
& Ciardi , A
Hennebelle , P. & Ciardi , A. 2009, , 506, L29
2009
-
[45]
2022 a , , 934, 70
Imai , M., Oya , Y., Svoboda , B., et al. 2022 a , , 934, 70
2022
-
[46]
2022 b , , 934, 70
Imai , M., Oya , Y., Svoboda , B., et al. 2022 b , , 934, 70
2022
-
[47]
D., Moriarty-Schieven , G., et al
Johnstone , D., Wilson , C. D., Moriarty-Schieven , G., et al. 2000, , 545, 327
2000
-
[48]
K., Sch \"o ier , F
J rgensen , J. K., Sch \"o ier , F. L., & van Dishoeck , E. F. 2002, , 389, 908
2002
-
[49]
K., van Dishoeck , E
J rgensen , J. K., van Dishoeck , E. F., Visser , R., et al. 2009, , 507, 861
2009
-
[50]
K., Visser , R., Sakai , N., et al
J rgensen , J. K., Visser , R., Sakai , N., et al. 2013, , 779, L22
2013
-
[51]
2015, , 584, A94
Juvela , M., Demyk , K., Doi , Y., et al. 2015, , 584, A94
2015
-
[52]
B., Lai , S.-P., et al
Ko , C.-L., Liu , H. B., Lai , S.-P., et al. 2020, , 889, 172
2020
-
[53]
W., Mundy , L
Kwon , W., Looney , L. W., Mundy , L. G., Chiang , H.-F., & Kemball , A. J. 2009, , 696, 841
2009
-
[54]
M., Schmiedeke , A., et al
Launhardt , R., Stutz , A. M., Schmiedeke , A., et al. 2013, , 551, A98
2013
-
[55]
& Hoang , T
Lazarian , A. & Hoang , T. 2007, , 669, L77
2007
-
[56]
M., Commer c on , B., & Ebel , D
Lebreuilly , U., Mac Low , M. M., Commer c on , B., & Ebel , D. S. 2023, , 675, A38
2023
-
[57]
Lee , S., Lee , J.-E., & Bergin , E. A. 2015, , 217, 30
2015
-
[58]
I.-H., Liu , H
Li , J. I.-H., Liu , H. B., Hasegawa , Y., & Hirano , N. 2017, , 840, 72
2017
-
[59]
D., Li , Z.-Y., Stephens , I
Lin , Z.-Y. D., Li , Z.-Y., Stephens , I. W., et al. 2024, , 528, 843
2024
-
[60]
Liu , H. B. 2019, , 877, L22
2019
-
[61]
2021, , 648, A33
Mac \' as , E., Guerra-Alvarado , O., Carrasco-Gonz \'a lez , C., et al. 2021, , 648, A33
2021
-
[62]
F., Morbidelli , A., & Guillot , T
Manara , C. F., Morbidelli , A., & Guillot , T. 2018, , 618, L3
2018
-
[63]
S., Rumpl , W., & Nordsieck , K
Mathis , J. S., Rumpl , W., & Nordsieck , K. H. 1977, , 217, 425
1977
-
[64]
J., Pineda , J
Maureira , M. J., Pineda , J. E., Liu , H. B., et al. 2024, , 689, L5
2024
-
[65]
Maury , A., Hennebelle , P., & Girart , J. M. 2022, Frontiers in Astronomy and Space Sciences, 9, 949223
2022
-
[66]
J., Andr \'e , P., Testi , L., et al
Maury , A. J., Andr \'e , P., Testi , L., et al. 2019, , 621, A76
2019
-
[67]
J., Girart , J
Maury , A. J., Girart , J. M., Zhang , Q., et al. 2018, , 477, 2760
2018
-
[68]
K., Rocha , W
McClure , M. K., Rocha , W. R. M., Pontoppidan , K. M., et al. 2023, Nature Astronomy, 7, 431
2023
-
[69]
2023, , 522, 2384
Mercimek , S., Podio , L., Codella , C., et al. 2023, , 522, 2384
2023
-
[70]
2014, , 567, A32
Miotello , A., Testi , L., Lodato , G., et al. 2014, , 567, A32
2014
-
[71]
& Andr \'e , P
Motte , F. & Andr \'e , P. 2001, , 365, 440
2001
-
[72]
C., van Dishoeck , E
Mottram , J. C., van Dishoeck , E. F., Kristensen , L. E., et al. 2017, , 600, A99
2017
-
[73]
C., Adams , F
Myers , P. C., Adams , F. C., Chen , H., & Schaff , E. 1998, , 492, 703
1998
-
[74]
2007, in Protostars and Planets V, ed
Natta , A., Testi , L., Calvet , N., et al. 2007, in Protostars and Planets V, ed. B. Reipurth , D. Jewitt , & K. Keil , 767
2007
-
[75]
J., J rgensen , J
Ohashi , N., Tobin , J. J., J rgensen , J. K., et al. 2023, , 951, 8
2023
-
[76]
2022, , 927, 54
Ohashi , S., Codella , C., Sakai , N., et al. 2022, , 927, 54
2022
-
[77]
2021, , 910, 11
Okoda , Y., Oya , Y., Francis , L., et al. 2021, , 910, 11
2021
-
[78]
2018, , 864, L25
Okoda , Y., Oya , Y., Sakai , N., et al. 2018, , 864, L25
2018
-
[79]
W., Paszun , D., Dominik , C., & Tielens , A
Ormel , C. W., Paszun , D., Dominik , C., & Tielens , A. G. G. M. 2009, , 502, 845
2009
-
[80]
2025, , 980, 263
Oya , Y., Saiga , E., Miotello , A., et al. 2025, , 980, 263
2025
-
[81]
2018, , 863, 72
Oya , Y., Sakai , N., Watanabe , Y., et al. 2018, , 863, 72
2018
-
[82]
2010, Science, 329, 1622
Pagani , L., Steinacker , J., Bacmann , A., Stutz , A., & Henning , T. 2010, Science, 329, 1622
2010
-
[83]
D., et al
Perotti , G., Cacciapuoti , L., Tung , N. D., et al. 2024, arXiv e-prints, arXiv:2407.03520
2024 arXiv
-
[84]
Planck Collaboration , Ade , P. A. R., Aghanim , N., et al. 2014, , 564, A45
2014
-
[85]
Plummer , H. C. 1911, , 71, 460
1911
-
[86]
2024, , 688, L22
Podio , L., Ceccarelli , C., Codella , C., et al. 2024, , 688, L22
2024
-
[87]
2020, , 640, A118
Reissl , S., Guillet , V., Brauer , R., et al. 2020, , 640, A118
2020
-
[88]
Reissl , S., Meehan , P., & Klessen , R. S. 2023, , 674, A47
2023
-
[89]
Ricci , L., Testi , L., Natta , A., & Brooks , K. J. 2010, , 521, A66
2010
-
[90]
2012, , 540, A6
Ricci , L., Trotta , F., Testi , L., et al. 2012, , 540, A6
2012
-
[91]
G., Polychroni , D., et al
Roy , A., Martin , P. G., Polychroni , D., et al. 2013, , 763, 55
2013
-
[92]
J., et al
Sabatini , G., Bianchi , E., Chandler , C. J., et al. 2025, arXiv e-prints, arXiv:2505.13596
2025 arXiv
-
[93]
2024, , 684, L12
Sabatini , G., Podio , L., Codella , C., et al. 2024, , 684, L12
2024
-
[94]
I., Di Francesco , J., Andr \'e , P., et al
Sadavoy , S. I., Di Francesco , J., Andr \'e , P., et al. 2014, , 787, L18
2014
-
[95]
I., Stephens , I
Sadavoy , S. I., Stephens , I. W., Myers , P. C., et al. 2019, , 245, 2
2019
-
[96]
2024, arXiv e-prints, arXiv:2407.20885
Santamaria-Miranda , A., de Gregorio-Monsalvo , I., Ohashi , N., et al. 2024, arXiv e-prints, arXiv:2407.20885
2024 arXiv
-
[97]
E., Booth , R
Scardoni , C. E., Booth , R. A., Clarke , C. J., Rosotti , G. P., & Ribas , \'A . 2024, , 970, 109
2024
-
[98]
Schwartz , P. R. 1982, , 252, 589
1982
-
[99]
M., Harris , R
Segura-Cox , D. M., Harris , R. J., Tobin , J. J., et al. 2016, , 817, L14
2016
-
[100]
M., Schmiedeke , A., Pineda , J
Segura-Cox , D. M., Schmiedeke , A., Pineda , J. E., et al. 2020 a , , 586, 228
2020
-
[101]
M., Schmiedeke , A., Pineda , J
Segura-Cox , D. M., Schmiedeke , A., Pineda , J. E., et al. 2020 b , , 586, 228
2020
-
[102]
Sheehan , P. D. & Eisner , J. A. 2018, , 857, 18
2018
-
[103]
L., Evans , Neal J., I., & Rawlings , J
Shirley , Y. L., Evans , Neal J., I., & Rawlings , J. M. C. 2002, , 575, 337
2002
-
[104]
& Lizano , S
Sierra , A. & Lizano , S. 2020, , 892, 136
2020
-
[105]
F., et al
Steinacker , J., Andersen , M., Thi , W. F., et al. 2015, , 582, A70
2015
-
[106]
2010, , 511, A9
Steinacker , J., Pagani , L., Bacmann , A., & Guieu , S. 2010, , 511, A9
2010
-
[107]
2024, , 964, 24
Takakuwa , S., Saigo , K., Kido , M., et al. 2024, , 964, 24
2024
-
[108]
2018, , 476, 4527
Tazzari , M., Beaujean , F., & Testi , L. 2018, , 476, 4527
2018
-
[109]
J., Testi , L., et al
Tazzari , M., Clarke , C. J., Testi , L., et al. 2021, , 506, 2804
2021
-
[110]
2014, in Protostars and Planets VI, ed
Testi , L., Birnstiel , T., Ricci , L., et al. 2014, in Protostars and Planets VI, ed. H. Beuther , R. S. Klessen , C. P. Dullemond , & T. Henning , 339
2014
-
[111]
Tielens , A. G. G. M. 2010, The Physics and Chemistry of the Interstellar Medium
2010
-
[112]
Tobin , J. J. & Sheehan , P. D. 2024, , 62, 203
2024
-
[113]
N., & Inutsuka , S.-i
Tsukamoto , Y., Machida , M. N., & Inutsuka , S.-i. 2021, , 920, L35
2021
-
[114]
2024, , 684, A36
Tung , N.-D., Testi , L., Lebreuilly , U., et al. 2024, , 684, A36
2024
-
[115]
F., Rosotti , G
Tychoniec , ., Manara , C. F., Rosotti , G. P., et al. 2020, , 640, A19
2020
-
[116]
2019, , 488, 4897
Valdivia , V., Maury , A., Brauer , R., et al. 2019, , 488, 4897
2019
-
[117]
P., Bastien , P., & Greaves , J
Vall \'e e , J. P., Bastien , P., & Greaves , J. S. 2000, , 542, 352
2000
-
[118]
2024, arXiv e-prints, arXiv:2406.00124
Vallucci-Goy , V., Lebreuilly , U., & Hennebelle , P. 2024, arXiv e-prints, arXiv:2406.00124
2024 arXiv
-
[119]
A., van Dishoeck , E
van Kempen , T. A., van Dishoeck , E. F., Hogerheijde , M. R., & G \"u sten , R. 2009, , 508, 259
2009
-
[120]
E., Bruderer , S., et al
Visser , R., Kristensen , L. E., Bruderer , S., et al. 2012, , 537, A55
2012
-
[121]
A., Kristensen , L
Y ld z , U. A., Kristensen , L. E., van Dishoeck , E. F., et al. 2012, , 542, A86
2012
-
[122]
Youdin , A. N. & Goodman , J. 2005, , 620, 459
2005
-
[123]
P., & Verstraete , L
Ysard , N., Koehler , M., Jimenez-Serra , I., Jones , A. P., & Verstraete , L. 2019, , 631, A88
2019
-
[124]
2023, , 953, 96
Zhang , S., Zhu , Z., Ueda , T., et al. 2023, , 953, 96
2023
-
[125]
E., Sakai , N., et al
Zhang , Y., Higuchi , A. E., Sakai , N., et al. 2018, , 864, 76
2018
-
[126]
2016, , 460, 2050
Zhao , B., Caselli , P., Li , Z.-Y., et al. 2016, , 460, 2050
2016
Reviewed August 7, 2026 · model on record in the stance chip above.
Discussion (0). Continue with ORCID to comment.