REVIEW 3 major objections 4 minor 92 references
The completeness of the open cluster census towards the Galactic anticentre
T0 review · 3 major / 4 minor · reviewed 2026-08-15 · deepseek-v4-flash
Pith's one-line read After correcting for selection effects, old open clusters are $2.97\pm0.11$ times more common at a Galactocentric radius of 13 kpc than in the solar neighbourhood, and this excess is physical rather than a bias of the census.
desk verdict Impressive injection-recovery selection function; the old-cluster excess is likely real, but the headline 2.97 ratio carries unquantified systematics from using true parameters for completeness and measured ones for real clusters. read the letter →
The pith
A machine-rendered reading of the paper's core claim, the machinery that carries it, and where it could break.
The reading
What carries the argument
The load-bearing object is an empirical selection function built by injecting realistic mock open clusters into Gaia DR3 and attempting to recover them with the same HDBSCAN blind search used to construct the catalogue. A gradient-boosted classifier converts the injection-recovery outcomes into a detection probability $f_{\rm detected}$ as a function of longitude, latitude, distance, mass, age, and proper motion; cluster core and tidal radii are dropped after showing negligible effect. This function is then used to correct the observed cluster counts in mass, distance, and age bins, and to forward-model what a kinematically 'warm' versus 'hot' outer-disc cluster population would look like.
What would settle it
Run a deeper, independent blind cluster search in the anticentre and count young ($\log t<8.5$) clusters of mass 250 to 2000 $M_\odot$ at $R_{\rm GC}\approx13$ kpc: if the completeness-corrected young fraction comes out well above $27.5\%\pm5.7\%$, the claimed $2.97\pm0.11$ excess of old clusters is wrong.
Extended reading notes
Core claim
The central claim is that the observed excess of old open clusters in the Galactic anticentre is a real property of the Milky Way, not a selection artefact. Using 147,639 recovered mock clusters out of 192,318 injected, the paper builds a completeness model and finds that the fraction of clusters younger than $\log t = 8.5$ drops from $81.7\%\pm9.2\%$ in the solar neighbourhood to $27.5\%\pm5.7\%$ at $R_{\rm GC}=13$ kpc, equivalent to old clusters being $2.97\pm0.11$ times more common there. The paper further argues that this deficit of young outer-disc clusters is best interpreted as a limit on the mass of clusters that can form in the outer Galaxy, that many low-mass old clusters remain undiscovered, and that the two most distant known clusters, Berkeley 29 and Saurer 1, are likely the high-latitude tip of that hidden population.
Load-bearing premise
The result rests on the assumption that the simulated cluster population and the catalogue's mass and age estimates reproduce the true outer-disc population, so that the correction bins are not systematically mis-scaled.
Editorial extensions
If this is right
- Completeness-corrected counts place the young-cluster fraction at $27.5\%\pm5.7\%$ at $R_{\rm GC}=13$ kpc, versus $81.7\%\pm9.2\%$ near the Sun, so old clusters are $2.97\pm0.11$ times more common in the outer disc.
- The outer Galaxy is not forming young clusters massive enough to be identified in Gaia DR3, so $R_{\rm GC}\sim13$ kpc is likely a limit for massive cluster formation rather than for star formation itself.
- The old-cluster census in the anticentre is probably very incomplete, with many low-mass or low-latitude old clusters still undiscovered; Berkeley 29 and Saurer 1 are likely the visible high-latitude part of that population.
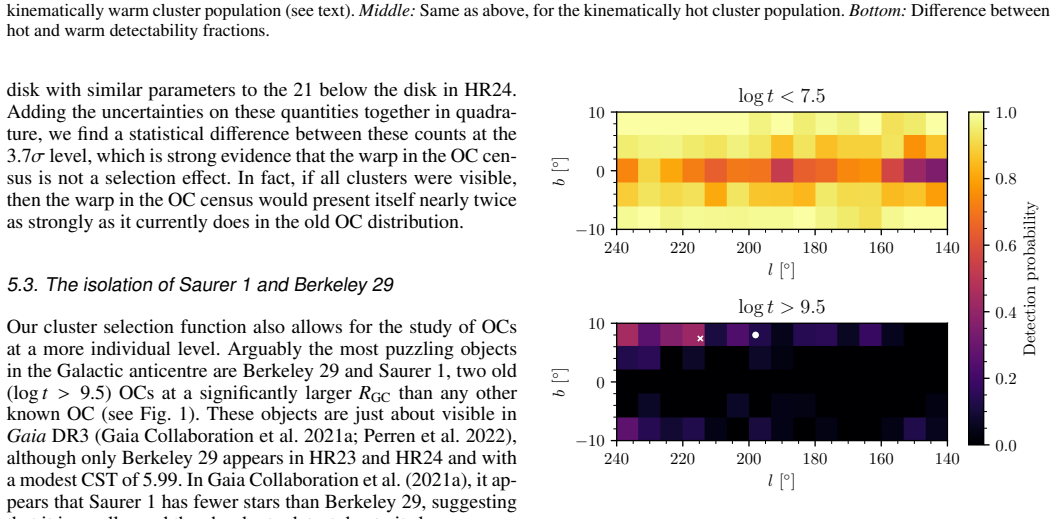
- The observed asymmetry of the cluster warp, with more old clusters below the disc than above it, survives selection correction at the $3.7\sigma$ level and would appear roughly twice as strong in a complete census.
Reading between the lines
- Inference: applying the same injection-recovery machinery to the whole sky would separate algorithm-specific detection biases from physical gradients, allowing a direct test of whether the $2.97$ ratio persists beyond the anticentre.
- Inference: the migration explanation carries a testable chemical signature: old clusters in the outer disc should show inner-disc metallicities and abundance patterns if they migrated outward, whereas a lower destruction rate predicts a shallower age gradient in the anticentre.
- Inference: the selection function predicts specific dust-obscured low-latitude zones between $R_{\rm GC}=14$ and $19$ kpc where dozens of hidden low-mass old clusters should reside, a prediction that deeper astrometric or co-added ground-based surveys could check directly.
Signed reviews
Editorial analysis
A structured set of objections, weighed in public.
Referee Report
Summary. The paper constructs an empirical selection function for the open cluster census in the Galactic anticentre (140° ≤ ℓ ≤ 240°, |b| ≤ 10°, d ≥ 2 kpc), based on the HR23/HR24 HDBSCAN cluster search in Gaia DR3. The authors generate 194,752 realistic mock clusters spanning broad ranges in mass, age, distance, position, proper motion, and internal structure; inject them into Gaia DR3 data; and attempt blind recovery with the same HDBSCAN pipeline used for HR23. A gradient-boosting (XGBoost) model is trained on the resulting 147,639 recovered clusters to predict detection probability as a function of cluster parameters, yielding a smooth selection function. The main detectability drivers are found to be mass, extinction, distance, and age, with secondary effects from proper motion. Applying this selection function to HR24 clusters through a forward-modelled 'warm' kinematic correction, the paper reports that old clusters (log t > 8.5) are 2.97 ± 0.11 times more common at Galactocentric radius 13 kpc than in the solar neighbourhood, and interprets this as a physical property of the Milky Way rather than an observational bias. Additional applications address the Galactic warp in the old cluster population and the detectability of the distant clusters Berkeley 29 and Saurer 1.
Significance. If the central claim holds, the paper provides a strong, quantitative demonstration that the old-to-young open cluster ratio increases toward the outer Milky Way, with consequences for cluster formation thresholds, radial migration, and cluster destruction rates. The methodological contribution — an empirical, injection-based selection function for a full Gaia cluster catalogue — is important and likely to be reused for other surveys and regions. The paper has notable strengths: the injection-recovery experiment is large and closely replicates the original detection pipeline; the selection function is derived independently of the observed catalogue, so the central conclusion is not circular; and the CST predictor is validated against real clusters with an RMSE of 3.75, comparable to its simulated validation RMSE of 3.17. The principal weakness is that the size and direction of systematic errors in the headline 2.97 ratio, particularly those arising from the use of measured (rather than true) cluster parameters in the correction, are not quantified.
major comments (3)
- [§5.1, Fig. 8; §4.2]
- [§5.1]
- [§4.3]
minor comments (4)
- [Abstract and §5.1] The abstract states the 2.97 ± 0.11 ratio without noting that the analysis in Fig. 8 is restricted to clusters with masses between 250 and 2000 M☉ and to the adopted anticentre region and binning; please state this restriction in the abstract or results summary.
- [Fig. 7 caption] The caption says 'clusters in HR23 are shown by the blue points', while the text in §4.3 refers to HR24 clusters; please check which catalogue is plotted and make the caption consistent.
- [§5.2] When the below-disk cluster population is flipped in Z to estimate detection probabilities above the disk, the text should clarify how extinction and line-of-sight quantities are handled, since the selection function depends on l, b, d and therefore implicitly on the dust column at the new position.
- [§3.1.2] The assumption of virial equilibrium (η = 10) is stated to have negligible impact at the distances considered, but the text could note the expected maximum effect on the internal velocity dispersion for the nearest simulated clusters, to make this assertion easier to verify.
Circularity Check
No material circularity: the selection function is measured by an injection-recovery experiment, and the corrected 2.97 ratio is not an input to the fit.
full rationale
The derivation chain is not circular. The selection function is measured rather than assumed: mock clusters with known input parameters are injected into Gaia DR3 and recovered with the same HDBSCAN+CST pipeline used to build HR24 (Sects. 3.2 and 4.2), and the resulting XGBoost f_detected model is validated against real HR24 clusters in Sect. 4.3, with a CST RMSE of 3.75 on real clusters versus 3.17 on simulated validation data. The headline ratio of 2.97 is obtained by binning observed HR24 clusters by mass, distance, and age and scaling each bin by the measured inverse detection probability (Sect. 5.1); no equation defines the ratio as an input to the correction, and the warm and hot kinematic models are used only to evaluate how detectability would vary under alternative assumptions, not to impose the result. The Sect. 6 caveat that the correction is limited by the quality of cluster parameters is a legitimate calibration concern, not a circular step: a mismatch between measured and true masses or ages could bias the correction, but this is explicitly acknowledged and does not reduce the 2.97 claim to an assumed input. Self-citations to HR23, HR24, and Cavallo et al. (2024) are the catalogue under study and independent published products, and the paper's conclusion is not forced by a self-citation chain.
Assumptions & free parameters
free parameters (6)
- Fixed mock metallicity [M/H] =
-0.2 dex
- Virial equilibrium assumption eta =
10
- Uniform sampling ranges for mock cluster parameters =
l 140-240 deg, b -10 to +10 deg, d 2-15 kpc, M 50-5000 Msun, logt 6.4-10.0, rc 1-5 pc
- Warm model scale-height growth index =
1.3 (h_z ~ t^1.3)
- Warm model age-velocity relation =
Tarricq et al. (2021) relation
- XGBoost hyperparameters =
200 estimators, max depth 7, learning rate 0.2
assumptions (7)
- domain assumption HR23/HR24 catalogue classifications and parameters are correct enough for binning and comparison.
- domain assumption The Gaia selection function and HR23 quality-cut subsample selection function are accurately modelled.
- domain assumption Stellar population models (Kroupa IMF, PARSEC isochrones, Moe and Di Stefano binary fractions) describe cluster members.
- domain assumption Green et al. (2019) dust map gives correct extinction at the cluster distances.
- domain assumption MWPotential2014 and the Jacobi radius formula give correct cluster tidal radii.
- domain assumption HDBSCAN recovery with quality cuts reproduces the HR23 blind search.
- domain assumption Cavallo et al. (2024) ages and extinctions are accurate for old clusters.
Cite this review
Pith. "Pith review of The completeness of the open cluster census towards the Galactic anticentre." pith.science (2026). https://pith.science/paper/MTZIX4CH
@misc{pith2026250618708,
  author       = {Pith},
  title        = {Pith review of: The completeness of the open cluster census towards the Galactic anticentre},
  year         = {2026},
  howpublished = {\url{https://pith.science/paper/MTZIX4CH}},
  note         = {Machine review of arXiv:2506.18708}
}
abstract
Open clusters have long been used as tracers of Galactic structure. However, without a selection function to describe the completeness of the cluster census, it is difficult to quantitatively interpret their distribution. We create a method to empirically determine the selection function of a Galactic cluster catalogue. We test it by investigating the completeness of the cluster census in the outer Milky Way, where old and young clusters exhibit different spatial distributions. We develop a method to generate realistic mock clusters as a function of their parameters, in addition to accounting for Gaia's selection function and astrometric errors. We then inject mock clusters into Gaia DR3 data, and attempt to recover them in a blind search using HDBSCAN. We find that the main parameters influencing cluster detectability are mass, extinction, and distance. Age also plays an important role, making older clusters harder to detect due to their fainter luminosity function. High proper motions also improve detectability. After correcting for these selection effects, we find that old clusters are $2.97\pm0.11$ times more common at a Galactocentric radius of 13~kpc than in the solar neighbourhood -- despite positive detection biases in their favour, such as hotter orbits or a higher scale height. The larger fraction of older clusters in the outer Galaxy cannot be explained by an observational bias, and must be a physical property of the Milky Way: young outer-disc clusters are not forming in the outer Galaxy, or at least not with sufficient masses to be identified as clusters in Gaia DR3. We predict that in this region, more old clusters than young ones remain to be discovered. The current presence of old, massive outer-disc clusters could be explained by radial heating and migration, or alternatively by a lower cluster destruction rate in the anticentre.
Figures


Figures from the paper (6 more)


Reference graph
Works this paper leans on
-
[1]
S., Moitinho, A., & Dias, W
Alessi, B. S., Moitinho, A., & Dias, W. S. 2003, A&A, 410, 565
2003
-
[2]
Almeida, A., Monteiro, H., & Dias, W. S. 2023, Monthly Notices of the Royal Astronomical Society, 525, 2315
2023
-
[3]
2025, Astronomy and Astrophysics, 693, A305
Almeida, D., Moitinho, A., & Moreira, S. 2025, Astronomy and Astrophysics, 693, A305
2025
-
[4]
2021, A&A, 645, L2 Astropy Collaboration, Price-Whelan, A
Anders, F., Cantat-Gaudin, T., Quadrino-Lodoso, I., et al. 2021, A&A, 645, L2 Astropy Collaboration, Price-Whelan, A. M., Lim, P. L., et al. 2022, ApJ, 935, 167 Astropy Collaboration, Price-Whelan, A. M., Sip˝ocz, B. M., et al. 2018, AJ, 156, 123 Astropy Collaboration, Robitaille, T. P., Tollerud, E. J., et al. 2013, A&A, 558, A33
2021
-
[5]
2011, Computing in Science Engineer- ing, 13, 31
Behnel, S., Bradshaw, R., Citro, C., et al. 2011, Computing in Science Engineer- ing, 13, 31
2011
-
[6]
2012, MNRAS, 427, 127
Bressan, A., Marigo, P., Girardi, L., et al. 2012, MNRAS, 427, 127
2012
-
[7]
Brown, A. G. A. 2021, ARA&A, 59, 59
2021
-
[8]
2013, in ECML PKDD Workshop: Languages for Data Mining and Machine Learning, 108–122
Buitinck, L., Louppe, G., Blondel, M., et al. 2013, in ECML PKDD Workshop: Languages for Data Mining and Machine Learning, 108–122
2013
Show all 92 references
-
[9]
Campello, R. J. G. B., Moulavi, D., & Sander, J. 2013, in Advances in Knowl- edge Discovery and Data Mining, ed. J. Pei, V . S. Tseng, L. Cao, H. Motoda, & G. Xu (Berlin, Heidelberg: Springer Berlin Heidelberg), 160–172
2013
-
[10]
2022, Universe, 8, 111
Cantat-Gaudin, T. 2022, Universe, 8, 111
2022
-
[11]
& Anders, F
Cantat-Gaudin, T. & Anders, F. 2020, Astronomy & Astrophysics, 633, A99
2020
-
[12]
2020, A&A, 640, A1
Cantat-Gaudin, T., Anders, F., Castro-Ginard, A., et al. 2020, A&A, 640, A1
2020
-
[13]
2016, A&A, 588, A120
Cantat-Gaudin, T., Donati, P., Vallenari, A., et al. 2016, A&A, 588, A120
2016
-
[14]
2023, A&A, 669, A55
Cantat-Gaudin, T., Fouesneau, M., Rix, H.-W., et al. 2023, A&A, 669, A55
2023
-
[15]
2018, A&A, 618, A93
Cantat-Gaudin, T., Jordi, C., Vallenari, A., et al. 2018, A&A, 618, A93
2018
-
[16]
2019, A&A, 624, A126
Cantat-Gaudin, T., Krone-Martins, A., Sedaghat, N., et al. 2019, A&A, 624, A126
2019
-
[17]
2024, A&A, 687, A239
Carbajo-Hijarrubia, J., Casamiquela, L., Carrera, R., et al. 2024, A&A, 687, A239
2024
-
[18]
M., & Majewski, S
Carraro, G., Geisler, D., Villanova, S., Frinchaboy, P. M., & Majewski, S. R. 2007, A&A, 476, 217
2007
-
[19]
Castro-Ginard, A., Brown, A. G. A., Kostrzewa-Rutkowska, Z., et al. 2023, A&A, 677, A37
2023
-
[20]
2020, A&A, 635, A45
Castro-Ginard, A., Jordi, C., Luri, X., et al. 2020, A&A, 635, A45
2020
-
[21]
2018, A&A, 618, A59
Castro-Ginard, A., Jordi, C., Luri, X., et al. 2018, A&A, 618, A59
2018
-
[22]
2024, AJ, 167, 12
Cavallo, L., Spina, L., Carraro, G., et al. 2024, AJ, 167, 12
2024
-
[23]
& Guestrin, C
Chen, T. & Guestrin, C. 2016, in Proceedings of the 22nd ACM SIGKDD In- ternational Conference on Knowledge Discovery and Data Mining, KDD ’16 (New York, NY , USA: ACM), 785–794
2016
-
[24]
2019, Nature Astronomy, 3, 320
Chen, X., Wang, S., Deng, L., et al. 2019, Nature Astronomy, 3, 320
2019
-
[25]
2015, MNRAS, 452, 1068
Chen, Y ., Bressan, A., Girardi, L., et al. 2015, MNRAS, 452, 1068
2015
-
[26]
2014, MNRAS, 444, 2525
Chen, Y ., Girardi, L., Bressan, A., et al. 2014, MNRAS, 444, 2525
2014
-
[27]
Chen, Y . Q. & Zhao, G. 2020, MNRAS, 495, 2673
2020
-
[28]
S., Alessi, B
Dias, W. S., Alessi, B. S., Moitinho, A., & Lépine, J. R. D. 2002, A&A, 389, 871
2002
-
[29]
M., Cunha, K., et al
Donor, J., Frinchaboy, P. M., Cunha, K., et al. 2020, AJ, 159, 199
2020
-
[30]
2021, A&A, 649, A5
Fabricius, C., Luri, X., Arenou, F., et al. 2021, A&A, 649, A5
2021
-
[31]
W., Menzies, J
Feast, M. W., Menzies, J. W., Matsunaga, N., & Whitelock, P. A. 2014, Nature, 509, 342
2014
-
[32]
Froebrich, D., Scholz, A., & Raftery, C. L. 2007, MNRAS, 374, 399 Gaia Collaboration, Antoja, T., McMillan, P. J., et al. 2021a, A&A, 649, A8 Gaia Collaboration, Brown, A. G. A., Vallenari, A., et al. 2018, A&A, 616, A1 Gaia Collaboration, Brown, A. G. A., Vallenari, A., et al...
2007
-
[33]
M., Brasseur, C
Ginsburg, A., Sip˝ocz, B. M., Brasseur, C. E., et al. 2019, AJ, 157, 98
2019
-
[34]
E., et al
Ginsburg, A., Sip˝ocz, B., Brasseur, C. E., et al. 2024, astropy/astroquery: v0.4.7
2024
-
[35]
2024, scipy/scipy: SciPy 1.13.0 Górski, K
Gommers, R., Virtanen, P., Haberland, M., et al. 2024, scipy/scipy: SciPy 1.13.0 Górski, K. M., Hivon, E., Banday, A. J., et al. 2005, ApJ, 622, 759
2024
-
[36]
M., Schlafly, E., Zucker, C., Speagle, J
Green, G. M., Schlafly, E., Zucker, C., Speagle, J. S., & Finkbeiner, D. 2019, ApJ, 887, 93
2019
-
[37]
2024, scikit-learn/scikit-learn: Scikit-learn 1.4.2
Grisel, O., Mueller, A., Lars, et al. 2024, scikit-learn/scikit-learn: Scikit-learn 1.4.2
2024
-
[38]
R., Millman, K
Harris, C. R., Millman, K. J., van der Walt, S. J., et al. 2020, Nature, 585, 357
2020
-
[39]
& Høg, E
Hobbs, D. & Høg, E. 2018, in Astrometry and Astrophysics in the Gaia Sky, ed. A. Recio-Blanco, P. de Laverny, A. G. A. Brown, & T. Prusti, V ol. 330, 67–70
2018
-
[40]
Hunt, E. L. & Reffert, S. 2021, A&A, 646, A104
2021
-
[41]
Hunt, E. L. & Reffert, S. 2023, A&A, 673, A114
2023
-
[42]
Hunt, E. L. & Reffert, S. 2024, A&A, 686, A42
2024
-
[43]
Hunter, J. D. 2007, Computing in Science & Engineering, 9, 90 Ivezi´c, Ž., Kahn, S. M., Tyson, J. A., et al. 2019, ApJ, 873, 111
2007
-
[44]
& Adler, D
Janes, K. & Adler, D. 1982, ApJS, 49, 425
1982
-
[45]
Kalberla, P. M. W., Dedes, L., Kerp, J., & Haud, U. 2007, A&A, 469, 511
2007
-
[46]
V ., Piskunov, A
Kharchenko, N. V ., Piskunov, A. E., Röser, S., Schilbach, E., & Scholz, R. D. 2005, A&A, 440, 403
2005
-
[47]
V ., Piskunov, A
Kharchenko, N. V ., Piskunov, A. E., Schilbach, E., Röser, S., & Scholz, R. D. 2013, A&A, 558, A53
2013
-
[48]
2016, in ELPUB, 87–90
Kluyver, T., Ragan-Kelley, B., Pérez, F., et al. 2016, in ELPUB, 87–90
2016
-
[49]
W., et al
Koposov, S., Belokurov, V ., Evans, N. W., et al. 2008, ApJ, 686, 279
2008
-
[50]
2001, MNRAS, 322, 231
Kroupa, P. 2001, MNRAS, 322, 231
2001
-
[51]
R., McKee, C
Krumholz, M. R., McKee, C. F., & Bland-Hawthorn, J. 2019, Annual Review of Astronomy and Astrophysics, 57, 227
2019
-
[52]
Lada, C. J. & Lada, E. A. 2003, Annual Review of Astronomy and Astrophysics, 41, 57
2003
-
[53]
K., Pitrou, A., & Seibert, S
Lam, S. K., Pitrou, A., & Seibert, S. 2015, in Proc. Second Workshop on the LLVM Compiler Infrastructure in HPC, 1–6
2015
-
[54]
K., stuartarchibald, Pitrou, A., et al
Lam, S. K., stuartarchibald, Pitrou, A., et al. 2024, numba/numba: Numba 0.59.1
2024
-
[55]
Lamers, H. J. G. L. M., Gieles, M., Bastian, N., et al. 2005, A&A, 441, 117
2005
-
[56]
N., Kovtyukh, V ., et al
Lemasle, B., Lala, H. N., Kovtyukh, V ., et al. 2022, A&A, 668, A40
2022
-
[57]
S., Blitz, L., & Heiles, C
Levine, E. S., Blitz, L., & Heiles, C. 2006, ApJ, 643, 881
2006
-
[58]
& Dravins, D
Lindegren, L. & Dravins, D. 2021, A&A, 652, A45
2021
-
[59]
A., Hernández, J., et al
Lindegren, L., Klioner, S. A., Hernández, J., et al. 2021, A&A, 649, A2
2021
-
[60]
Lundberg, S. M. & Lee, S.-I. 2017, in Advances in Neural Information Process- ing Systems 30, ed. I. Guyon, U. V . Luxburg, S. Bengio, H. Wallach, R. Fer- gus, S. Vishwanathan, & R. Garnett (Curran Associates, Inc.), 4765–4774
2017
-
[61]
2023, A&A, 669, A119
Magrini, L., Viscasillas Vázquez, C., Spina, L., et al. 2023, A&A, 669, A119
2023
-
[62]
2017, The Journal of Open Source Software, 2
McInnes, L., Healy, J., & Astels, S. 2017, The Journal of Open Source Software, 2
2017
-
[63]
& Di Stefano, R
Moe, M. & Di Stefano, R. 2017, ApJS, 230, 15
2017
-
[64]
A., Carraro, G., et al
Moitinho, A., Vázquez, R. A., Carraro, G., et al. 2006, Monthly Notices of the Royal Astronomical Society, 368, L77
2006
-
[65]
2006, Astronomy and Astrophysics, 451, 515
Momany, Y ., Zaggia, S., Gilmore, G., et al. 2006, Astronomy and Astrophysics, 451, 515
2006
-
[66]
2025, A&A, 694, A70
Moreira, S., Moitinho, A., Silva, A., & Almeida, D. 2025, A&A, 694, A70
2025
-
[67]
2022, AJ, 164, 85 Article number, page 15 of 18 A&A proofs:manuscript no
Myers, N., Donor, J., Spoo, T., et al. 2022, AJ, 164, 85 Article number, page 15 of 18 A&A proofs:manuscript no. aa52614-24
2022
-
[68]
A., Çakmak, H., Michel, R., & Karata¸ s, Y
Netopil, M., Oralhan, ˙I. A., Çakmak, H., Michel, R., & Karata¸ s, Y . 2022, MN- RAS, 509, 421
2022
-
[69]
2012, in Astrophysics and Space Science
Netopil, M., Paunzen, E., & Stütz, C. 2012, in Astrophysics and Space Science
2012
-
[70]
29, Star Clusters in the Era of Large Surveys, 53 pandas development team, T
Proceedings, V ol. 29, Star Clusters in the Era of Large Surveys, 53 pandas development team, T. 2024, pandas-dev/pandas: Pandas
2024
-
[71]
2011, Journal of Machine Learning Research, 12, 2825
Pedregosa, F., Varoquaux, G., Gramfort, A., et al. 2011, Journal of Machine Learning Research, 12, 2825
2011
-
[72]
& Granger, B
Perez, F. & Granger, B. E. 2007, Computing in Science and Engineering, 9, 21
2007
-
[73]
I., Pera, M
Perren, G. I., Pera, M. S., Navone, H. D., & Vázquez, R. A. 2022, A&A, 663, A131
2022
-
[74]
I., Pera, M
Perren, G. I., Pera, M. S., Navone, H. D., & Vázquez, R. A. 2023, MNRAS, 526, 4107
2023
-
[75]
Petroff, M. A. 2021, arXiv e-prints, 2107.02270
2021 arXiv
-
[76]
A., & Kroupa, P
Pflamm-Altenburg, J., González-Lópezlira, R. A., & Kroupa, P. 2013, MNRAS, 435, 2604
2013
-
[77]
& Kroupa, P
Pflamm-Altenburg, J. & Kroupa, P. 2008, Nature, 455, 641 Portegies Zwart, S. F., McMillan, S. L. W., & Gieles, M. 2010, ARA&A, 48, 431
2008
-
[78]
W., et al
Riello, M., De Angeli, F., Evans, D. W., et al. 2021, A&A, 649, A3
2021
-
[79]
W., Boubert, D., et al
Rix, H.-W., Hogg, D. W., Boubert, D., et al. 2021, AJ, 162, 142
2021
-
[80]
M., Rix, H.-W., et al
Rybizki, J., Green, G. M., Rix, H.-W., et al. 2022, MNRAS, 510, 2597
2022
-
[81]
M., Skowron, J., Mróz, P., et al
Skowron, D. M., Skowron, J., Mróz, P., et al. 2019, Science, 365, 478
2019
-
[82]
2022, Universe, 8, 87
Spina, L., Magrini, L., & Cunha, K. 2022, Universe, 8, 87
2022
-
[83]
2016, ApJ, 816, 9
Sun, W., de Grijs, R., Fan, Z., & Cameron, E. 2016, ApJ, 816, 9
2016
-
[84]
2014, MNRAS, 445, 4287
Tang, J., Bressan, A., Rosenfield, P., et al. 2014, MNRAS, 445, 4287
2014
-
[85]
2021, A&A, 647, A19
Tarricq, Y ., Soubiran, C., Casamiquela, L., et al. 2021, A&A, 647, A19
2021
-
[86]
Trumpler, R. J. 1930, Lick Observatory Bulletin, 420, 154
1930
-
[87]
C., Girardi, L., et al
Usher, C., Dage, K. C., Girardi, L., et al. 2023, PASP, 135, 074201 Van Rossum, G. & Drake, F. L. 2009, Python 3 Reference Manual (Scotts Valley, CA: CreateSpace) Vázquez, R. A., May, J., Carraro, G., et al. 2008, The Astrophysical Journal, 672, 930
2023
-
[88]
E., et al
Virtanen, P., Gommers, R., Oliphant, T. E., et al. 2020, Nature Methods, 17, 261 Viscasillas Vázquez, C., Magrini, L., Spina, L., et al. 2023, A&A, 679, A122
2020
-
[89]
2024, TomWagg/software-citation- station: v1.2
Wagg, T., Broekgaarden, F., & Gültekin, K. 2024, TomWagg/software-citation- station: v1.2
2024
-
[90]
& Broekgaarden, F
Wagg, T. & Broekgaarden, F. S. 2024, arXiv e-prints, arXiv:2406.04405
2024
-
[91]
2000, Astron
Wenger, M., Ochsenbein, F., Egret, D., et al. 2000, Astron. Astrophys. Suppl. Ser., 143, 9 Wes McKinney. 2010, in Proceedings of the 9th Python in Science Conference, ed. Stéfan van der Walt & Jarrod Millman, 56 – 61
2000
-
[92]
2021, ApJ, 919, 52 Article number, page 16 of 18 Emily L
Zhang, H., Chen, Y ., & Zhao, G. 2021, ApJ, 919, 52 Article number, page 16 of 18 Emily L. Hunt et al.: The completeness of the open cluster census towards the Galactic anticentre Appendix A: Correlations in detectability between cluster parameters -10 -5 0 5 10 b [°] 0.0 0.2 ...
2021
Reviewed August 15, 2026 · model on record in the stance chip above.
Discussion (0). Continue with ORCID to comment.