REVIEW 2 major objections 3 minor 1 cited by
Mosaic Selections: Managing and Optimizing User Selections for Scalable Data Visualization Systems
T0 review · 2 major / 3 minor · reviewed 2026-08-06 · deepseek-v4-flash
Pith's one-line read This paper proposes a formal model of user selections as metadata-carrying filter predicates, and shows that analyzing them lets a system automatically build sparse pre-aggregated materialized views, keeping selection updates under 100ms…
desk verdict A solid formal contribution to selection management and sparse pre-aggregation, with a headline comparison to VegaFusion/VegaPlus that outsources the controls and should be re-run or re-scoped. read the letter →
The pith
A machine-rendered reading of the paper's core claim, the machinery that carries it, and where it could break.
The reading
What carries the argument
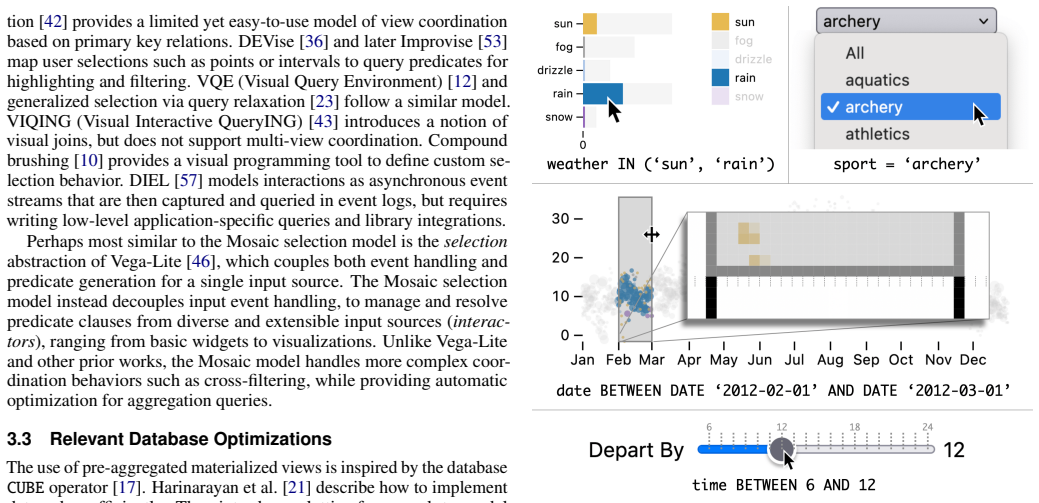
The load-bearing mechanism is the pre-aggregated materialized view: a sparse database table keyed by the client view's groupby dimensions plus the active selection's discretized bins, with measure columns holding sufficient statistics. Selection clause metadata, including type (point, interval, or match), pixelSize, bin function, and scale descriptors, tells the system how to map selection values to bins, while the client view's filterStable flag certifies that the groupby dimensions do not change under filtering. Given a compatible clause and query, the system automatically creates this table on demand and rewrites each selection update into a small query over it, reconstructing aggregates such as counts, averages, variances, correlations, and regression fits from the stored statistics.
What would settle it
A reader could rerun the paper's flight-delay histogram benchmark on a 100M-row table, sweeping a 20%-width interval in INTERSECT mode with fixed binning: if the materialized-view update ever exceeds 100ms, or if building the materialized view for a table below 100M rows takes more than about a second, the claimed scalability breaks.
Extended reading notes
Core claim
The paper's central claim is that a user selection can be formalized as a set of predicate clauses plus a resolution operator, and that this formalization turns interactive brushing into a query-optimization problem with enough structure to solve automatically. Given a selection resolved by INTERSECT or LAST, an active clause of point or interval type with scale metadata, and a client view whose grouping dimensions are declared stable, the system constructs a sparse materialized table pre-aggregated over the chart's groupby dimensions and the selection's pixel-level bins. Selection updates then become small aggregation queries over that table, using sufficient statistics to reconstruct counts, averages, variances, correlations, and regression fits. The paper argues this yields updates under 100ms, typically 1–10ms, on datasets up to 100M rows without precomputation and up to 1B rows with precomputed views, orders of magnitude faster than unoptimized queries and existing automatic optimizers.
Load-bearing premise
The speedup depends on the chart's grouping bins staying fixed while the selection changes, and on the selection being a point or interval resolved by intersection or latest-only semantics; every other selection type falls back to direct queries.
Editorial extensions
If this is right
- Histogram, raster, and regression-linked views can keep selection updates under 100ms, usually 1–10ms, up to around 100M rows with on-demand materialization and up to 1B rows when views are precomputed.
- Interface builders can specify cross-filtering at a high level: one selection's clauses filter some views and exclude their originating views, without hand-written coordination code.
- Pre-aggregation extends beyond COUNT and SUM to averages, variances, correlations, and regression fits, because materialized views store sufficient statistics rather than simple sums.
- Materialized views are named by a hash of their creation query, so identical updates from later sessions or other users reuse the cached table rather than rebuilding it.
- Selection updates that do not meet the compatibility checks fall back to direct queries, so the latency guarantees apply only to the optimized subset of interactions.
Reading between the lines
- If databases exposed mergeable sketches as first-class types, the same materialized-view machinery could extend to approximate COUNT(DISTINCT) and quantile selections; the paper lists sketches as future work but does not implement them.
- The hash-named materialized tables imply that any two applications sharing a database with identical creation queries automatically share cached pre-aggregates, which points toward simple LRU eviction policies for storage-constrained deployments.
- The model could be pushed into the database as parameterized projection-style update templates, letting engines choose sufficient statistics, maintain views incrementally, and partition work across servers; this would likely widen the billion-row cases that currently require compile-time precomputation.
Editorial analysis
A structured set of objections, weighed in public.
Referee Report
Summary. The paper presents Mosaic Selections, a formal model in which user selections in interactive visualizations are represented as sets of predicate clauses with a resolution operator, together with metadata describing scale, binning, and pixel-level resolution. The central technical contribution is an automatic optimization that analyzes an active selection clause and a client view query, constructs a sparse pre-aggregated materialized view containing sufficient statistics for the query's aggregates, and rewrites selection updates to query that materialized view instead of the base table. The authors implement the model in the open-source Mosaic architecture on top of DuckDB, support a broad set of SQL aggregates, and report benchmark results for multiple visualization templates (flights, NYC taxi, Gaia, UK property prices) at dataset sizes from 10K to 1B rows. They also include a secondary evaluation of data sorting and prefetching for panning interactions.
Significance. If the claims are fully supported, the paper makes a valuable contribution to scalable interactive visualization. The formal selection model cleanly separates interactor-generated predicates, cross-filtering, and resolution semantics, and the materialized-view optimization extends prior pre-aggregation work (imMens, Falcon) from dense arrays with COUNT/SUM to sparse relational tables with a much richer set of aggregate functions, including variance, covariance, correlation, and linear regression. The treatment of the SQL sufficient statistics appears technically correct, and the benchmarks convincingly show that the optimized Mosaic queries dramatically outperform the paper's own unoptimized-baseline queries on the evaluated workloads. The open-source implementation and benchmark code are additional strengths. The principal weaknesses are that the claimed comparison against external systems (VegaFusion and VegaPlus) is not a controlled evaluation, and that the formal description does not fully specify how pre-aggregation handles selections with multiple simultaneously active clauses.
major comments (2)
- [§7, Figure 12] The comparison to VegaFusion and VegaPlus is not a controlled evaluation. The manuscript cites results from Yang et al. [58] for VegaFusion and VegaPlus, run on different hardware than the authors' 2021 M1 Pro MacBook Pro with 16GB RAM, and the paper only asserts a 'comparable setup.' Because Figure 12 also shows unoptimized Mosaic SQL queries that are faster than these external numbers, the result could be dominated by environment differences rather than by Mosaic's pre-aggregation technique. This is load-bearing because the abstract and conclusion claim that Mosaic selections outperform 'existing optimizers for the Vega language.' The authors should either re-run VegaFusion and VegaPlus in the same benchmark environment, or rephrase the claim as a qualitative contextual comparison and remove 'outperforming existing optimizers' from the abstract if the controlled re-run is not performed.
- [§5.2 and §5.5] The dimension-determination procedure adds only the GROUP BY columns of the client query and the dimensions for the active clause ca, yet an INTERSECT selection can contain multiple clauses (for example, the NYC taxi dashboard in §2.2 uses both a time interval and a 2D pickup-location interval). The paper does not formally state how the non-active clauses are accounted for when constructing the materialized view. The statement in §5.5 that 'new materialized views are constructed for an active clause ca when one or more other selection clauses have changed' suggests that other clauses are embedded as fixed predicates in the materialized view creation query, but this is not described in the formal construction in §5.2, is not present in the example creation SQL of Figure 7, and is inconsistent with the claim that there is a 'unique materialized view for each (active clause, view query) pair ⟨ca, qv⟩.' Please specify the construction for multi-clause selections explicitly, including how the creation query incorporates the resolved predicates from the other clauses, and discuss the consequences for view reuse and for update latency when any non-active clause changes.
minor comments (3)
- [Abstract, §5.1, §8] The claims of a 'general model of user selections' and of scaling to 'millions and even billions of records' should be qualified by the applicability restrictions in §5.1: pre-aggregation applies only when the resolution operator is INTERSECT or LAST, the active clause is a point or interval type, the scale metadata is available, and the client view sets filterStable=true. UNION resolutions, match/regex clauses, joins, and dynamic binning fall back to unoptimized direct queries. The benchmarks all satisfy these conditions, so without this qualification the headline overstates the generality of the optimization.
- [§5.3, Table 4] The sufficient-statistic construction is described for COUNT, SUM, AVG, ARG_MIN/ARG_MAX, variance, and bivariate statistics, but Table 4 also lists GEOMEAN and other aggregate functions whose materialized measure columns are not explicitly specified in the text or figures. Please provide the sufficient statistics for all supported aggregates, even if only in an appendix.
- [§4.2] The description of pixelSize states that with pixelSize=2 'the materialized view may be half the size (hence faster to query).' This is imprecise: a pixelSize of k reduces the number of bins along each interactive dimension by a factor of k, so for a 1D interval selection the view shrinks by roughly k, and for a 2D selection by roughly k^2. Please clarify the relationship between pixelSize and materialized view size.
Circularity Check
No significant circularity: the pre-aggregation optimization is measured against internal baselines, and the external comparison is cited rather than derived by construction.
full rationale
The paper's central claim is an empirical performance result, not a derivation from definitions. The pre-aggregation method is implemented as explicit SQL construction and update queries (e.g., Fig. 7), and the reported speedups are measured in-paper against unoptimized Mosaic queries over the same DuckDB engine, dataset sizes, and hardware. That comparison is self-contained and does not reduce to the model's definitions. The external comparison to VegaFusion and VegaPlus reuses results from Yang et al. [58], including a co-author overlap, and is methodologically uncontrolled, but that is a benchmark-validity concern rather than circularity: no equation in this paper forces the cited numbers, and the headline internal optimization would stand without them. Self-citations to the prior Mosaic architecture paper [24] are used as implementation substrate, not as the evidence for the selection model or the benchmark improvements. The formal selection model (clauses, resolution operators, metadata, materialized view dimensions and sufficient statistics) is stated independently, and the applicability restrictions in §5.1 narrow the claim without making it tautological. No fitted parameter is renamed as a prediction, and no uniqueness theorem or ansatz is imported from the authors' prior work to forbid alternatives. Accordingly, no specific circular step can be quoted, and the paper deserves a clean circularity score.
Assumptions & free parameters
free parameters (1)
- interactor pixelSize =
1 by default; 2 for large rasters
assumptions (4)
- standard math Aggregate functions in Table 4 can be decomposed into sufficient statistics that compose under further aggregation.
- domain assumption Client views truthfully set filterStable=true only when their groupby dimensions are invariant to selection predicates.
- domain assumption Interactors supply accurate metadata: scale type, domain, range, base, exponent, symlog constant, pixelSize, and bin function.
- domain assumption Selection update workloads are repetitive enough that one-time materialization cost pays off.
Cite this review
Pith. "Pith review of Mosaic Selections: Managing and Optimizing User Selections for Scalable Data Visualization Systems." pith.science (2026). https://pith.science/paper/RVIE7LF3
@misc{pith2026250719690,
  author       = {Pith},
  title        = {Pith review of: Mosaic Selections: Managing and Optimizing User Selections for Scalable Data Visualization Systems},
  year         = {2026},
  howpublished = {\url{https://pith.science/paper/RVIE7LF3}},
  note         = {Machine review of arXiv:2507.19690}
}
read the original abstract
Though powerful tools for analysis and communication, interactive visualizations often fail to support real-time interaction with large datasets with millions or more records. To highlight and filter data, users indicate values or intervals of interest. Such selections may span multiple components, combine in complex ways, and require optimizations to ensure low-latency updates. We describe Mosaic Selections, a model for representing, managing, and optimizing user selections, in which one or more filter predicates are added to queries that request data for visualizations and input widgets. By analyzing both queries and selection predicates, Mosaic Selections enable automatic optimizations, including pre-aggregating data to rapidly compute selection updates. We contribute a formal description of our selection model and optimization methods, and their implementation in the open-source Mosaic architecture. Benchmark results demonstrate orders-of-magnitude latency improvements for selection-based optimizations over unoptimized queries and existing optimizers for the Vega language. The Mosaic Selection model provides infrastructure for flexible, interoperable filtering across multiple visualizations, alongside automatic optimizations to scale to millions and even billions of records.
Figures


Figures from the paper (11 more)



Forward citations
Cited by 1 Pith paper
-
Autark: A Serverless Toolkit for Prototyping Urban Visual Analytics Systems
Autark is a serverless toolkit that enables rapid prototyping of urban visual analytics systems via domain-aware abstractions and supports more reliable LLM-assisted coding.
Reference graph
Works this paper leans on
-
[58]
J. Yang, H. K. Joo, S. Yerramreddy, D. Moritz, and L. Battle. Optimizing Dataflow Systems for Scalable Interactive Visualization. Proc. ACM Conference on Management of Data (SIGMOD), 2(1):1–25, 2024. doi: 10. 1145/3639276 1, 3, 8
work page 2024
- [1]
- [2]
-
[3]
L. Battle and J. Heer. Characterizing Exploratory Visual Analysis: A Literature Review and Evaluation of Analytic Provenance in Tableau. Computer Graphics Forum (Proc. EuroVis), 38(3):145–159, 2019. doi: 10. 1111/cgf.13678 1
work page 2019
-
[4]
L. Battle and C. Scheidegger. A Structured Review of Data Management Technology for Interactive Visualization and Analysis. IEEE Transactions on Visualization and Computer Graphics, 27(2):1128–1138, 2021. doi: 10 .1109/tvcg.2020.3028891 1
arXiv 2021
-
[5]
R. A. Becker and W. S. Cleveland. Brushing Scatterplots. Technometrics, 29(2):127–142, 1987. doi: 10.1080/00401706.1987.10488204 1
arXiv 1987
-
[6]
M. Bostock, V . Ogievetsky, and J. Heer. D3 Data-Driven Documents.IEEE Transactions on Visualization and Computer Graphics, 17(12):2301–2309,
-
[7]
Bureau of Transportation Statistics. On-Time Performance. https://www.bts.gov/, 2023. 2
work page 2023
Show all 65 references
-
[8]
S. K. Card, T. P. Moran, and A. Newell. The Psychology of Human- Computer Interaction. L. Erlbaum Associates Inc., 1983. 1, 8, 12
1983
-
[9]
T. F. Chan, G. H. Golub, and R. J. Leveque. Algorithms for Computing the Sample Variance: Analysis and Recommendations. The American Statisti- cian, 37(3):242–247, 1983. doi: 10.1080/00031305.1983.10483115 6
1983 arXiv
-
[10]
H. Chen. Compound brushing. In Proc. IEEE Information Visualization, pp. 181–188. IEEE Computer Society, Seattle, Washington, 2003. doi: 10. 5555/1947368.1947402 1, 4
2003
-
[11]
F. C. Crow. Summed-area tables for texture mapping. In Proc. Computer Graphics and Interactive Techniques (SIGGRAPH), pp. 207–212. ACM,
-
[12]
Derthick, J
M. Derthick, J. Kolojejchick, and S. F. Roth. An interactive visual query environment for exploring data. In Proc. ACM Symposium on User In- terface Software and Technology (UIST), pp. 189–198. ACM Press, 1997. doi: 10.1145/263407.263545 4
1997
-
[13]
T. Dunning. The t-digest: Efficient estimates of distributions. Software Impacts, 7, 2021. doi: 10.1016/j.simpa.2020.100049 6
2021
-
[14]
Flajolet, É
P. Flajolet, É. Fusy, O. Gandouet, and F. Meunier. Hyperloglog: the analysis of a near-optimal cardinality estimation algorithm. Discrete Mathematics & Theoretical Computer Science, DMTCS Proceedings vol. AH,..., 2007. doi: 10.46298/dmtcs.3545 6
2007 doi
-
[15]
L., Sarro, L
Gaia Collaboration, Smart, R. L., Sarro, L. M., and 422 others. Gaia Early Data Release 3 - The Gaia Catalogue of Nearby Stars. Astronomy and Astrophysics, 649, 2021. doi: 10.1051/0004-6361/202039498 3
2021 doi
- [16]
-
[17]
J. Gray, S. Chaudhuri, A. Bosworth, A. Layman, D. Reichart, M. Venka- trao, F. Pellow, and H. Pirahesh. Data cube: A relational aggregation operator generalizing group-by, cross-tab, and sub-totals. Data Mining and Knowledge Discovery, 1:29–53, 1997. 4, 5
1997
-
[18]
W. D. Gray and D. A. Boehm-Davis. Milliseconds matter: An introduction to microstrategies and to their use in describing and predicting interactive behavior. Journal of Experimental Psychology: Applied, 6(4):322–335,
-
[19]
Gupta and I
A. Gupta and I. S. Mumick.Maintenance of Materialized Views: Problems, Techniques, and Applications, pp. 145–158. The MIT Press, 1999. doi: 10. 7551/mitpress/4472.003.0016 4, 9
1999
-
[20]
A. Y . Halevy. Answering queries using views: A survey. The VLDB Journal, 10(4):270–294, 2001. doi: 10.1007/s007780100054 1, 4, 5
2001 doi
-
[21]
Harinarayan, A
V . Harinarayan, A. Rajaraman, and J. D. Ullman. Implementing data cubes efficiently. ACM SIGMOD Record, 25(2):205–216, 1996. doi: 10. 1145/235968.233333 4
1996
-
[22]
J. Heer. Fast & Accurate Gaussian Kernel Density Estimation. In 2021 IEEE Visualization Conference (VIS), pp. 11–15. IEEE, 2021. doi: 10. 1109/vis49827.2021.9623323 6
2021
-
[23]
J. Heer, M. Agrawala, and W. Willett. Generalized selection via interactive query relaxation. In Proc. SIGCHI Conference on Human Factors in Computing Systems (CHI). ACM, 2008. doi: 10.1145/1357054.1357203 1, 4
2008
-
[24]
Heer and D
J. Heer and D. Moritz. Mosaic: An Architecture for Scalable & Interop- erable Data Views. IEEE Transactions on Visualization and Computer Graphics, pp. 1–11, 2023. doi: 10.1109/tvcg.2023.3327189 1, 6, 7
2023
-
[25]
Heer and B
J. Heer and B. Shneiderman. Interactive dynamics for visual analysis. Communications of the ACM, 55(4):45–54, 2012. doi: 10.1145/2133806. 2133821 1
2012 doi
-
[26]
Huang and E
Z. Huang and E. Wu. Lightweight Materialization for Fast Dashboards Over Joins. Proc. ACM Conference on Management of Data (SIGMOD), 1(4):1–27, 2023. doi: 10.1145/3626735 9
2023 doi
-
[27]
M. C. Jones and H. W. Lotwick. On the errors involved in computing the empirical characteristic function. Journal of Statistical Computation and Simulation, 17(2):133–149, 1983. doi: 10.1080/00949658308810650 6
1983 doi
-
[28]
Jugel, Z
U. Jugel, Z. Jerzak, G. Hackenbroich, and V . Markl. M4. Proc. VLDB Endowment, 7(10):797–808, 2014. doi: 10.14778/2732951.2732953 9
2014
-
[29]
Kathuria and S
T. Kathuria and S. Sudarshan. Efficient and Provable Multi-Query Opti- mization. In Proc. ACM SIGMOD-SIGACT-SIGAI Symposium on Princi- ples of Database Systems, pp. 53–67. ACM, 2017. doi: 10.1145/3034786. 3034792 1
2017 doi
- [30]
-
[31]
A. Kohn, D. Moritz, M. Raasveldt, H. Mühleisen, and T. Neumann. DuckDB-WASM. Proc. VLDB Endowment , 15(12):3574–3577, 2022. doi: 10.14778/3554821.3554847 7, 8
2022
-
[32]
Kruchten, J
N. Kruchten, J. Mease, and D. Moritz. VegaFusion: Automatic Server- Side Scaling for Interactive Vega Visualizations. In Proc. IEEE VIS Short Papers, pp. 11–15. IEEE, 2022. doi: 10.1109/vis54862.2022.00011 3, 8
2022
-
[33]
L. Lins, J. T. Klosowski, and C. Scheidegger. Nanocubes for Real-Time Exploration of Spatiotemporal Datasets. IEEE Transactions on Visualiza- tion and Computer Graphics, 19(12):2456–2465, 2013. doi: 10.1109/tvcg. 2013.179 1, 3
2013 doi
-
[34]
Liu and J
Z. Liu and J. Heer. The Effects of Interactive Latency on Exploratory Visual Analysis. IEEE Transactions on Visualization and Computer Graph- ics, 20(12):2122–2131, 2014. doi: 10.1109/tvcg.2014.2346452 1, 8
2014
-
[35]
Z. Liu, B. Jiang, and J. Heer. imMens: Realtime Visual Querying of Big Data. Computer Graphics Forum (Proc. EuroVis), 32(3pt4):421–430,
-
[36]
Livny, R
M. Livny, R. Ramakrishnan, K. Beyer, G. Chen, D. Donjerkovic, S. Lawande, J. Myllymaki, and K. Wenger. Devise. ACM SIGMOD Record, 26(2):301–312, 1997. doi: 10.1145/253262.253335 4
1997
-
[37]
Mohammed, Z
H. Mohammed, Z. Wei, E. Wu, and R. Netravali. Continuous prefetch for interactive data applications. Proc. VLDB Endowment, 13(12):2297–2311,
- [38]
-
[39]
Moritz, D
D. Moritz, D. Fisher, B. Ding, and C. Wang. Trust, but Verify: Optimistic Visualizations of Approximate Queries for Exploring Big Data. In Proc. ACM Conference on Human Factors in Computing Systems (CHI) , pp. 2904–2915. ACM, 2017. doi: 10.1145/3025453.3025456 9
2017
-
[40]
Moritz, J
D. Moritz, J. Heer, and B. Howe. Dynamic client-server optimization for scalable interactive visualization on the web. In Workshop on Data Systems for Interactive Analysis (DSIA), 2015. 9
2015
-
[41]
Moritz, B
D. Moritz, B. Howe, and J. Heer. Falcon: Balancing interactive latency and resolution sensitivity for scalable linked visualizations. In Proc. ACM Conference on Human Factors in Computing Systems (CHI) , pp. 1–11. ACM, 2019. doi: 10.1145/3290605.3300924 1, 3, 5, 7, 13
2019
-
[42]
North and B
C. North and B. Shneiderman. Snap-together visualization: A user in- terface for coordinating visualizations via relational schemata. In Proc. Conference on Advanced Visual Interfaces (AVI) , pp. 128–135. ACM,
-
[43]
Olston, M
C. Olston, M. Stonebraker, A. Aiken, and J. M. Hellerstein. VIQING: Visual Interactive QueryING. In Proc. IEEE Symposium on Visual Lan- guages, p. 162. IEEE Computer Society, USA, 1998. doi: 10.5555/832279 .834493 4
1998 doi
-
[44]
Raasveldt and H
M. Raasveldt and H. Mühleisen. DuckDB: An embedded analytical database. In Proc. ACM Conference on Management of Data (SIGMOD). ACM, 2019. doi: 10.1145/3299869.3320212 1, 7
2019
-
[45]
P. Roy, S. Seshadri, S. Sudarshan, and S. Bhobe. Efficient and extensible algorithms for multi query optimization. In Proc. ACM Conference on Management of Data (SIGMOD) . ACM, 2000. doi: 10.1145/342009. 335419 4
-
[46]
Satyanarayan, D
A. Satyanarayan, D. Moritz, K. Wongsuphasawat, and J. Heer. Vega-Lite: A Grammar of Interactive Graphics. IEEE Transactions on Visualization and Computer Graphics, 23(1):341–350, 2017. doi: 10.1109/tvcg.2016. 2599030 1, 3, 4
2017 doi
-
[47]
Satyanarayan, R
A. Satyanarayan, R. Russell, J. Hoffswell, and J. Heer. Reactive Vega: A Streaming Dataflow Architecture for Declarative Interactive Visualization. IEEE Transactions on Visualization and Computer Graphics, 22(1):659– 668, 2016. doi: 10.1109/tvcg.2015.2467091 3
2016
-
[48]
doi: 10.1145/345513.345282 4
-
[49]
Stolte, D
C. Stolte, D. Tang, and P. Hanrahan. Polaris: a system for query, analysis, and visualization of multidimensional relational databases. IEEE Transac- tions on Visualization and Computer Graphics, 8(1):52–65, 2002. doi: 10. 1109/2945.981851 3
2002
-
[50]
W. Tao, X. Hou, A. Sah, L. Battle, R. Chang, and M. Stonebraker. Kyrix-S: Authoring Scalable Scatterplot Visualizations of Big Data. IEEE Transac- tions on Visualization and Computer Graphics, 27(2):401–411, 2021. doi: 10.1109/tvcg.2020.3030372 1, 3
2021
-
[51]
W. Tao, X. Liu, Y . Wang, L. Battle, Ç. Demiralp, R. Chang, and M. Stone- braker. Kyrix: Interactive Pan/Zoom Visualizations at Scale. Computer Graphics Forum (Proc. EuroVis), 38(3):529–540, 2019. doi: 10.1111/cgf. 13708 1, 3
2019 doi
-
[52]
J. L. Watson, D. Juergens, N. R. Bennett, B. L. Trippe, J. Yim, H. E. Eise- nach, W. Ahern, A. J. Borst, R. J. Ragotte, L. F. Milles, B. I. M. Wicky, N. Hanikel, S. J. Pellock, A. Courbet, W. Sheffler, J. Wang, P. Venkatesh, I. Sappington, S. V . Torres, A. Lauko, V . De Borto...
2023 doi
-
[53]
C. Weaver. Building Highly-Coordinated Visualizations in Improvise. In IEEE Symposium on Information Visualization, pp. 159–166, 2004. doi: 10.1109/INFVIS.2004.12 4
2004 doi
-
[54]
T. K. Sellis. Multiple-query optimization. ACM Transactions on Database Systems, 13(1):23–52, 1988. doi: 10.1145/42201.42203 4
1988
-
[55]
H. Wickham. A Layered Grammar of Graphics. Journal of Computational and Graphical Statistics, 19(1):3–28, 2010. doi: 10.1198/jcgs.2009.07098 3
2010 arXiv
-
[56]
Wilkinson
L. Wilkinson. The Grammar of Graphics, pp. 375–414. Springer Berlin Heidelberg, 2011. doi: 10.1007/978-3-642-21551-3_13 3
2011 doi
-
[57]
Y . Wu, R. Chang, J. M. Hellerstein, A. Satyanarayan, and E. Wu. DIEL: Interactive Visualization Beyond the Here and Now. IEEE Transactions on Visualization and Computer Graphics, 28(1):737–746, 2022. doi: 10. 1109/tvcg.2021.3114796 4
2022
-
[59]
publishing
E. Zgraggen, A. Galakatos, A. Crotty, J.-D. Fekete, and T. Kraska. How Progressive Visualizations Affect Exploratory Analysis. IEEE Transac- tions on Visualization and Computer Graphics, 23(8):1977–1987, 2017. doi: 10.1109/tvcg.2016.2607714 1, 8 A D ATA SORTING AND PREFETCHING...
1977
-
[60]
J. B. W. Webber. A bi-symmetric log transformation for wide-range data. Measurement Science and Technology, 24(2):027001, 2012. doi: 10. 1088/0957-0233/24/2/027001 5
2012
-
[1984]
doi: 10.1145/800031.808600 7
-
[2000]
doi: 10.1037/1076-898x.6.4.322 1, 8
-
[2011]
doi: 10.1109/tvcg.2011.185 3
2011 doi
-
[2013]
doi: 10.1111/cgf.12129 1, 3, 7, 13
-
[2020]
doi: 10.14778/3407790.3407826 1, 3
Reviewed August 6, 2026 · model on record in the stance chip above.
Discussion (0). Sign in to comment.