REVIEW 4 major objections 5 minor 13 references
Machine Learning-Driven Anomaly Detection for 5G O-RAN Performance Metrics
T0 review · 4 major / 5 minor · reviewed 2026-08-15 · deepseek-v4-flash
Pith's one-line read Two ML detectors flag 5G handover and throughput risks in under 2.5 ms.
desk verdict Plausible ML pipeline on public O-RAN data, but the handover-mitigation claim is not supported by any outcome measurement. read the letter →
The pith
A machine-rendered reading of the paper's core claim, the machinery that carries it, and where it could break.
The reading
What carries the argument
The load-bearing object is the KPI report vector, a 19-entry snapshot made of downlink PRB usage and the radio-quality trio RSRP, RSSINR, and RSRQ for the serving cell and for five neighbor cells. Random Forest is the effective decision mechanism: it delivers the best precision/recall balance on Algorithm 1 and is reused for Algorithm 2, where the thresholded tree ensemble turns the vector into a binary 'anomalous coverage' flag per neighbor cell. The same pipeline is supervised by labels derived from comparing observed throughput to target throughput, and the design works because the trained models take only milliseconds to evaluate the whole 20-user batch.
What would settle it
Compare the algorithm's neighbor-cell anomaly flags against a dataset that pairs each KPI report window with the subsequent handover outcome, such as success, failure, or post-handover throughput. If anomalous neighbor-cell scores show little or no correlation with handover failure or throughput drop, or if the 41.27% filtered set contains good and bad targets in the same proportion as the unfiltered set, then Algorithm 2 does not improve handover reliability and the claim of mitigated post-handover failures collapses.
Extended reading notes
Core claim
The central discovery is that the same 19-feature KPI vector—downlink PRB usage plus RSRP, RSSINR, and RSRQ from the serving cell and five neighbor cells—can drive two complementary detectors. The serving-cell detector, best implemented as a Random Forest, predicts whether a UE's observed throughput will fall far below target (F1 = 0.90, accuracy = 93%) and can therefore trigger a proactive handover. The neighbor-cell detector applies the same style of model after excluding high-PRB-contention samples and flags on average 41.27% of neighbor-cell KPI reports as anomalous, shrinking the handover candidate pool from five cells to about three. The paper also reports that both detectors finish inference in 0.19–2.49 ms across all 20 users, comfortably inside O-RAN's near-real-time window, and that permutation importance and SHAP explanations consistently identify PRB utilization and RSSINR as the leading anomaly drivers while RSRQ plays only a minor role.
Load-bearing premise
The load-bearing premise is that unusual signal-strength and interference readings from a neighbor cell identify cells that would cause a failed handover, but the dataset contains no handover outcomes or post-handover quality measurements to confirm that link.
Editorial extensions
If this is right
- If the paper is correct, near-real-time O-RAN controllers can run both detectors as xApps inside their 10 ms-to-1 s loop and still have most of the budget left for data collection and recovery actions.
- Handover logic can be made proactive: Algorithm 1 alerts before a UE's throughput collapses, and Algorithm 2 gives the controller a shortlist of roughly three healthy neighbor cells instead of five.
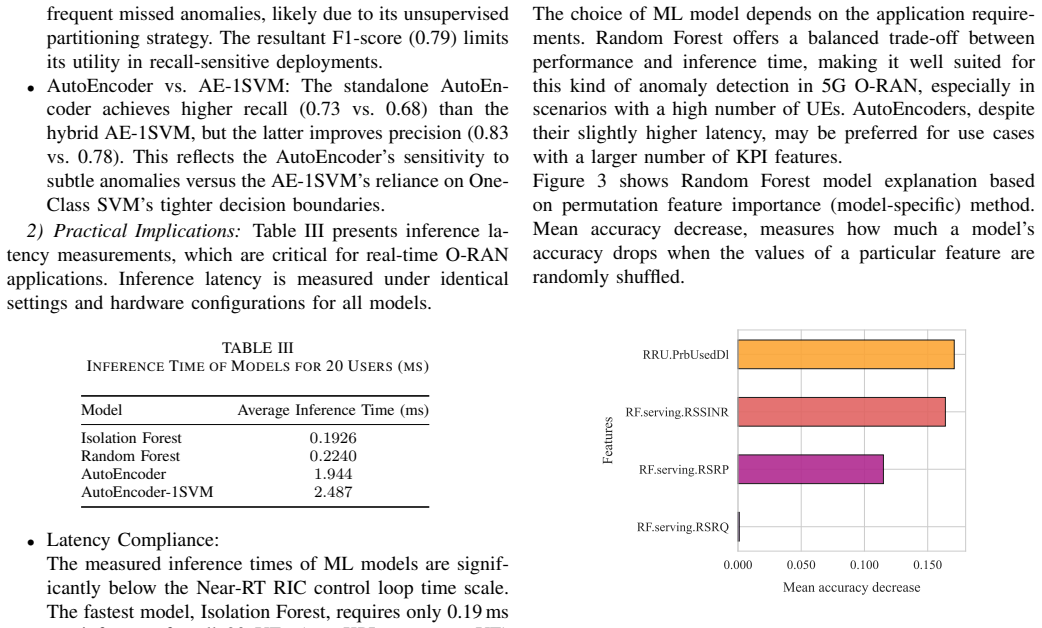
- Operators can explain every anomaly alert using SHAP or permutation-importance scores, pointing them to PRB contention or poor RSSINR rather than leaving them with a black-box verdict.
- Because the framework uses standard E2 KPM reports, the same models could drive other recovery actions beyond handover, and the approach carries over to 6G self-healing architectures.
Reading between the lines
- Editorial inference: the paper's operational claim about fewer post-handover failures is untested, because the dataset lacks actual handover outcomes; a natural next test is to label each KPI window with the handover result and see whether the 41.27% filter removes failing cells preferentially.
- Editorial inference: Figure 5 shows serving and neighbor RSSINR distributions nearly overlapping, including anomalous cases; this suggests Algorithm 2's 'anomalous' label may reflect site-wide coverage conditions rather than per-UE handover quality, so the filter may need calibrating against call-drop or throughput-after-handover data before deployment.
- Editorial inference: the reported 0.19–2.49 ms figures are model inference only; adding E2 report collection, near-real-time RIC scheduling, and UE measurement gaps would enlarge the end-to-end latency, so a full xApp-in-the-loop benchmark on a testbed would be the decisive latency check.
Signed reviews
Editorial analysis
A structured set of objections, weighed in public.
Referee Report
Summary. The paper proposes an ML-driven anomaly detection framework for 5G O-RAN, aiming to proactively detect UE throughput degradation and filter neighbor cells with poor radio coverage before handover. The framework consists of Algorithm 1, which classifies UEs at risk of severe throughput drops using serving-cell KPIs (PRB usage, RSRP, RSSINR, RSRQ), and Algorithm 2, which flags neighbor cells with anomalous coverage to narrow handover candidates. The authors evaluate four models (Isolation Forest, Random Forest, AutoEncoder, AutoEncoder-1SVM) on the O-RAN-SC ue.csv dataset, report that Random Forest achieves the best F1-score of 0.90 and accuracy of 93%, that Algorithm 2 filters out 41.27% of neighbor-cell KPI reports on average, and that inference times for 20 UEs are within O-RAN near-real-time constraints. The paper also includes XAI analysis via permutation importance and SHAP, identifying PRB utilization and RSSINR as key drivers.
Significance. If the central claims hold, the framework would be a useful, low-latency building block for O-RAN near-RT RIC xApps: it compares several anomaly detection models on a public dataset, measures inference latency directly, and provides model explanations. The raw classification results in Table II and latency results in Table III are plausible and could inform model selection for similar KPI-based monitoring tasks. However, the significance is currently limited by a disconnect between the stated goal of mitigating post-handover failures and the evaluated outcomes: no handover is simulated, no handover success/failure label is used, and no post-handover throughput is measured. The claim that reducing the neighbor-cell candidate set by 41.27% improves handover reliability is therefore an extrapolation from a proxy rather than a demonstrated result. The paper's value would increase substantially if the authors either add an outcome-based evaluation (simulated handover decisions with success/quality metrics) or explicitly reframe the contribution as candidate-set reduction without claiming handover-failure mitigation.
major comments (4)
- [Abstract and Section III.B] The abstract claims that the methods 'mitigate post-handover failures and throughput drops', but this is not tested anywhere in the paper. The dataset contains no handover success/failure labels or post-handover throughput measurements, and Section IV states that 'Handover mechanism details remain outside the scope of this work.' No handover is simulated, so there is no outcome metric connecting the flagged UEs or filtered neighbor cells to actual handover failures or throughput drops. This is a load-bearing over-claim; please either add an outcome-based evaluation (e.g., simulate handover to filtered vs. unfiltered cells and measure failure rates or post-handover throughput) or revise the claim to state that the methods reduce candidate sets and flag at-risk UEs without asserting proven handover mitigation.
- [Section II.B] The anomaly label is defined as 'observed throughput Tobs is significantly lower than the target throughput Ttarget', but 'significantly lower' is never quantified. This makes the ground truth for Algorithm 1 non-reproducible and prevents the reader from assessing the difficulty of the classification task. Please specify the exact labeling rule used on the O-RAN-SC dataset, including the threshold (e.g., Tobs < 0.5 × Ttarget or a specific percentile) and any time-window aggregation applied.
- [Section III.B] Algorithm 2 trains on a 'modified dataset' that excludes samples where PRB contention exceeds 70% utilization, and this exclusion is not a ground-truth label for neighbor-cell radio coverage quality. Calling 41.27% of neighbor-cell KPI reports anomalous is therefore a consequence of the authors' heuristic threshold rather than an empirically validated detection result. Moreover, Figure 5 shows that the RSSINR ECDFs for serving and neighbor cells are nearly identical, including for anomalous cases, and the text reports similar patterns for RSRP and RSRQ. This directly weakens the premise that the anomaly filter distinguishes bad handover candidates from good ones. Please provide evidence that the filtered cells are genuinely worse handover targets, for example by using labeled handover outcomes or by demonstrating a statistically significant distributional separation on independent, properly labeled data.
- [Section III.A, Table II] The performance comparison relies on a single train/test split of the O-RAN-SC dataset and reports point estimates without confidence intervals or statistical significance tests. Since only 20 users are present and the 10,000 reports are likely correlated per UE and over time, the reported F1 differences (e.g., Random Forest 0.90 vs. AutoEncoder 0.84) may not be robust. Please report the evaluation procedure (e.g., cross-validation, UE-grouped folds) and, ideally, confidence intervals, to support the model-selection conclusion.
minor comments (5)
- [Figures 3 and 4] Figures 3 and 4 appear to contain corrupted font encoding, with axis labels and feature names rendered as '/uni00000013/uni00000011/...' sequences. Please regenerate these figures so that feature names and labels are readable.
- [Figure 2] The label 'A.D.' in Figure 2 is used without definition; please spell out 'Anomaly Detection' or use a distinct abbreviation that will not be confused with common expansions.
- [Section III.A, Table III] The latency claim is specifically about ML model inference, not the end-to-end near-RT RIC control loop, since data collection, E2 messaging, and preprocessing are excluded. The text does acknowledge this, but the abstract's phrase 'operating much faster than the near-real-time latency constraints' could be read as a full-loop claim; please qualify it as 'model inference time' in the abstract.
- [Section II.C] The hyperparameter values in Table I are reported for only some parameters; please include all tuned hyperparameters (e.g., tree depth, learning rate, latent dimension) or provide a link to the source code to support reproducibility.
- [Section III.B] The sentence 'Algorithm 2 exhibits significantly higher latency compared to Algorithm 1' is misleading because both inferences are sub-millisecond or low-millisecond; the difference is statistically and practically small. Please use a more neutral phrasing such as 'somewhat higher' or report the exact difference.
Circularity Check
One near-circular element in Algorithm 2; no formal circularity in the core ML derivation.
-
fitted input called prediction
[Section III-B (Anomaly Detection Algorithm 2)]
"To train the second model, we used a modified dataset derived from the previous analysis, excluding samples where PRB contention exceeded 70% utilization, as these cases were identified as contributing to anomalies. This model was utilized to detect poor radio coverage from neighbor cells. Simulation results revealed that, on average, 41.27% of the neighbor cell KPI reports were identified as anomalous, roughly two out of five cells, from the UE's perspective. This outcome is beneficial because it narrows the selection to one of the three remaining neighbor cells for a more reliable handover."
The 41.27% figure is not measured against any handover outcome, post-handover throughput, or external coverage ground truth. It is simply the fitted second model's own flagging rate after the authors' dataset filter (removing samples with PRB contention above 70%). No ground-truth labels for 'poor radio coverage' are defined, so the claimed handover-reliability benefit re-inserts the model output as evidence: the 'reduction in candidate targets' is identical to the model's classification output by construction. This is a near-circular framing of a fitted quantity as a predicted benefit, though it does not feed back into Algorithm 1's independently evaluated F1 and latency results.
full rationale
Algorithm 1's derivation is self-contained: the anomaly label y=1 is defined by observed throughput being significantly lower than target throughput, and the model predicts that label from KPI features that do not include throughput, so the F1 and latency results are empirical classifications rather than a reinsertion of the target quantity. The only near-circular element is Algorithm 2, where the 41.27% candidate reduction is the fitted model's own flagging rate on a modified dataset, with no handover outcome or coverage ground truth to validate the 'reliable handover' benefit; the anomaly-label threshold is also unspecified, which is a reproducibility concern. Because there are no load-bearing self-citations or imported uniqueness claims, and the core ML derivation of Algorithm 1 remains independent, the overall circularity burden is low.
Assumptions & free parameters
free parameters (4)
- Anomaly labeling threshold
- PRB exclusion threshold =
70% downlink PRB utilization
- Unsupervised anomaly score thresholds
- ML model hyperparameters =
n_estimators=200; isolation forest max_samples=0.005; AE dropout 0.05/0.3; hidden [32,16,16,32]/[16,8,8,16]; sigma=1…
assumptions (4)
- domain assumption The public O-RAN SC KPI dataset [12] is representative of real 5G O-RAN behavior.
- domain assumption Throughput degradation is predictable from PRB utilization, RSRP, RSSINR, and RSRQ.
- domain assumption Coverage anomalies in neighbor cells are evidence of poor handover candidates.
- domain assumption ML inference latency measured on the authors' hardware transfers to a Near-RT RIC deployment.
Cite this review
Pith. "Pith review of Machine Learning-Driven Anomaly Detection for 5G O-RAN Performance Metrics." pith.science (2026). https://pith.science/paper/2HLYZVJD
@misc{pith2026250903290,
  author       = {Pith},
  title        = {Pith review of: Machine Learning-Driven Anomaly Detection for 5G O-RAN Performance Metrics},
  year         = {2026},
  howpublished = {\url{https://pith.science/paper/2HLYZVJD}},
  note         = {Machine review of arXiv:2509.03290}
}
read the original abstract
The ever-increasing reliance of critical services on network infrastructure coupled with the increased operational complexity of beyond-5G/6G networks necessitate the need for proactive and automated network fault management. The provision for open interfaces among different radio access network\,(RAN) elements and the integration of AI/ML into network architecture enabled by the Open RAN\,(O-RAN) specifications bring new possibilities for active network health monitoring and anomaly detection. In this paper we leverage these advantages and develop an anomaly detection framework that proactively detect the possible throughput drops for a UE and minimize the post-handover failures. We propose two actionable anomaly detection algorithms tailored for real-world deployment. The first algorithm identifies user equipment (UE) at risk of severe throughput degradation by analyzing key performance indicators (KPIs) such as resource block utilization and signal quality metrics, enabling proactive handover initiation. The second algorithm evaluates neighbor cell radio coverage quality, filtering out cells with anomalous signal strength or interference levels. This reduces candidate targets for handover by 41.27\% on average. Together, these methods mitigate post-handover failures and throughput drops while operating much faster than the near-real-time latency constraints. This paves the way for self-healing 6G networks.
Figures


Figures from the paper (2 more)


Reference graph
Works this paper leans on
-
[1]
A Vision of 6G Wireless Systems: Applications, Trends, Technologies, and Open Research Problems
Walid Saad and et al. A Vision of 6G Wireless Systems: Applications, Trends, Technologies, and Open Research Problems. IEEE Network , 34(3):134–142, 2020
work page 2020
-
[2]
Empowering the 6G Cellular Architecture With Open RAN
Michele Polese and et al. Empowering the 6G Cellular Architecture With Open RAN. IEEE Journal on Selected Areas in Communications , 42(2):245–262, 2024
work page 2024
-
[3]
Anomaly detection in mobile networks
Anis Nediyanchath and et al. Anomaly detection in mobile networks. In IEEE Wireless Communications and Networking Conference Workshops (WCNCW), pages 1–5. IEEE, 2020
work page 2020
-
[4]
Anomaly detection and root cause analysis enabled by artificial intelligence
Yannan Yuan and et al. Anomaly detection and root cause analysis enabled by artificial intelligence. In IEEE Globecom Workshops (GC Wkshps), pages 1–6. IEEE, 2020
work page 2020
-
[5]
Uncovering latency anomalies in 5G RAN - A combination learner approach
Tobias Sundqvist and et al. Uncovering latency anomalies in 5G RAN - A combination learner approach. In 14th International Conference on COMmunication Systems & NETworkS (COMSNETS) , pages 621–629. IEEE, 2022
work page 2022
-
[6]
Benchmarking of anomaly detection techniques in O-RAN for handover optimization
Zineb Mahrez and et al. Benchmarking of anomaly detection techniques in O-RAN for handover optimization. In International Wireless Com- munications and Mobile Computing (IWCMC) , pages 119–125. IEEE, 2023
work page 2023
-
[7]
SpotLight: Accurate, explainable and efficient anomaly detection for Open RAN
Chuanhao Sun and et al. SpotLight: Accurate, explainable and efficient anomaly detection for Open RAN. In Proceedings of the 30th Annual International Conference on Mobile Computing and Networking , pages 923–937, 2024
work page 2024
-
[8]
Scott M. Lundberg and et al. A Unified Approach to Interpreting Model Predictions. In Advances in Neural Information Processing Systems 30 , pages 4765–4774. Curran Associates, Inc., 2017
work page 2017
Show all 13 references
-
[9]
Near Real-Time RAN Intelligent Controller E2 Service Model KPM
O-RAN Work Group 3. Near Real-Time RAN Intelligent Controller E2 Service Model KPM. O-RAN Technical Specification, 2024
2024
-
[10]
Towards autonomous open radio access networks
Adrian Kliks and et al. Towards autonomous open radio access networks. ITU Journal on Future and Evolving Technologies, 4(2):251–268, 2023
2023
-
[11]
Scalable and interpretable one-class svms with deep learning and random fourier features
Minh-Nghia Nguyen and et al. Scalable and interpretable one-class svms with deep learning and random fourier features. In Machine Learning and Knowledge Discovery in Databases: European Conference, ECML PKDD 2018, Dublin, Ireland, September 10–14, 2018, Proceedings, Part I 18,...
2018
-
[12]
O-RAN-SC GitHub Page
O-RAN Software Community. O-RAN-SC GitHub Page. https://github. com/o-ran-sc/ric-app-ad/blob/master/src/ue.csv, 2021
2021
-
[13]
PyOD 2: A Python Library for Outlier Detection with LLM-powered Model Selection
Sihan Chen and et al. PyOD 2: A Python Library for Outlier Detection with LLM-powered Model Selection. arXiv preprint arXiv:2412.12154, 2024
2024 arXiv
Reviewed August 15, 2026 · model on record in the stance chip above.
Discussion (0). Continue with ORCID to comment.