Emission line models for the lowest mass core-collapse supernovae -- II. 3D NLTE radiative transfer modelling of a 9.0\,M_odot neutrino-driven explosion
Pith reviewed 2026-05-17 23:11 UTC · model grok-4.3
The pith
Three-dimensional NLTE models of a 9 solar mass supernova match observed emission lines and trace nickel plumes.
A machine-rendered reading of the paper's core claim, the machinery that carries it, and where it could break.
Core claim
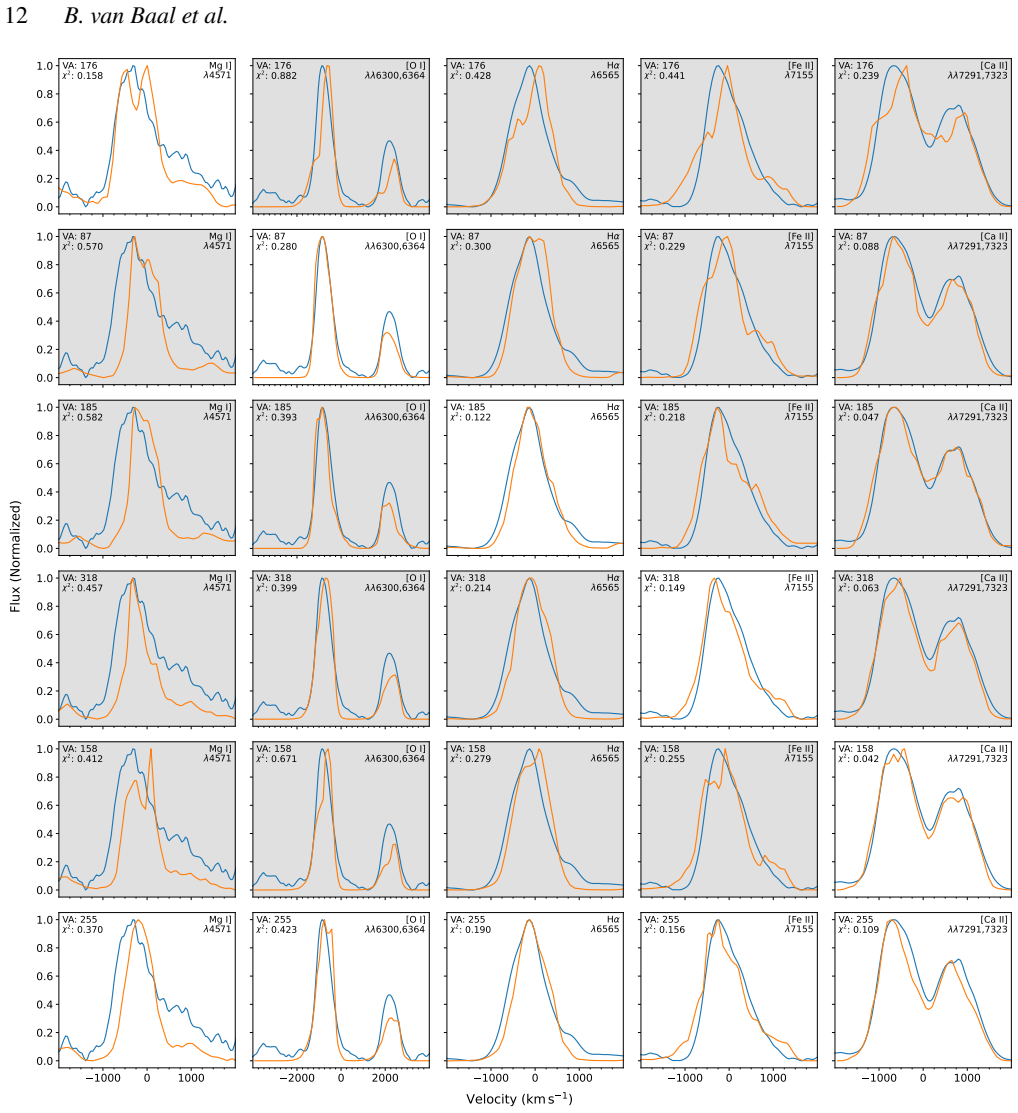
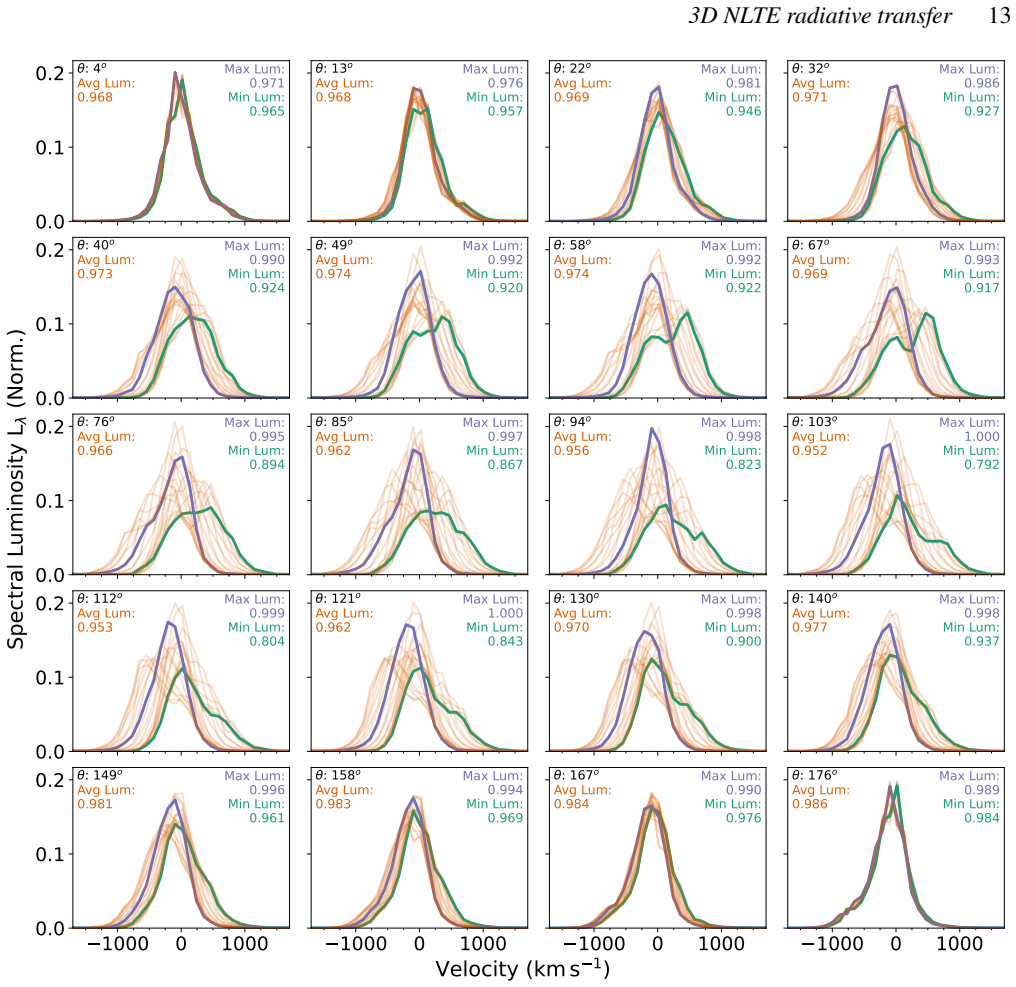
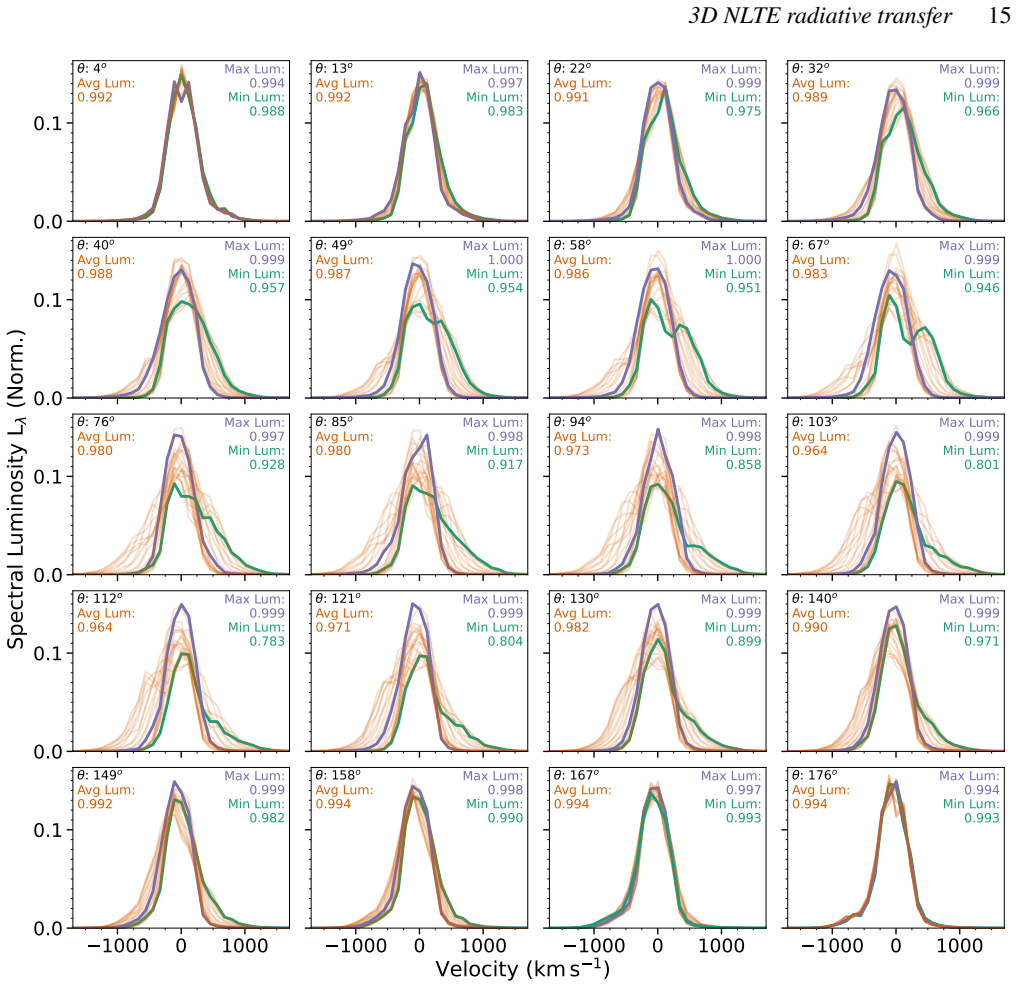
The authors perform 3D NLTE radiative transfer calculations with the ExTraSS code on a 3D explosion model of a 9.0 solar mass H-rich progenitor evolved to the homologous phase. The resulting spectra produce good line profile matches to both SN 1997D and SN 2016bkv, with reasonable luminosity matches for He, C, O and Mg lines in SN 1997D, although H alpha and Fe I lines are too strong. Key diagnostic lines that differentiate iron-core from electron-capture events remain valid in three dimensions. Both line profiles and luminosities vary across viewing angles because of ejecta asymmetries, and even the fastest 56Ni is traceable in the nebular phase line profiles.
What carries the argument
The primary nickel plume embedded in the three-dimensional element distribution of the homologous-phase ejecta from the 9 solar mass neutrino-driven explosion, processed through the ExTraSS code that includes full photoionization and line-by-line transfer.
Load-bearing premise
The input 3D explosion simulation accurately places nickel and other elements in their final spatial distribution once the ejecta reach homologous expansion.
What would settle it
A low-mass supernova whose nebular spectra at several epochs or angles show line profiles or luminosities for the diagnostic lines that cannot be matched by any viewing direction in the model.
Figures


read the original abstract
The nebular phase of a supernova (SN) occurs several months to years after the explosion, with asymmetries created by the explosion encoded into the line profiles of the emission lines. To make accurate predictions for these line profiles, Non-Local Thermodynamic Equilibrium (NLTE) radiative transfer calculations need to be carried out. In this work, we use $\texttt{ExTraSS}$ (EXplosive TRAnsient Spectral Simulator) -- which was recently upgraded into a full 3D NLTE radiative transfer code (including photoionization and line-by-line transfer effects) -- to perform such calculations. $\texttt{ExTraSS}$ is applied to a 3D explosion model of a $9.0\,M_\odot$ H-rich progenitor, evolved into the homologous phase. Synthetic spectra are computed and lines from different elements are studied for varying viewing angles. Line profile properties strongly correlate with a primary Ni plume in the ejecta. The model spectra are compared against observations of SN 1997D and SN 2016bkv. The model can create good line profile matches for both SNe, and reasonable luminosity matches for He, C, O, and Mg lines for SN 1997D -- however H$\alpha$ and Fe I lines are too strong. Key diagnostic lines of low-mass core-collapse SNe (CCSNe), e.g. differentiating Fe CCSNe from electron capture SNe, are upheld from 1D to 3D. However, both line profiles and line luminosities differ in 3D across viewing angles, enabling the possibility of detailed comparisons to observed spectra to infer asymmetries imprinted by the explosion. We show that even the fastest $^{56}$Ni is traceable in nebular phase line profiles.
Editorial analysis
A structured set of objections, weighed in public.
Referee Report
Summary. The paper applies the upgraded 3D NLTE radiative transfer code ExTraSS to a neutrino-driven 3D explosion model of a 9.0 M_⊙ H-rich progenitor evolved to the homologous phase. Synthetic nebular spectra are computed for multiple viewing angles, with line profiles and luminosities from elements including He, C, O, Mg, H, and Fe compared to observations of SN 1997D and SN 2016bkv. The model produces good line profile matches for both SNe and reasonable luminosity matches for several lines in SN 1997D, but overpredicts Hα and Fe I strengths. Key diagnostic lines distinguishing low-mass CCSNe (e.g., Fe CCSNe vs. ECSNe) are reported as preserved from 1D to 3D, and high-velocity 56Ni is claimed to remain traceable in the profiles despite 3D viewing-angle variations.
Significance. If robust, this work advances understanding of 3D explosion asymmetries encoded in nebular spectra of low-mass core-collapse supernovae. It demonstrates viewing-angle dependence in line properties, extends prior 1D modeling, and offers a potential observational probe for the fastest 56Ni material. The preservation of diagnostic lines across dimensions strengthens the case for using nebular spectra to classify explosion mechanisms.
major comments (3)
- [Abstract] Abstract and results sections: The claim that key diagnostic lines are upheld from 1D to 3D is central but rests on the specific 9 M_⊙ model; the over-strong Hα and Fe I lines (noted in the abstract) require explicit discussion of whether they indicate systematic offsets that could affect these diagnostics or the luminosity matches for He/C/O/Mg.
- [Results (Ni plume and line profiles)] Results on 56Ni traceability: The assertion that even the fastest 56Ni remains traceable in nebular line profiles depends on the accuracy of the input 3D explosion model's 56Ni spatial and velocity distribution. The manuscript does not report resolution or mixing-convergence tests on the hydrodynamical simulation, which directly impacts the predicted line wings and the robustness of this claim.
- [Comparison to SN 1997D and SN 2016bkv] Comparison to observations: While good profile matches are reported for SN 1997D and SN 2016bkv, the lack of quantitative error analysis or sensitivity tests to code assumptions (e.g., photoionization rates or NLTE approximations in ExTraSS) leaves unclear how robust the matches are to variations in the input abundance field.
minor comments (2)
- [Figures] Figures showing spectra for different viewing angles should include clear labels for the primary Ni plume orientation and quantitative measures of profile asymmetry (e.g., velocity shifts or equivalent widths).
- [Methods] Notation for elemental lines (e.g., Fe I) and model parameters should be consistently defined in the methods section to aid reproducibility.
Simulated Author's Rebuttal
We thank the referee for their constructive and detailed report, which has helped us identify areas for clarification and improvement. We address each major comment below and outline the revisions we will make to strengthen the manuscript.
read point-by-point responses
-
Referee: [Abstract] Abstract and results sections: The claim that key diagnostic lines are upheld from 1D to 3D is central but rests on the specific 9 M_⊙ model; the over-strong Hα and Fe I lines (noted in the abstract) require explicit discussion of whether they indicate systematic offsets that could affect these diagnostics or the luminosity matches for He/C/O/Mg.
Authors: We agree that the over-strong Hα and Fe I lines merit additional discussion to assess potential systematic effects. In the revised manuscript we will expand the abstract slightly and add a dedicated paragraph in the results section that examines possible origins of these discrepancies (e.g., uncertainties in the progenitor’s hydrogen envelope or NLTE rate approximations) and explicitly evaluates whether they compromise the key diagnostic lines used to distinguish Fe CCSNe from ECSNe. Those diagnostics rely primarily on well-matched lines such as [O I] λλ6300,6364 and [Ca II] λλ7291,7324, whose luminosities and profiles remain robust across the 1D-to-3D comparison for this model. revision: yes
-
Referee: [Results (Ni plume and line profiles)] Results on 56Ni traceability: The assertion that even the fastest 56Ni remains traceable in nebular line profiles depends on the accuracy of the input 3D explosion model's 56Ni spatial and velocity distribution. The manuscript does not report resolution or mixing-convergence tests on the hydrodynamical simulation, which directly impacts the predicted line wings and the robustness of this claim.
Authors: The 3D explosion model and its 56Ni distribution are taken from a previously published neutrino-driven simulation (Janka et al., in prep.; see also the model description in Section 2). While we did not perform additional resolution or mixing-convergence tests within the present study, the high-velocity Ni plume is a prominent, well-resolved feature of the simulation at the adopted grid resolution. We will add a short caveats subsection noting that the traceability of the fastest 56Ni in the line wings is subject to the numerical resolution of the input hydro model and that future higher-resolution runs could refine the wing strengths. Within the current model, however, the viewing-angle variations still allow the high-velocity Ni to be distinguished from the bulk ejecta. revision: partial
-
Referee: [Comparison to SN 1997D and SN 2016bkv] Comparison to observations: While good profile matches are reported for SN 1997D and SN 2016bkv, the lack of quantitative error analysis or sensitivity tests to code assumptions (e.g., photoionization rates or NLTE approximations in ExTraSS) leaves unclear how robust the matches are to variations in the input abundance field.
Authors: We acknowledge that a full quantitative error budget or exhaustive sensitivity study would further strengthen the comparison. Performing such tests for every NLTE parameter is computationally demanding, but we will revise the discussion section to include a concise assessment of the principal assumptions in ExTraSS (photoionization cross-sections, collisional rates, and the treatment of the input abundance field) and their expected influence on the reported line-profile matches. This will clarify the robustness of the good matches obtained for He, C, O, and Mg lines while noting the remaining tension in Hα and Fe I. revision: yes
Circularity Check
No significant circularity: forward NLTE modeling from independent 3D explosion input
full rationale
The paper takes a pre-existing 3D neutrino-driven explosion model of the 9 M⊙ progenitor (evolved to homologous phase) as input and computes synthetic spectra and line profiles via the ExTraSS NLTE radiative transfer code. These are direct computational outputs, not parameters fitted to the SN 1997D or SN 2016bkv data. Comparisons to observations occur after computation, with explicit discrepancies noted (over-strong Hα and Fe I). No equations reduce predictions to fitted quantities by construction, no self-definitional loops appear, and any self-citations (e.g., for the ExTraSS upgrade) are not load-bearing for the central claims. The derivation chain remains self-contained as predictive forward modeling.
Axiom & Free-Parameter Ledger
axioms (2)
- domain assumption The 3D explosion model has reached the homologous expansion phase with fixed velocity field and composition.
- standard math Standard atomic data and NLTE rate equations govern the level populations and line formation.
Lean theorems connected to this paper
-
IndisputableMonolith/Foundation/RealityFromDistinction.leanreality_from_one_distinction unclear?
unclearRelation between the paper passage and the cited Recognition theorem.
We use ExTraSS ... to perform such calculations. ExTraSS is applied to a 3D explosion model of a 9.0 M⊙ H-rich progenitor ... Synthetic spectra are computed and lines from different elements are studied for varying viewing angles.
What do these tags mean?
- matches
- The paper's claim is directly supported by a theorem in the formal canon.
- supports
- The theorem supports part of the paper's argument, but the paper may add assumptions or extra steps.
- extends
- The paper goes beyond the formal theorem; the theorem is a base layer rather than the whole result.
- uses
- The paper appears to rely on the theorem as machinery.
- contradicts
- The paper's claim conflicts with a theorem or certificate in the canon.
- unclear
- Pith found a possible connection, but the passage is too broad, indirect, or ambiguous to say the theorem truly supports the claim.
Forward citations
Cited by 1 Pith paper
-
Low-Luminosity Type IIP Supernovae from the Zwicky Transient Facility Census of the Local Universe. III: Hunting for electron-capture supernovae using nebular spectroscopy
Nebular spectroscopy of low-luminosity Type IIP SNe from ZTF identifies two plausible ECSN candidates but derives an upper limit on the ECSN rate of ≲(5–8)×10² Gpc⁻³ yr⁻¹ implying a sAGB mass window narrower than 0.06 M⊙.
Reference graph
Works this paper leans on
-
[1]
Arnett D., 1996, Supernovae and Nucleosynthesis: An Investigation of the History of Matter from the Big Bang to the Present Benetti S., et al., 2001, MNRAS, 322, 361 BolligR.,YadavN.,KresseD.,JankaH.-T.,MüllerB.,HegerA.,2021,ApJ, 915, 28 Brocklehurst M., 1971, MNRAS, 153, 471 BronnerV.A.,LaplaceE.,SchneiderF.R.N.,PodsiadlowskiP.,2025,arXiv e-prints, p. ar...
discussion (0)
Sign in with ORCID, Apple, or X to comment. Anyone can read and Pith papers without signing in.