REVIEW 2 major objections 5 minor 3 cited by
This paper argues that massive stars dominate carbon production in the Milky Way, with AGB stars contributing only 10–40% of solar carbon.
Reviewed by Pith at T0; open to challenge. T0 means a machine referee read the full paper against a public rubric. the ladder, T0–T4 →
T0 review · deepseek-v4-flash
2026-08-03 20:10 UTC pith:ED3LRAUN
load-bearing objection This is a competent, honest extension of the Johnson et al. N-yield program to carbon: the qualitative claim that CCSN C yields rise with metallicity is robust, but the headline 10–40% AGB fraction is softer than it looks because it depends on assumed SN Ia Fe production. the 2 major comments →
The galactic chemical evolution of carbon: Implications for stellar nucleosynthesis
The pith
A machine-rendered reading of the paper's core claim, the machinery that carries it, and where it could break.
Core claim
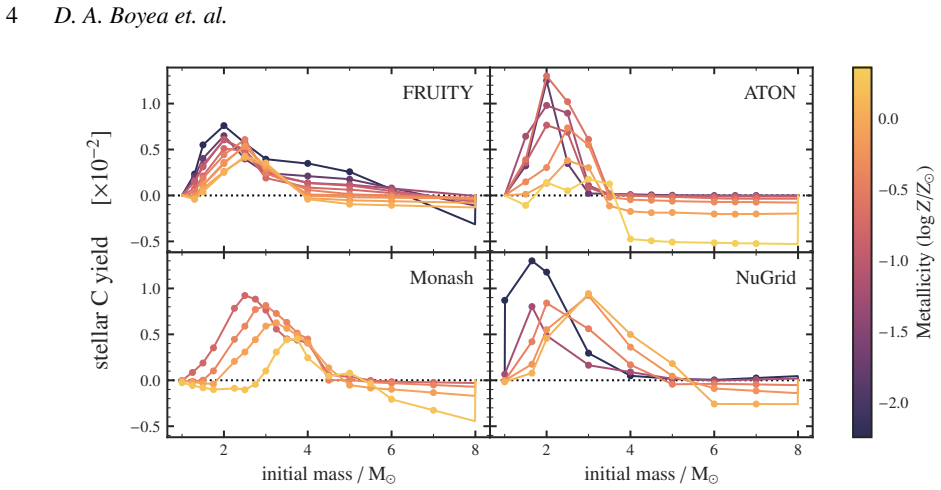
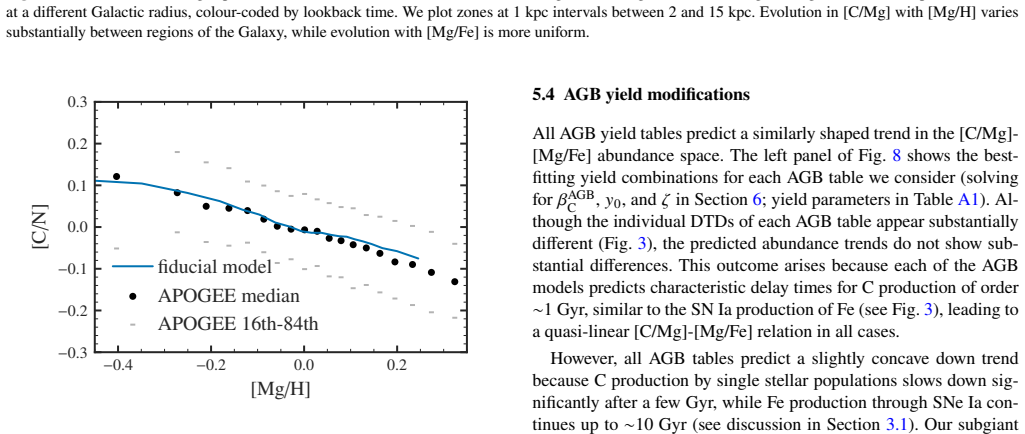
Using a multi-zone chemical evolution model with separate tracking of carbon from core-collapse supernovae and AGB stars, benchmarked against subgiant stars whose surface carbon reflects their birth composition, the paper establishes two connected claims. The observed rise of [C/Mg] with [Mg/H] is set by the total carbon yield versus metallicity; since all standard AGB yields decline with metallicity, massive-star carbon yields must rise with metallicity, as rotating massive-star models predict. The slope of [C/Mg] versus [Mg/Fe] at fixed [Mg/H] isolates delayed carbon production and implies AGB stars supply 10–40% of solar carbon (median ≈18–20%). The observed relation is more linear than A
What carries the argument
Central is a multi-zone chemical evolution model with radial stellar migration, in which carbon is decomposed into two linear channels—prompt core-collapse supernova yields and delayed AGB yields ('process tracking'). Massive-star carbon is parameterized as y_CC_C = y0 + ζ(Z−Z_sun)/Z_sun, and AGB carbon by a scaling factor β_AGB with a solar-metallicity fraction f_AGB. The argument rides on two abundance planes: [C/Mg] versus [Mg/H], which at equilibrium encodes the metallicity dependence of total carbon yield, and [C/Mg] versus [Mg/Fe] at fixed [Mg/H], which encodes the timing of delayed carbon relative to type-Ia iron. Four independent AGB yield tables are tested.
Load-bearing premise
The 10–40% AGB carbon fraction rests on the assumed type-Ia supernova iron yield (7.8×10^-4 per solar mass of star formation) and its delay-time distribution (∝ t^-1.1, 150 Myr minimum); if delayed iron production differs, the inferred AGB fraction shifts roughly proportionally.
What would settle it
A direct measurement of the type-Ia supernova delay-time distribution from volumetric rates showing a faster decline than t^-1.1 would shift the inferred AGB carbon fraction; a high-precision subgiant sample that reveals a concave [C/Mg]-[Mg/Fe] trend would remove the need for the lower-mass AGB shift; and AGB yields measured from resolved stars that do not decline with metallicity would break the claim that massive-star yields must rise.
If this is right
- The Sun's carbon is about 80% from massive stars; carbon joins the short list of elements whose solar abundance is CCSN-dominated.
- Rotating massive-star nucleosynthesis models that make carbon yields rise with metallicity are supported, while non-rotating models with flat yields are disfavoured.
- Standard AGB yield tables fail to reproduce the linearity of the [C/Mg]-[Mg/Fe] trend; either AGB carbon production must be shifted to lower-mass, longer-lived stars, or the assumed type-Ia iron yield/delay-time distribution must change.
- The inferred ratio y_CC_C/y_Mg ≈ 4.2 at solar metallicity, with its positive metallicity gradient, becomes a quantitative target for stellar yield models.
Where Pith is reading between the lines
- Editorial inference: because the AGB fraction is extracted from the timing of iron, an independent high-precision measurement of the type-Ia delay-time distribution would either confirm the 10–40% range or reveal that part of the inferred AGB 'delay' is an iron-production artefact.
- Editorial inference: the same two-plane diagnostic can be applied to other elements produced by both prompt and delayed channels (nitrogen, fluorine, s-process species), yielding an empirical yield-metallicity map from existing subgiant samples.
- Editorial inference: the model's predicted non-monotonic carbon yield—a dip in [C/O] near [O/H] ≈ −1.5—is a testable universal relation for metal-poor galaxies and damped Lyman-alpha systems, independent of star-formation history.
- Editorial inference: because the models reach chemical equilibrium early, the [C/Mg]-[Mg/Fe] relation should be nearly universal across disk galaxies in equilibrium, with deviations flagging recent bursts—testable with stellar abundances in nearby disks.
Editorial analysis
A structured set of objections, weighed in public.
Referee Report
Summary. This paper constrains the nucleosynthetic origin of carbon in the Milky Way disk using chemical evolution models benchmarked against APOGEE subgiant abundances. The authors build multi-zone GCE models with the public code vice, using four AGB yield tables and a linear metallicity-dependent CCSN yield parameterization (Eq. 9). An MCMC 'process tracking' fit to the [C/Mg]-[Mg/H] and [C/Mg]-[Mg/Fe] trends gives a total C/Mg yield ratio of ~4.2 at solar metallicity, a CCSN C yield that increases with metallicity, and an AGB yield fraction f_AGB of 10-40%, with median near 0.18-0.20 for most models. The paper also compares to gas-phase [C/O] data, finding that the fiducial model overpredicts [C/O] at [O/H]< -1, and proposes that a non-monotonic massive-star C yield may be required.
Significance. If the inference holds, this is an important result: it favors massive stars as the dominant source of solar carbon (AGB contributing only ~20%), reviving the case for metallicity-dependent CCSN C yields consistent with rotating models of Limongi & Chieffi (2018). The study's strengths are its systematic exploration of four AGB yield tables, multiple SFHs, yield-scale degeneracies, and a systematic error term in the likelihood; the process-tracking MCMC is a clean and powerful way to map abundance trends into yield constraints. The qualitative conclusion about the CCSN yield-metallicity trend is on solid ground. However, the quantitative 10-40% AGB fraction is conditioned on fixed SN Ia Fe yield and DTD assumptions, and the paper's own sensitivity tests indicate that the upper bound is not a full systematic envelope. The low-metallicity gas-phase discrepancy further suggests the adopted linear CCSN yield model is incomplete. These issues are acknowledged in the text, but they are load-bearing for the headline claim and should be addressed in revision.
major comments (2)
- [§6.2, Table C1, Fig. 9] The headline result that AGB stars produce 10-40% of solar C is not a full systematic envelope: it is computed with the SN Ia Fe yield fixed at 7.82×10^-4 per stellar mass and DTD fixed at t^-1.1 with 150 Myr minimum (Table 2). A 1.2× increase in the SN Ia Fe yield alone changes f_AGB from 0.178 to 0.252 for FRUITY (Table C1), a ~40% relative shift, and §5.4 shows that a more rapidly declining DTD would linearize the [C/Mg]-[Mg/Fe] relation in the same way as shifting AGB yields to lower masses. The quoted 98th-percentile upper limit of 0.4 therefore does not include plausible joint variations of these Fe-delivery parameters; a modest combined perturbation could push the inferred fraction above 40%. To make the headline robust, the authors should marginalize over the SN Ia Fe yield and DTD shape (e.g., over the range of published rates and DTDs) or present the constraint explicitly as co
- [§7, Fig. 10] The gas-phase comparison reveals that the fiducial model overpredicts [C/O] by ~0.2 dex at [O/H]≈-1, and the GSE-like single-zone model fares worse, a discrepancy the paper itself calls a 'breakdown of our fiducial yield prescription' (§7). Because the linear CCSN yield model (Eq. 9) is used in the MCMC inference, the true low-metallicity behavior may be non-monotonic, as the paper suggests in its four-stage scenario. If a more flexible CCSN yield (e.g., piecewise or polynomial) is required to match the gas-phase data, the inferred solar-metallicity f_AGB could shift outside the quoted 10-40% range, since the yield at solar metallicity is tied to the low-metallicity plateau in the fiducial model. The authors should test this explicitly by re-running the MCMC with a yield parameterization that also fits the gas-phase [C/O] data.
minor comments (5)
- [§3.1, Eq. (5)] f_AGB as defined in Eq. (5) is the ratio of IMF-averaged yields at solar metallicity, not the actual fraction of the Sun's birth C abundance; the abstract and conclusions should consistently use 'yield fraction' to avoid overstating the meaning, though the text does note this caveat.
- [Appendix A, Table A1 & Appendix C, Table C1] There is an internal naming inconsistency: 'FRUITYshifted' in Table A1 has β_AGB=1.29 while the 'mass shift 0.7' row has β_AGB=2.34, and Table C1 lists 'FRUITYshifted' with β_AGB=1.29. Clarify which entry corresponds to the MCMC best fit and which to the illustrative shift model, otherwise readers cannot tell which parameters produced the 'FRUITY shifted' curves in Figs. 8-9.
- [Fig. 3, right panel] The caption 'ATON reaches a minimum of -3 at a time of 0.3 Gyr' is ambiguous; specify the units and meaning (e.g., cumulative yield in units of 10^-4 or a dimensionless cumulative fraction).
- [Data Availability] The statement that 'Data and code are happily available upon request' is welcome but weaker than a permanent public repository. Since the analysis uses public tools (vice, Turing.jl), providing the fitting scripts and processed yield tables would make the results fully reproducible.
- [§4, Table 2] The SN Ia Fe yield is quoted as 7.82×10^-4 per stellar mass, but the text says 2.2×10^-3 events per M_sun and 0.355 M_sun of Fe per event; state explicitly that 7.82×10^-4 = rate × Fe mass, and specify the DTD normalization.
Circularity Check
No significant circularity: f_AGB is reported as an MCMC-inferred parameter, not as an independent prediction, and the paper tests against external gas-phase data.
full rationale
The central quantitative result—AGB stars produce 10–40% of solar C—is not a hidden prediction derived from its own inputs. It is explicitly presented as an MCMC inference: Section 6.1 fits β_AGB, y_low, and ζ_CC to the APOGEE [C/Mg]-[Mg/H] and [C/Mg]-[Mg/Fe] trends, and Section 6.2 reports the resulting f_AGB. Equation 5 defines f_AGB from the fitted yields, but the paper labels this an 'inferred AGB fraction' (Fig. 9), not an independent prediction. Using observed trends to estimate yield parameters is standard parameter estimation, not circularity. The qualitative claim that CCSN C yields rise with metallicity is likewise a comparison between the observed [C/Mg]-[Mg/H] trend and independent AGB yield tables (FRUITY, ATON, Monash, NuGrid); it does not reduce to the model inputs. Self-citations to Johnson et al. (2021, 2023a, 2025b) and Weinberg et al. (2024) supply the GCE framework, SN Ia Fe yields, and DTD, but these are externally anchored (Maoz & Mannucci 2012; Rodríguez et al. 2023) and the paper explicitly tests sensitivity to them. Section 6.2 states that a 1.2× change in SN Ia Fe yield shifts f_AGB by ~1.2×, and Section 5.4 notes that a more rapidly declining DTD would also linearize the [C/Mg]-[Mg/Fe] relation; these are acknowledged degeneracies and model dependencies, not hidden identities. Finally, the gas-phase [C/O] comparison in Section 7 is an external test, and the paper reports that its fiducial model overestimates [C/O] at low metallicity—falsification-like behavior rather than confirmation by construction. The derivation is therefore self-contained against external benchmarks; the score reflects only minor, non-load-bearing self-citation, not circularity.
Axiom & Free-Parameter Ledger
free parameters (5)
- beta_AGB_C (AGB yield scaling factor) =
Fiducial 2.57; MCMC best-fit FRUITY 1.55±0.04; range 0.59–3.06 across models
- y0 (CCSN C yield at solar metallicity) =
Fiducial 18.7e-4; MCMC FRUITY 22.3e-4 (Table C1)
- zeta_CC_C (CCSN C yield metallicity slope) =
Fiducial 7.9e-4; MCMC FRUITY 7.2e-4
- sigma_sys (systematic uncertainty term) =
0 or 0.05 dex
- AGB progenitor-mass shift factor =
0.5, 0.7, 1, 1.5 (0.7 preferred)
axioms (7)
- domain assumption Subgiant photospheric C abundances approximate birth abundances after gravitational settling reincorporation.
- domain assumption The four AGB yield tables (FRUITY, ATON, Monash, NuGrid) are representative of true AGB C yields and delay times.
- ad hoc to paper The CCSN C yield is a linear function of metallicity (Eq. 9).
- domain assumption SN Ia Fe enrichment follows t^-1.1 DTD with 150 Myr minimum delay and fixed Fe yield per event.
- domain assumption Mg yield is metallicity-independent and representative of alpha elements.
- domain assumption Kroupa IMF and Larson mass-lifetime relation are adopted for yield integration.
- ad hoc to paper Process-tracking linearity: total C abundance is a linear combination of CCSN and AGB process abundances.
read the original abstract
Carbon (C) is thought to be produced by both core collapse supernovae (CCSN) and asymptotic giant branch (AGB) stars, but the relative contributions of these two sources are uncertain. We investigate the astrophysical origin of C using models of Galactic chemical evolution (GCE) appropriate for the Milky Way disk. We benchmark our results against APOGEE subgiant abundances. The trend between [C/Mg] and [Mg/H] is set by the total C yield as a function of metallicity. Observations indicate a gently rising [C/Mg] with [Mg/H], but AGB C production is predicted to decline with metallicity. Our sample therefore favours a scenario in which CCSN yields rise with metallicity to offset declining AGB C yields and drive a subtle increase in [C/Mg] with [Mg/H]. This result is consistent with massive star nucleosynthesis models incorporating rotation. The [C/Mg]-[Mg/Fe] trend is sensitive to delayed enrichment and therefore constrains the amount of AGB C production. Given the slope of this relation, we find that AGB stars likely account for 10-40 per cent of C at solar metallicity. Artificially shifting the AGB C yields towards lower mass stars with longer lifetimes also improves agreement with the observed [C/Mg]-[Mg/Fe] trend, possibly indicating a discrepancy with stellar evolution predictions or our assumed Fe production rate.
Figures





Forward citations
Cited by 3 Pith papers
-
JWST high-contrast spectroscopy with speckle modelling: Atmospheric retrievals of the T dwarf companion HD 19467 B
Joint speckle-atmosphere retrievals on JWST spectra of HD 19467 B and a field T dwarf detect H2O, CH4, CO, CO2 and NH3, yield carbon isotopic ratios of 154 and 85 respectively, and show near-solar metallicity with sub...
-
Are Nucleosynthetic Yields Universal? Interpreting the Multi-Elemental Abundances of Quiescent Galaxies over Cosmic Time Using Milky Way Stars
Milky Way abundance trends act as effective empirical proxies for nucleosynthetic yields, recovering alpha and Fe-peak abundances in quiescent galaxies with 0.05 dex median offset versus 0.23 dex for theory, indicatin...
-
Towards a measurement of the primordial helium isotope ratio
New VLT observations of He I* absorbers yield a primordial ³He/⁴He ratio of (1.15^{+0.24}_{-0.21})×10^{-4} consistent with standard Big Bang nucleosynthesis, plus an updated stellar yield scaling factor.
Reference graph
Works this paper leans on
-
[1]
Abdurro’uf et al., 2022, ApJS, 259, 35 Amarsi A. M., Nissen P. E., Skúladóttir Á., 2019, A&A, 630, A104 Amorín R., et al., 2017, Nature Astronomy, 1, 0052 Andrews B. H., Weinberg D. H., Schönrich R., Johnson J. A., 2017, ApJ, 835, 224 Arellano-Córdova K. Z., et al., 2022, The Astrophysical Journal, 940, L23 Astropy Collaboration et al., 2013, A&A, 558, A3...
arXiv 2022
-
[3]
(2018) yield modelswithnewreactionratesandincreasedmixing.Thesechanges allowforanimprovedtreatmentofs–processisotopesintheirmodels
update the Ritter et al. (2018) yield modelswithnewreactionratesandincreasedmixing.Thesechanges allowforanimprovedtreatmentofs–processisotopesintheirmodels. However, between these models, the only updates are for masses 2 and3 M⊙ at metallicities𝑍=0.01,0.02,0.001,0.002. Because the yield tables included in Battino et al. (2019,
2018
-
[4]
(2018) definitions of yields, we recalculate these yields from the publicly available data onhttps: //astrohub.uvic.ca
are inconsistent with the Ritter et al. (2018) definitions of yields, we recalculate these yields from the publicly available data onhttps: //astrohub.uvic.ca. The total ejected mass of𝑋from an AGB star is given by 𝑀𝑋,ej = ∫ 𝑍𝑋,surf(𝑡)¤𝑚(𝑡)𝑑𝑡(B1) where𝑍 𝑋,surf is the surface abundance of𝑋,¤𝑚is the mass loss rate, and the integral is taken over the entire ...
2018
-
[2021]
These models use the NuGrid MPPNP post-processing toolkit on modelsrunusingthemesastellarevolutioncode(Paxtonetal.2011)
yield tables and describe their incorporation intovice. These models use the NuGrid MPPNP post-processing toolkit on modelsrunusingthemesastellarevolutioncode(Paxtonetal.2011). Battino et al. (2019,
2011
discussion (0)
Sign in with ORCID, Apple, or X to comment. Anyone can read and Pith papers without signing in.