REVIEW 4 major objections 4 minor 49 references
The Extremity Premium: Sentiment Regimes and Adverse Selection in Cryptocurrency Markets
T0 review · 4 major / 4 minor · reviewed 2026-08-03 · deepseek-v4-flash
Pith's one-line read Sentiment extremity, not direction, predicts wider Bitcoin spreads after volatility is controlled.
desk verdict Honest, thorough paper that documents a plausible raw pattern but fails to identify the 'beyond volatility' claim; send to peer review with major-revision expectations. read the letter →
The pith
A machine-rendered reading of the paper's core claim, the machinery that carries it, and where it could break.
The reading
What carries the argument
The central object is the extremity premium itself: the gap in mean spread or uncertainty between extreme sentiment regimes (Crypto Fear & Greed Index below 25 or above 75) and neutral regimes (45–55). The argument is carried by classifying days into sentiment regimes and then comparing extreme versus neutral days within realized-volatility quintiles, which holds volatility constant nonparametrically. A continuous distance-from-neutral version (|F&G − 50|/50) performs comparably, reinforcing that extremity, not a specific threshold, is the operative variable. The interpretation is pinned to adverse-selection logic from market microstructure: spread widening is a defensive response to the ris
What would settle it
Construct a version of the Crypto Fear & Greed Index with its volatility and momentum components removed, then recompute the volatility-quintile-stratified extreme-versus-neutral spread gap; if the premium disappears, the claim that sentiment extremity itself—rather than embedded volatility—drives liquidity withdrawal is falsified.
Extended reading notes
Core claim
This paper claims to document a previously unnamed phenomenon, the 'extremity premium': extreme values of the Crypto Fear & Greed Index—whether extreme fear or extreme greed—are associated with higher market-maker spreads than neutral readings, over and above what realized volatility predicts. The author interprets the premium as adverse selection: when the crowd commits strongly to a directional view, the risk of trading against an informed counterpart rises, so liquidity providers withdraw. The load-bearing evidence is a volatility-controlled regime effect (extreme greed +5.5, extreme fear +3.9 percentage points of uncertainty) and, in the extended sample, a 62-basis-point raw spread gap b
Load-bearing premise
The load-bearing premise is that the non-volatility components of the Crypto Fear & Greed Index drive the regime effect, and that the high-low construction shared between the index and the spread estimator does not mechanically create the association.
Editorial extensions
If this is right
- Market makers should widen quotes when sentiment is extreme in either direction, not merely when it is bullish or bearish.
- Directional sentiment alone is a weak spread predictor (correlation near 0.085), so intensity should be the primary input to liquidity provision models.
- Simple, coarse sentiment regimes may outperform more elaborate uncertainty-decomposition models because aleatoric noise dominates in crypto markets.
- The premium replicates on Ethereum and in 6 of 7 market cycles, suggesting it is a structural feature of cryptocurrency markets rather than a Bitcoin-specific artifact.
- Granger tests indicate that uncertainty predicts spreads, though the extended-sample result is acknowledged to be partly mechanical due to shared high-low inputs, with a weaker reverse channel during crises.
Reading between the lines
- A testable extension not developed in the paper: if intensity, not direction, strips liquidity, then intraday order-book spreads should widen systematically on days when the sentiment index crosses extreme thresholds, even when realized volatility is matched tick-by-tick.
- The same concept could be tested in other retail-driven markets (e.g., equity sentiment indices) where a composite score reaches extreme values while separable volatility components can be removed.
- The paper's residual-on-residual result implies that many baseline spread-uncertainty correlations may be inflated by shared volatility; an implication left implicit is that sentiment-based market-making models should use regime indicators rather than continuous scores to avoid absorbing the effect in linear controls.
- If the premium survives a volatility-free sentiment index, it would support a behavioral mechanism—conviction itself being risky—rather than a pure volatility-embedding artifact.
Editorial analysis
A structured set of objections, weighed in public.
Referee Report
Summary. The paper uses the Crypto Fear & Greed Index and daily Binance OHLCV data for Bitcoin (and ETH) to argue that sentiment extremity — extreme fear or extreme greed — predicts wider Corwin-Schultz spreads and higher uncertainty after controlling for realized volatility, an effect it calls the “extremity premium” and interprets as adverse selection. The manuscript includes an uncertainty-decomposition framework, an agent-based model, SMM calibration, and extensive robustness tests: within-volatility-quintile stratification, Granger causality, placebo tests, Monte Carlo weight robustness, LOB validation, cross-asset replication, and an extended 2018–2026 sample. The paper is unusually transparent: it explicitly labels several key tests as exploratory, concedes that the ABM spread-uncertainty link is coded rather than emergent, and acknowledges that the premium is “not conclusively separable from the F&G Index’s embedded volatility component” (Section 7) and that the extended-sample Granger test is “partly mechanical, sharing a high-low input with the spread measure” (Section 5.10.11).
Significance. If the extremity premium were cleanly identified, the paper would make a meaningful contribution to cryptocurrency market microstructure: it would show that sentiment intensity, not direction, predicts liquidity withdrawal beyond standard volatility controls, consistent with adverse-selection models. The paper has genuine strengths: public data and code, multiple spread estimators, direct order-book validation over a limited window, cross-asset replication, Monte Carlo robustness of the heuristic uncertainty weights, and a commendable level of self-criticism. However, the central quantitative claim is not supported by the pre-specified endpoint, and the main alternative explanation — that the result is driven by shared high-low/range inputs and the F&G index’s 25% volatility and 25% momentum/volume components — is explicitly conceded in the manuscript. As a result, the current version cannot support the strong claims made in the abstract and conclusions.
major comments (4)
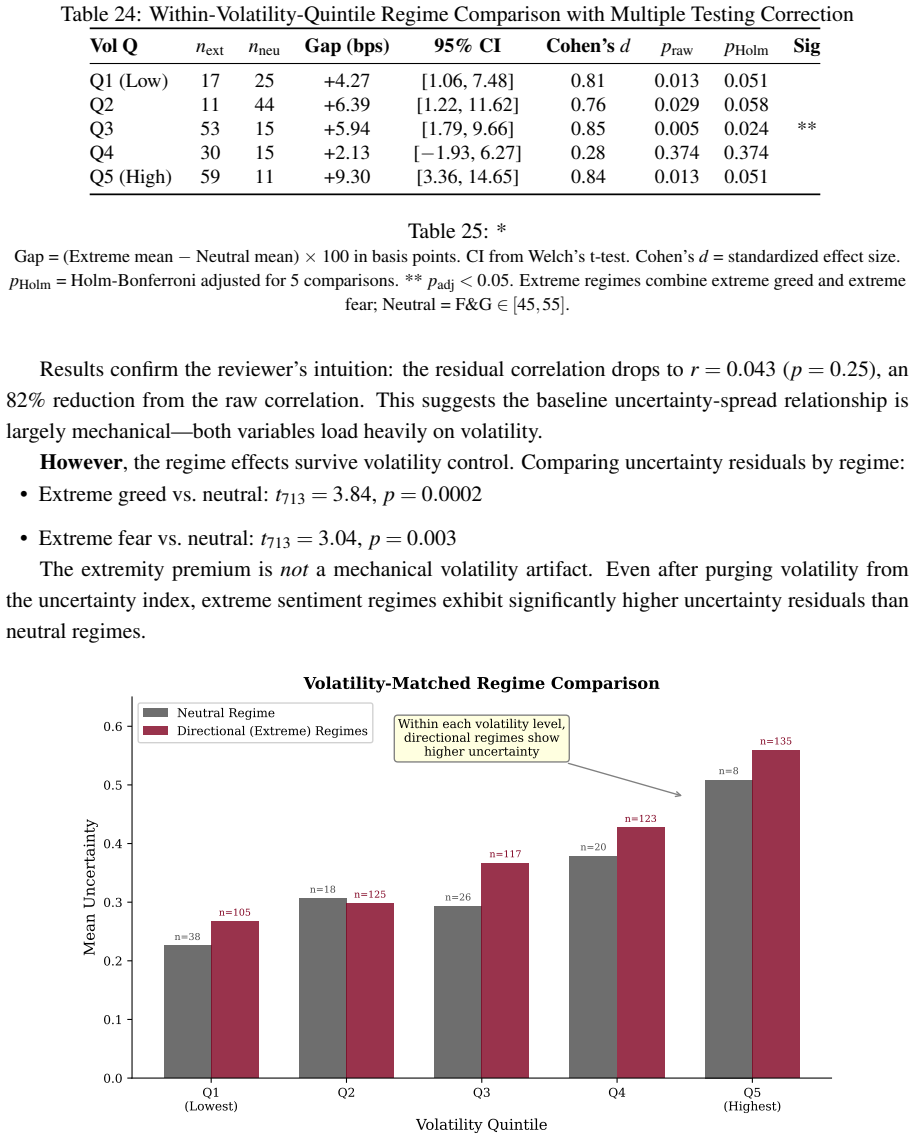
- [§5.10.3, Table 24; Abstract; §7] The pre-specified primary endpoint — the within-volatility-quintile extremity premium with multiple-testing correction — fails. After Holm-Bonferroni correction, only Quintile 3 survives (p_adj = 0.024); Q1, Q2, and Q5 have raw p ≈ 0.013–0.029 but adjust to [0.051, 0.058], and Q4 fails outright. The abstract’s headline “p < 0.001” refers not to this endpoint but to a pooled extreme-versus-neutral comparison that the paper itself labels post-hoc and exploratory (Section 7: t = 3.36, p = 0.0008, d = 0.21). The central claim is therefore not established by the analysis that was designed to test it.
- [Eq. (21); §3.1.1; §4.3; §5.10.11; §7] The “beyond realized volatility” interpretation is contaminated by a mechanical channel that the paper partially concedes. The Corwin-Schultz spread estimator is a function of two-day high-low ratios; the Parkinson volatility control uses daily high-low ranges; and the F&G index embeds 25% volatility (30/90-day ranges) and 25% momentum/volume. An extreme F&G day is therefore by construction a high-range/high-momentum day. Stratifying on daily Parkinson quintiles does not remove all shared range information, because two-day range persistence and overnight gaps can still inflate CS spreads within a quintile. The paper states that the extended-sample Granger F = 211 is “partly mechanical, sharing a high-low input with the spread measure” and that the premium cannot be “conclusively separable” from the F&G index’s embedded volatility component. Without component-level F&G data or a full-samp
- [Table 10; §5.10.4; §7] The comprehensive regression analysis contradicts the robust-premium narrative. In Table 10, Model 5 — which includes realized volatility, volatility squared, |returns|, log volume, and day/month/year fixed effects — leaves all regime coefficients insignificant (all p > 0.25). The paper’s response is to prefer nonparametric stratification because regression controls may impose the wrong functional form. But the preferred within-quintile result does not survive multiple-testing correction in the primary sample, and the extended-sample stratified test is explicitly post-hoc. A result that is significant only under post-hoc selected stratifications and insignificant under comprehensive parametric controls is not robust enough to support the abstract’s causal and directional claims.
- [Table 30; §5.10.11; §7] The extended-sample evidence does not rescue the central claim. The headline p = 2.7e-14 is a raw pooled extreme-vs-neutral gap in spreads (62 bps), not a volatility-controlled effect. The only controlled extended result is the post-hoc pooled within-quintile test (t = 3.36, p = 0.0008, d = 0.21), which is labeled exploratory. In addition, the extended-sample Granger causality is acknowledged to be partly mechanical due to the shared high-low input. Thus, the “extended validation” does not provide an independently pre-specified confirmation of the extremity premium; at most it provides a suggestive but confounded replication.
minor comments (4)
- [Abstract] The abstract simultaneously says the finding is “confirmed” and that the within-volatility-quintile endpoint is exploratory and does not survive multiple-testing correction. Please revise the abstract so that the headline claim matches the inferential status of the evidence.
- [Table 8 vs Table 6] Table 8 reports Extreme Fear as +0.039 without significance stars in Model 2, while Table 6 reports the same coefficient with ** (p < 0.01). This inconsistency should be fixed.
- [§5.10.10; §7] The Limitation section refers to “Section 5.7” for the expanding-window normalization, but the actual discussion is in Section 5.10.10. Similarly, “Section 5.8” for the ABM ablation should be Section 5.11.1. Please correct cross-references.
- [Table 5, Table 12, Table 13] The sample sizes differ across tables (N = 715, N = 739, N = 739). The text notes that Table 5 excludes 24 missing-lag observations, but the table footnotes should state this explicitly to avoid apparent inconsistencies.
Circularity Check
Part of the extremity premium and the extended-sample Granger result reduce by construction to shared high-low/volatility inputs; the paper's own caveats confirm the mechanical overlap, while the controlled pre-specified endpoint fails correction.
-
self definitional
[§3.1.1 (Index Composition and Circularity Concerns); §4.3 Eq. (21); §5.10.4; §7 (Spread Estimator Limitations)]
"A potential concern is circularity: if F&G embeds volatility, correlating F&G-based regimes with volatility-derived uncertainty may be mechanical. ... V olatility is computed from 30/90-day historical price ranges ... CS spreads mechanically embed volatility through the high-low range. Correlating CS spreads with volatility-based uncertainty proxies risks circularity."
The independent variable — extreme Fear & Greed regimes — is defined from an index whose 25% volatility and 25% momentum/volume components are range/trend functions. The dependent variable, the Corwin-Schultz spread (Eq. 21), is constructed from two-day high-low ratios, and the volatility control (Parkinson) is a daily high-low ratio. Extreme F&G days are therefore high-range days by construction, so the raw 62 bps extreme-vs-neutral spread gap and the +5.5/+3.9 'uncertainty' effects are partly the same high-low signal, not an independently measured sentiment effect. The paper's own residual-on-residual regression reduces the spread-uncertainty correlation to r=0.04, and within-quintile controls do not remove the two-day range information shared by CS and F&G.
-
other
[Abstract; §5.10.11 / Table 30]
"Granger causality runs from uncertainty to spreads (primary-sample F = 12.79; the extended-sample F = 211 is partly mechanical, sharing a high-low input with the spread measure)."
The extended-sample Granger causality result is headline evidence for the uncertainty-to-spread channel, but the extended-sample uncertainty proxy is Parkinson volatility (daily high-low) and the spread is Corwin-Schultz (two-day high-low). Both are functions of the same high-low range, so Granger-causing one with the other is partly an autoregression of a shared constructed input. The paper itself labels F = 211 'partly mechanical, sharing a high-low input with the spread measure,' meaning the strongest directional statistic is not an independent sentiment-to-spread prediction.
full rationale
The paper is unusually transparent about its main mechanical confound: it names the circularity concern for the F&G index's embedded volatility, concedes that CS spreads 'mechanically embed volatility through the high-low range,' reports that residual-on-residual correlation collapses to r = 0.04, and in the abstract flags the extended-sample Granger F = 211 as 'partly mechanical.' Those admissions are exactly the reductions that make the central 'beyond realized volatility' claim only partially identified. The raw pooled extremity premium (62 bps, p = 2.7e-14) is an extreme-vs-neutral spread gap that does not control for the shared high-low/momentum inputs; the pre-specified within-volatility-quintile endpoint fails Holm-Bonferroni correction (only Q3 survives, padj = 0.024), and the surviving extended controlled test is a post-hoc pooled within-quintile comparison. The DVOL-based regime analysis and LOB validation provide some non-circular support, and the ABM is correctly disclaimed as coded rather than emergent. Self-citations are not load-bearing. On balance, several headline results reduce partly by construction, so the score is 6 rather than 0-2; but because the paper states the mechanical overlap itself and retains some independent checks, the circularity is partial, not total.
Assumptions & free parameters
free parameters (4)
- Heuristic uncertainty weights (γ, δ) =
γ = (0.3, 0.2, 0.5); δ = (0.35, 0.15, 0.25, 0.25)
- F&G regime thresholds =
≤25 / 45-55 / >75
- SMM parameters (σ_fund, σ_noise, δ, ρ, φ) =
0.0307, 0.0190, 0.1792, 0.8480, 0.4727
- CS negative-spread truncation =
23 days set to zero
assumptions (4)
- domain assumption Fear & Greed Index composition: 25% volatility, 25% momentum/volume, 15% social media, 15% surveys, 10% BTC dominance, 10% Google Trends.
- domain assumption Corwin-Schultz two-day high-low estimator separates spread from volatility under serially independent returns.
- ad hoc to paper Quadratic combination of normalized uncertainty indices behaves like variance addition.
- standard math Linear Granger causality on daily stationary series is a valid directional test for the spread-uncertainty linkage.
Cite this review
Pith. "Pith review of The Extremity Premium: Sentiment Regimes and Adverse Selection in Cryptocurrency Markets." pith.science (2026). https://pith.science/paper/25DKBNQO
@misc{pith2026260207018,
  author       = {Pith},
  title        = {Pith review of: The Extremity Premium: Sentiment Regimes and Adverse Selection in Cryptocurrency Markets},
  year         = {2026},
  howpublished = {\url{https://pith.science/paper/25DKBNQO}},
  note         = {Machine review of arXiv:2602.07018}
}
abstract
Using the Crypto Fear & Greed Index and Bitcoin daily data, sentiment extremity predicts excess uncertainty beyond realized volatility. Extreme fear and extreme greed regimes exhibit significantly higher spreads than neutral periods -- the "extremity premium." Extended validation on the full Fear & Greed history (2018--2026, N = 2,896) confirms the finding: within-volatility-quintile comparisons show a premium ($p < 0.001$, pooled volatility-demeaned Cohen's $d = 0.21$ -- a post-hoc, exploratory test, as the pre-specified within-quintile endpoint does not survive multiple-testing correction; raw pooled extreme-vs-neutral $d = 0.40$), Granger causality runs from uncertainty to spreads (primary-sample $F = 12.79$; the extended-sample $F = 211$ is partly mechanical, sharing a high-low input with the spread measure), and placebo tests reject the null ($p < 0.0001$). The effect replicates on Ethereum and across 6 of 7 market cycles. However, the premium is sensitive to functional form: regression controls absorb regime effects, while nonparametric stratification preserves them. We interpret this as evidence that sentiment extremity captures volatility-regime interactions not fully represented by parametric controls -- consistent with, but not conclusively separable from, the F&G Index's embedded volatility component. An agent-based model is included as an illustrative device that reproduces the pattern qualitatively; because its spread-uncertainty link is coded rather than emergent, it does no inferential work (the reported moment-matching test validates a separate simplified model, not the full agent specification), and the inferential weight rests entirely on the empirical analysis. The results suggest that intensity, not direction, drives uncertainty-linked liquidity withdrawal in cryptocurrency markets, though identifying "pure" sentiment effects from volatility remains open.
Figures


Figures from the paper (2 more)

Reference graph
Works this paper leans on
-
[1]
Abdi, F., Ranaldo, A. (2017). A simple estimation of bid-ask spreads from daily close, high, and low prices. Review of Financial Studies, 30(12), 4437--4480. doi:10.1093/rfs/hhx084 https://doi.org/10.1093/rfs/hhx084
-
[2]
Adrian, T., Brunnermeier, M.K. (2016). CoVaR. American Economic Review, 106(7), 1705--1741. doi:10.1257/aer.20120555 https://doi.org/10.1257/aer.20120555
-
[3]
Antweiler, W., Frank, M.Z. (2004). Is all that talk just noise? The information content of internet stock message boards. Journal of Finance, 59(3), 1259--1294. doi:10.1111/j.1540-6261.2004.00662.x https://doi.org/10.1111/j.1540-6261.2004.00662.x
arXiv 2004
-
[4]
Avellaneda, M., Stoikov, S. (2008). High-frequency trading in a limit order book. Quantitative Finance, 8(3), 217--224. doi:10.1080/14697680701381228 https://doi.org/10.1080/14697680701381228
-
[5]
Aste, T. (2025). Information filtering networks: Theoretical foundations, generative methodologies, and real-world applications. arXiv preprint arXiv:2505.03812
arXiv 2025
-
[6]
Forer, P., Budnick, B., Vivo, P., Aufiero, S., Bartolucci, S., Caccioli, F. (2025). Financial instability transition under heterogeneous investments and portfolio diversification. arXiv preprint arXiv:2501.19260
arXiv 2025
-
[7]
Aufiero, S., Bartolucci, S., Caccioli, F., Vivo, P. (2025). Mapping microscopic and systemic risks in TradFi and DeFi : A literature review. arXiv preprint arXiv:2508.12007
arXiv 2025
-
[8]
Barucca, P., Lillo, F. (2017). Behind the price: On the role of agent's reflexivity in financial market microstructure. In Methods and Finance, Springer. doi:10.1007/978-3-319-49872-0\_3 https://doi.org/10.1007/978-3-319-49872-0_3
Show all 49 references
-
[9]
Samal, A., Pharasi, H.K., Ramaia, S.J., Kannan, H., Saucan, E., Jost, J., Chakraborti, A. (2021). Network geometry and market instability. Royal Society Open Science, 8(2), 201734. doi:10.1098/rsos.201734 https://doi.org/10.1098/rsos.201734
2021 doi
-
[10]
Chen, C., Hafner, C. (2019). Sentiment-induced bubbles in the cryptocurrency market. Journal of Risk and Financial Management, 12(2), 53. doi:10.3390/jrfm12020053 https://doi.org/10.3390/jrfm12020053
2019 doi
-
[11]
Chen, A., Nguyen, H. (2024). A new perspective on how investor sentiment affects herding behavior in the cryptocurrency market. Finance Research Letters, 67, 105737. doi:10.1016/j.frl.2024.105737 https://doi.org/10.1016/j.frl.2024.105737
2024
-
[12]
Briola, A., Bartolucci, S., Aste, T. (2025). Deep limit order book forecasting: A microstructural guide. Quantitative Finance, 25(7), 1101--1131. doi:10.1080/14697688.2025.2522911 https://doi.org/10.1080/14697688.2025.2522911
2025
-
[13]
Briola, A., Bartolucci, S., Aste, T. (2025). HLOB---information persistence and structure in limit order books. Expert Systems with Applications, 266, 126078. doi:10.1016/j.eswa.2024.126078 https://doi.org/10.1016/j.eswa.2024.126078
2025
-
[14]
Bourghelle, D., Jawadi, F., Rozin, P. (2022). Do collective emotions drive bitcoin volatility? A triple regime-switching vector approach. Journal of Economic Behavior & Organization, 196, 294--306. doi:10.1016/j.jebo.2022.01.026 https://doi.org/10.1016/j.jebo.2022.01.026
2022 doi
-
[15]
Bouri, E., Molnár, P., Azzi, G., Roubaud, D., Hagfors, L.I. (2017). On the hedge and safe haven properties of Bitcoin. Finance Research Letters, 20, 192--198. doi:10.1016/j.frl.2016.09.025 https://doi.org/10.1016/j.frl.2016.09.025
2017 doi
-
[16]
Cont, R. (2001). Empirical properties of asset returns: Stylized facts and statistical issues. Quantitative Finance, 1(2), 223--236. doi:10.1080/713665670 https://doi.org/10.1080/713665670
2001 doi
-
[17]
Corwin, S.A., Schultz, P. (2012). A simple way to estimate bid-ask spreads from daily high and low prices. Journal of Finance, 67(2), 719--760. doi:10.1111/j.1540-6261.2012.01729.x https://doi.org/10.1111/j.1540-6261.2012.01729.x
2012
-
[18]
Cont, R., Stoikov, S., Talreja, R. (2010). A stochastic model for order book dynamics. Operations Research, 58(3), 549--563. doi:10.1287/opre.1090.0780 https://doi.org/10.1287/opre.1090.0780
2010
-
[19]
Dias, I., Fernando, J., Fernando, P. (2022). Does investor sentiment predict bitcoin return and volatility? A quantile regression approach. International Review of Financial Analysis, 84, 102383. doi:10.1016/j.irfa.2022.102383 https://doi.org/10.1016/j.irfa.2022.102383
2022
-
[20]
del Rio-Chanona, R.M., Mealy, P., Beguerisse-Diaz, M., Lafond, F., Farmer, J.D. (2021). Occupational mobility and automation: A data-driven network model. Journal of the Royal Society Interface, 18(174), 20200898. doi:10.1098/rsif.2020.0898 https://doi.org/10.1098/rsif.2020.0898
2021
-
[21]
del Rio-Chanona, R.M., Pangallo, M., et al. (2025). Can generative AI agents behave like humans? Evidence from laboratory market experiments. arXiv preprint arXiv:2505.07457
2025 arXiv
-
[22]
Farzulla, M. (2025). Infrastructure vs regulatory shocks: Asymmetric volatility response in cryptocurrency markets. Research Square. doi:10.21203/rs.3.rs-8323026/v1 https://doi.org/10.21203/rs.3.rs-8323026/v1
2025 doi
-
[23]
Farzulla, M., Maksakov, A. (2025). ASRI: An aggregated systemic risk index for cryptocurrency markets. arXiv preprint arXiv:2602.03874
2025 arXiv
-
[24]
Farzulla, M. (2025). Do whitepaper claims predict market behavior? Evidence from cryptocurrency factor analysis. arXiv preprint arXiv:2601.20336
2025 arXiv
- [25]
-
[26]
Farmer, J.D. (2025). Quantitative agent-based models: A promising alternative for macroeconomics. Oxford Review of Economic Policy. doi:10.1093/oxrep/graf027 https://doi.org/10.1093/oxrep/graf027
2025 doi
-
[27]
Gal, Y., Ghahramani, Z. (2016). Dropout as a Bayesian approximation: Representing model uncertainty in deep learning. In ICML
2016
-
[28]
Gurdgiev, C., O'Loughlin, D. (2020). Herding and anchoring in cryptocurrency markets: Investor reaction to fear and uncertainty. SSRN Electronic Journal. doi:10.2139/ssrn.3517006 https://doi.org/10.2139/ssrn.3517006
2020 doi
-
[29]
Grazzini, J., Richiardi, M. (2015). Estimation of ergodic agent-based models by simulated minimum distance. Journal of Economic Dynamics and Control, 51, 148--165. doi:10.1016/j.jedc.2014.10.006 https://doi.org/10.1016/j.jedc.2014.10.006
2015 doi
-
[30]
Glosten, L.R., Milgrom, P.R. (1985). Bid, ask and transaction prices in a specialist market with heterogeneously informed traders. Journal of Financial Economics, 14(1), 71--100. doi:10.1016/0304-405X(85)90044-3 https://doi.org/10.1016/0304-405X(85)90044-3
1985 doi
-
[31]
Golub, A., Keane, J., Poon, S.H. (2012). High frequency trading and mini flash crashes. Working paper
2012
-
[32]
Gudgeon, L., Perez, D., Harz, D., Livshits, B., Gervais, A. (2020). The decentralized financial crisis. In Crypto Valley Conference
2020
-
[33]
Jia, B., Shen, D., Zhang, W. (2022). Extreme sentiment and herding: Evidence from the cryptocurrency market. Research in International Business and Finance, 63, 101770. doi:10.1016/j.ribaf.2022.101770 https://doi.org/10.1016/j.ribaf.2022.101770
2022
-
[34]
Kendall, A., Gal, Y. (2017). What uncertainties do we need in Bayesian deep learning for computer vision? In NeurIPS
2017
-
[35]
Koutmos, D. (2022). Investor sentiment and bitcoin prices. Review of Quantitative Finance and Accounting, 60, 1--29. doi:10.1007/s11156-022-01086-4 https://doi.org/10.1007/s11156-022-01086-4
2022 doi
-
[36]
Kyriazis, N., Papadamou, S., Tzeremes, P., Corbet, S. (2022). The differential influence of social media sentiment on cryptocurrency returns and volatility during COVID-19. Quarterly Review of Economics and Finance, 89, 307--317. doi:10.1016/j.qref.2022.09.004 https://doi.org/...
2022 doi
-
[37]
Kyle, A.S. (1985). Continuous auctions and insider trading. Econometrica, 53(6), 1315--1335. doi:10.2307/1913210 https://doi.org/10.2307/1913210
1985 doi
-
[38]
LeBaron, B. (2006). Agent-based computational finance. In Handbook of Computational Economics, vol.\ 2, pp.\ 1187--1233
2006
-
[39]
Loughran, T., McDonald, B. (2011). When is a liability not a liability? Textual analysis, dictionaries, and 10-Ks. Journal of Finance, 66(1), 35--65. doi:10.1111/j.1540-6261.2010.01625.x https://doi.org/10.1111/j.1540-6261.2010.01625.x
2011
-
[40]
Naeem, M., Mbarki, I., Shahzad, S. (2021). Predictive role of online investor sentiment for cryptocurrency market: Evidence from happiness and fears. International Review of Economics & Finance, 73, 496--514. doi:10.1016/j.iref.2021.01.008 https://doi.org/10.1016/j.iref.2021.01.008
2021 doi
-
[41]
Makarov, I., Schoar, A. (2020). Trading and arbitrage in cryptocurrency markets. Journal of Financial Economics, 135(2), 293--319. doi:10.1016/j.jfineco.2019.07.001 https://doi.org/10.1016/j.jfineco.2019.07.001
2020 doi
-
[42]
Paddrik, M., Hayes, R., Todd, A., Yang, S., Scherer, W., Beling, P. (2012). An agent based model of the E-Mini S&P 500 applied to flash crash analysis. In IEEE CIFER. doi:10.1109/CIFEr.2012.6327800 https://doi.org/10.1109/CIFEr.2012.6327800
2012
-
[43]
Palmer, R.G., Arthur, W.B., Holland, J.H., LeBaron, B., Tayler, P. (1994). Artificial economic life: A simple model of a stockmarket. Physica D, 75(1-3), 264--274. doi:10.1016/0167-2789(94)90287-9 https://doi.org/10.1016/0167-2789(94)90287-9
1994 doi
-
[44]
Popoyan, L., Napoletano, M., Roventini, A. (2020). Winter is possibly not coming: Mitigating financial instability in an agent-based model with interbank market. Journal of Economic Dynamics and Control, 117, 103937. doi:10.1016/j.jedc.2020.103937 https://doi.org/10.1016/j.jed...
2020
-
[45]
Rognone, L., Hyde, S., Zhang, S. (2020). News sentiment in the cryptocurrency market: An empirical comparison with Forex. International Review of Financial Analysis, 69, 101462. doi:10.1016/j.irfa.2020.101462 https://doi.org/10.1016/j.irfa.2020.101462
2020
-
[46]
Roll, R. (1984). A simple implicit measure of the effective bid-ask spread in an efficient market. Journal of Finance, 39(4), 1127--1139. doi:10.1111/j.1540-6261.1984.tb03897.x https://doi.org/10.1111/j.1540-6261.1984.tb03897.x
1984
-
[47]
Tetlock, P.C. (2007). Giving content to investor sentiment: The role of media in the stock market. Journal of Finance, 62(3), 1139--1168. doi:10.1111/j.1540-6261.2007.01232.x https://doi.org/10.1111/j.1540-6261.2007.01232.x
2007
-
[48]
Pangallo, M., del Rio-Chanona, R.M. (2024). Data-driven economic agent-based models. arXiv preprint arXiv:2412.16591. Forthcoming in SFI Press
2024 arXiv
-
[49]
Bednar, J., del Rio-Chanona, R.M., Farmer, J.D., Kaszowska-Mojsa, J., Lafond, F., Mealy, P., Pangallo, M., Pichler, A. (2025). Complex systems approaches to 21st century challenges: Introduction to the special issue. Journal of Economic Behavior & Organization, 235, 107049. do...
2025
Reviewed August 3, 2026 · model on record in the stance chip above.
Discussion (0). Continue with ORCID to comment.