Recognition: 2 theorem links
· Lean TheoremA systematic study of AGN feedback in a disk galaxy using MACER II: predictions of X-ray surface brightness profiles and comparison with eROSITA observations
Pith reviewed 2026-05-15 00:24 UTC · model grok-4.3
The pith
AGN feedback simulation produces X-ray surface brightness profiles that match eROSITA stacked observations out to 100 kpc without parameter adjustments.
A machine-rendered reading of the paper's core claim, the machinery that carries it, and where it could break.
Core claim
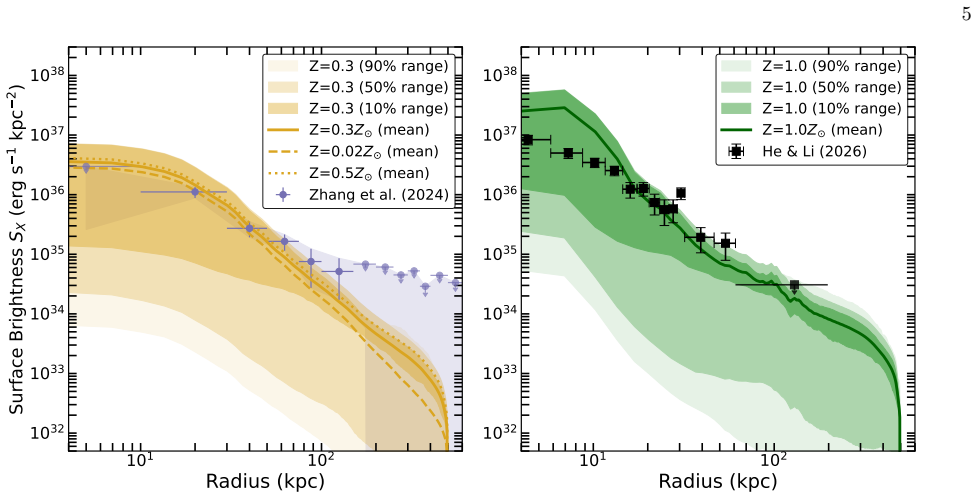
The central claim is that the average X-ray surface brightness profile from the MACER AGN feedback simulation of a disk galaxy matches the stacked eROSITA measurements of circumgalactic medium emission for galaxies with log stellar mass 10.5-11.0 at z ~ 0.02-0.10 out to ~100 kpc, and also matches the stacked profiles for nearby L* galaxies from ~20 kpc to 120 kpc. The calculation uses simulation data without retuning any parameters and assumes only thermal bremsstrahlung and line emission.
What carries the argument
The MACER simulation of AGN feedback, which sets the density and temperature distribution of hot gas in the galactic halo and thereby determines the radial profile of thermal X-ray emissivity.
If this is right
- The AGN feedback implementation regulates halo gas in a way that reproduces the radial X-ray brightness seen in eROSITA stacks.
- Thermal emission from the simulated circumgalactic gas is sufficient to explain the observed profiles in the compared radial ranges.
- The same untuned simulation can generate consistent predictions for other CGM observables such as gas fractions or star formation correlations.
- Constraints from X-ray data support the modeled balance between black hole accretion and galaxy gas content.
Where Pith is reading between the lines
- Higher-resolution X-ray data at radii below 20 kpc could test whether the inner profile shape remains consistent or requires additional physics.
- At radii beyond 120 kpc, where thermal emission weakens, non-thermal components such as cosmic rays could become detectable and alter the total brightness.
- Applying the same simulation setup to galaxies of different masses or morphologies would show whether the X-ray match is specific to disk galaxies or more general.
Load-bearing premise
The MACER simulation accurately captures the thermal gas properties in the halo from its AGN feedback prescription, and thermal emission alone explains the observed X-ray signal.
What would settle it
A new stacked eROSITA profile for galaxies in the same mass range that shows X-ray surface brightness at 50 kpc differing significantly from the simulated time-averaged value would falsify the reported agreement.
Figures


read the original abstract
Recently, we have performed a systematic study of AGN feedback in a disk galaxy within the MACER framework. Various model predictions, including the AGN duty cycle, the correlation between black hole accretion rates and star formation rates, and the (cold) gas fraction, have been compared with observations and will be presented in a series of papers. As the second paper in this series, without adjusting any model parameters, we directly use the simulation data introduced in Paper I to compute the predicted X-ray surface brightness profile and compare it with eROSITA observations of circumgalactic medium (CGM) emission around galaxies, which provide important constraints on AGN feedback models. For this comparison, we adopt two stacked eROSITA radial profiles of X-ray surface brightness: (1) distant galaxies with log(M*/M_sun) = 10.5-11.0 at z ~ 0.02-0.10 from Y. Zhang et al. (2024), and (2) nearby L* galaxies within 50 Mpc from L. He and Z. Li (2026). We find that the average simulated profile over time is in good agreement with the stacked measurements of Y. Zhang et al. (2024) over a broad radial range (out to ~100 kpc). Our model predictions also match the results of L. He and Z. Li (2026) at projected radii from ~20 kpc to 120 kpc. While our simulations, which predict only thermal emission, are consistent with these recent X-ray observations, the limitations in our current model mean that this agreement does not preclude a potential contribution from non-thermal emission, for example, from an extended halo of cosmic rays.
Editorial analysis
A structured set of objections, weighed in public.
Referee Report
Summary. This paper, the second in a series, uses simulation data from the MACER framework (Paper I) without any parameter adjustments to compute predicted X-ray surface brightness profiles of the circumgalactic medium (CGM) in a disk galaxy. These predictions are compared to two sets of stacked eROSITA observations: distant galaxies from Y. Zhang et al. (2024) and nearby L* galaxies from L. He and Z. Li (2026). The authors report that the time-averaged simulated profile agrees well with the observations over a broad radial range, out to approximately 100 kpc for the first dataset and from 20 to 120 kpc for the second, while noting that only thermal emission is modeled.
Significance. This study offers an important test of AGN feedback models by providing direct, untuned predictions for X-ray emission from the CGM that can be compared to observations. If the simulation's gas properties are accurate, the agreement strengthens confidence in the MACER model's ability to describe AGN feedback effects on galactic scales. The work highlights the potential of eROSITA data for constraining feedback models but correctly cautions about possible non-thermal contributions.
major comments (2)
- [Methods for X-ray profile computation] The description of how the X-ray surface brightness profiles are derived from the simulation outputs is insufficiently detailed. Specifically, the projection along the line of sight, the calculation of thermal emissivity ∫ n_e² Λ(T,Z) dl, the procedure for time-averaging over simulation snapshots, and the treatment of uncertainties are not fully specified. These details are load-bearing for evaluating the claimed quantitative agreement with eROSITA profiles.
- [Comparison with observations and validation] The central claim depends on the simulated CGM gas density and temperature profiles being realistic, yet there is no direct validation of n_e(r) and T(r) against independent CGM probes such as UV absorption lines, O VI, or Sunyaev-Zeldovich effect measurements. The X-ray surface brightness match alone does not exclude compensating errors between density normalization and the temperature-dependent cooling function.
minor comments (1)
- [Abstract] The abstract could more explicitly state the radial range of agreement for both observational datasets to improve clarity.
Simulated Author's Rebuttal
We thank the referee for the careful and constructive review of our manuscript. We address each major comment below and will revise the paper to improve clarity and acknowledge limitations where appropriate.
read point-by-point responses
-
Referee: [Methods for X-ray profile computation] The description of how the X-ray surface brightness profiles are derived from the simulation outputs is insufficiently detailed. Specifically, the projection along the line of sight, the calculation of thermal emissivity ∫ n_e² Λ(T,Z) dl, the procedure for time-averaging over simulation snapshots, and the treatment of uncertainties are not fully specified. These details are load-bearing for evaluating the claimed quantitative agreement with eROSITA profiles.
Authors: We agree that the methods section requires greater detail for reproducibility. In the revised manuscript we will expand the relevant section to explicitly describe the line-of-sight projection, the computation of thermal emissivity as the integral ∫ n_e² Λ(T,Z) dl, the time-averaging procedure across simulation snapshots, and the estimation of uncertainties. These additions will allow readers to fully assess the quantitative comparison. revision: yes
-
Referee: [Comparison with observations and validation] The central claim depends on the simulated CGM gas density and temperature profiles being realistic, yet there is no direct validation of n_e(r) and T(r) against independent CGM probes such as UV absorption lines, O VI, or Sunyaev-Zeldovich effect measurements. The X-ray surface brightness match alone does not exclude compensating errors between density normalization and the temperature-dependent cooling function.
Authors: We acknowledge the validity of this concern. The present work provides an untuned prediction from the MACER simulation and compares it directly to X-ray data; however, we agree that agreement in surface brightness alone cannot rule out compensating errors in density and temperature. Paper I of the series contains comparisons for other galaxy properties, but we will add an explicit discussion of this limitation in the revised manuscript, noting the value of future comparisons with UV absorption and SZ measurements. We will qualify our conclusions accordingly while maintaining that the X-ray match still constitutes a meaningful consistency test of the feedback model. revision: partial
Circularity Check
No significant circularity: X-ray profiles computed from prior simulation and compared to external data
full rationale
The paper takes simulation outputs from Paper I (MACER framework) without retuning parameters, computes the thermal X-ray surface brightness profile via standard projection of n_e and T, and compares the result to stacked eROSITA profiles reported in Zhang et al. (2024) and He & Li (2026). No equation or step defines the predicted profile in terms of the target observations; the simulation gas properties are independent inputs. Overlapping authorship on the observation papers does not create a self-referential loop because the eROSITA stacking analysis is external data, not derived from the present simulation. The agreement is therefore a genuine out-of-sample test rather than a tautology.
Axiom & Free-Parameter Ledger
axioms (1)
- domain assumption The MACER simulation framework from Paper I accurately models AGN feedback and the resulting thermal gas properties in a disk galaxy.
Lean theorems connected to this paper
-
IndisputableMonolith/Foundation/RealityFromDistinction.leanreality_from_one_distinction unclear?
unclearRelation between the paper passage and the cited Recognition theorem.
The simulations are performed within the MACER framework ... AGN outputs—namely radiation, wind, and jet—are prescribed based on accretion theory ... injected at the inner boundary
What do these tags mean?
- matches
- The paper's claim is directly supported by a theorem in the formal canon.
- supports
- The theorem supports part of the paper's argument, but the paper may add assumptions or extra steps.
- extends
- The paper goes beyond the formal theorem; the theorem is a base layer rather than the whole result.
- uses
- The paper appears to rely on the theorem as machinery.
- contradicts
- The paper's claim conflicts with a theorem or certificate in the canon.
- unclear
- Pith found a possible connection, but the passage is too broad, indirect, or ambiguous to say the theorem truly supports the claim.
Reference graph
Works this paper leans on
-
[1]
E., Churazov, E., & Bregman, J
Anderson, M. E., Churazov, E., & Bregman, J. N. 2016, MNRAS, 455, 227, doi: 10.1093/mnras/stv2314
-
[2]
Bregman, J. N., Anderson, M. E., Miller, M. J., et al. 2018, ApJ, 862, 3, doi: 10.3847/1538-4357/aacafe
-
[3]
N., Hodges-Kluck, E., Qu, Z., et al
Bregman, J. N., Hodges-Kluck, E., Qu, Z., et al. 2022, The Astrophysical Journal, 928, 14
work page 2022
-
[4]
Chadayammuri, U., Bogd´ an,´A., Oppenheimer, B. D., & et al. 2022, ApJ, 936, L15, doi: 10.3847/2041-8213/ac8936
-
[5]
Chen, H.-W., & Zahedy, F. S. 2026, in Encyclopedia of
work page 2026
-
[6]
4, 370–400, doi: 10.1016/B978-0-443-21439-4.00059-6
Astrophysics, Vol. 4, 370–400, doi: 10.1016/B978-0-443-21439-4.00059-6
-
[7]
2022, A&A, 666, A156, doi: 10.1051/0004-6361/202243101
Comparat, J., Truong, N., Merloni, A., & et al. 2022, A&A, 666, A156, doi: 10.1051/0004-6361/202243101
-
[8]
Schaye, J. 2010, MNRAS, 407, 1403, doi: 10.1111/j.1365-2966.2010.16985.x
-
[9]
2025, The Astrophysical Journal, 991, 205
Das, S., Truong, N., Chiang, Y.-K., & Mathur, S. 2025, The Astrophysical Journal, 991, 205
work page 2025
-
[10]
Dave, R., Finlator, K., & Oppenheimer, B. D. 2012, MNRAS, 421, 98, doi: 10.1111/j.1365-2966.2011.20148.x
-
[11]
2009, Nature, 457, 451, doi: 10.1038/nature07648
Dekel, A., Birnboim, Y., Engel, G., et al. 2009, Nature, 457, 451, doi: 10.1038/nature07648
work page internal anchor Pith review doi:10.1038/nature07648 2009
-
[12]
Gofford, J., Reeves, J. N., McLaughlin, D. E., et al. 2015, MNRAS, 451, 4169, doi: 10.1093/mnras/stv1207
-
[13]
2025, arXiv e-prints, arXiv:2506.09123, doi: 10.48550/arXiv.2506.09123
Grayson, S., Scannapieco, E., Comparat, J., et al. 2025, arXiv e-prints, arXiv:2506.09123, doi: 10.48550/arXiv.2506.09123
-
[14]
Solving the cooling flow problem with combined jet-wind AGN feedback
He, A., Guo, M., Yuan, F., et al. 2025, arXiv e-prints, arXiv:2511.02796, doi: 10.48550/arXiv.2511.02796
work page internal anchor Pith review Pith/arXiv arXiv doi:10.48550/arxiv.2511.02796 2025
-
[15]
2026, arXiv e-prints, arXiv:2601.16499, doi: 10.48550/arXiv.2601.16499
He, L., & Li, Z. 2026, arXiv e-prints, arXiv:2601.16499, doi: 10.48550/arXiv.2601.16499
-
[16]
Hopkins, P. F., Quataert, E., & Murray, N. 2012, Monthly Notices of the Royal Astronomical Society, 421, 3522, doi: 10.1111/j.1365-2966.2012.20593.x
-
[17]
T., Nagai, D., Bogd´ an,´A., et al
Lau, E. T., Nagai, D., Bogd´ an,´A., et al. 2025, The Astrophysical Journal, 984, 190, doi: 10.3847/1538-4357/adc450
-
[18]
Li, J.-T., & Wang, Q. D. 2013, MNRAS, 428, 2085, doi: 10.1093/mnras/sts183
-
[19]
Merloni, A., Lamer, G., Liu, T., et al. 2024, A&A, 682, A34, doi: 10.1051/0004-6361/202347165
work page internal anchor Pith review doi:10.1051/0004-6361/202347165 2024
-
[20]
Greene, J. E. 2023, The Astronomical Journal, 167, 31, doi: 10.3847/1538-3881/acf7bc
-
[21]
Ponnada, S. B., Hopkins, P. F., Lu, Y. S., et al. 2026, The Astrophysical Journal Letters, 997, L13, doi: 10.3847/2041-8213/ae2fd9
-
[22]
2025, A&A, 704, A278, doi: 10.1051/0004-6361/202453255
Popesso, P., Marini, I., Dolag, K., et al. 2025, A&A, 704, A278, doi: 10.1051/0004-6361/202453255
-
[23]
2021, A&A, 647, A1, doi: 10.1051/0004-6361/202039313
Predehl, P., Andritschke, R., Arefiev, V., et al. 2021, A&A, 647, A1, doi: 10.1051/0004-6361/202039313
-
[24]
Prochaska, J. X., Werk, J. K., Worseck, G., et al. 2017, ApJ, 837, 169, doi: 10.3847/1538-4357/aa6007
-
[25]
2025, arXiv e-prints, arXiv:2504.03840, doi: 10.48550/arXiv.2504.03840
Shreeram, S., Comparat, J., Merloni, A., et al. 2025, arXiv e-prints, arXiv:2504.03840, doi: 10.48550/arXiv.2504.03840
-
[26]
2018, ApJ, 867, 73, doi: 10.3847/1538-4357/aae43a
Sokolowska, A., Babul, A., Mayer, L., Shen, S., & Madau, P. 2018, ApJ, 867, 73, doi: 10.3847/1538-4357/aae43a
-
[27]
1956, ApJ, 124, 20, doi: 10.1086/146200
Spitzer, L. 1956, ApJ, 124, 20, doi: 10.1086/146200
-
[28]
Springel, V., di Matteo, T., & Hernquist, L. 2005, Monthly Notices of the Royal Astronomical Society, 361, 776, doi: 10.1111/j.1365-2966.2005.09238.x
-
[29]
Hoopes, C. G., & Weaver, K. A. 2004, ApJ, 606, 829, doi: 10.1086/383136
-
[30]
2020, MNRAS, 494, 549, doi: 10.1093/mnras/staa685
Truong, N., Pillepich, A., Werner, N., et al. 2020, MNRAS, 494, 549, doi: 10.1093/mnras/staa685
-
[31]
Dettmar, R. J. 2006, A&A, 448, 43, doi: 10.1051/0004-6361:20052936
-
[32]
D., Li, J., Jiang, X., & Fang, T
Wang, Q. D., Li, J., Jiang, X., & Fang, T. 2016, MNRAS, 457, 1385, doi: 10.1093/mnras/stv2886
-
[33]
Wechsler, R. H., & Tinker, J. L. 2018, ARA&A, 56, 435, doi: 10.1146/annurev-astro-081817-051756
work page internal anchor Pith review doi:10.1146/annurev-astro-081817-051756 2018
-
[34]
Werk, J. K., Prochaska, J. X., Tumlinson, J., et al. 2014, ApJ, 792, 8, doi: 10.1088/0004-637X/792/1/8
-
[35]
White, S. D. M., & Frenk, C. S. 1991, ApJ, 379, 52, doi: 10.1086/170483
-
[36]
White, S. D. M., & Rees, M. J. 1978, MNRAS, 183, 341, doi: 10.1093/mnras/183.3.341
-
[37]
Yang, H., Yuan, F., Yuan, Y.-F., & White, C. J. 2021, ApJ, 914, 131, doi: 10.3847/1538-4357/abfe63 12
-
[38]
2018, ApJ, 857, 121, doi: 10.3847/1538-4357/aab8f8
Yuan, F., Yoon, D., Li, Y.-P., et al. 2018, ApJ, 857, 121, doi: 10.3847/1538-4357/aab8f8
-
[39]
2024, A&A, 690, A267, doi: 10.1051/0004-6361/202449412
Zhang, Y., Comparat, J., Ponti, G., & et al. 2024, A&A, 690, A267, doi: 10.1051/0004-6361/202449412
-
[40]
2025, arXiv e-prints, arXiv:2511.17313, doi: 10.48550/arXiv.2511.17313
Zhang, Y., Shreeram, S., Ponti, G., et al. 2025, arXiv e-prints, arXiv:2511.17313, doi: 10.48550/arXiv.2511.17313
-
[41]
2025, The Astrophysical Journal, 991, 170, doi: 10.3847/1538-4357/ae019f
Zhang, Z., Zhang, X., Li, H., et al. 2025, The Astrophysical Journal, 991, 170, doi: 10.3847/1538-4357/ae019f
-
[42]
2026, A&A, 706, A102, doi: 10.1051/0004-6361/202556835
Zhang, Yi, Shreeram, Soumya, Ponti, Gabriele, et al. 2026, A&A, 706, A102, doi: 10.1051/0004-6361/202556835
-
[43]
Zhu, B., Springel, V., & Yuan, F. 2026, arXiv e-prints, arXiv:2603.15235, doi: 10.48550/arXiv.2603.15235
work page internal anchor Pith review Pith/arXiv arXiv doi:10.48550/arxiv.2603.15235 2026
-
[44]
2026, The Astrophysical Journal, 1000, 41, doi: 10.3847/1538-4357/ae47fe
Zou, Y., Yuan, F., Ji, S., et al. 2026, The Astrophysical Journal, 1000, 41, doi: 10.3847/1538-4357/ae47fe
discussion (0)
Sign in with ORCID, Apple, or X to comment. Anyone can read and Pith papers without signing in.