The shortest detected intra-day variability of active galactic nuclei in TESS survey
Pith reviewed 2026-05-14 23:58 UTC · model grok-4.3
The pith
TESS data show the shortest AGN variability timescales correspond to light crossing times across regions of only a few to thousands of gravitational radii.
A machine-rendered reading of the paper's core claim, the machinery that carries it, and where it could break.
Core claim
The central claim is that the upper limits of the shortest variability timescale are log(t_min,ul/hrs)=0.85±0.55, naturally interpreted as the light crossing scale from a coherently varying region where the measured t_min,ul corresponds to the range from a few to thousands of gravitational radii, smaller than accretion disk emission sizes.
What carries the argument
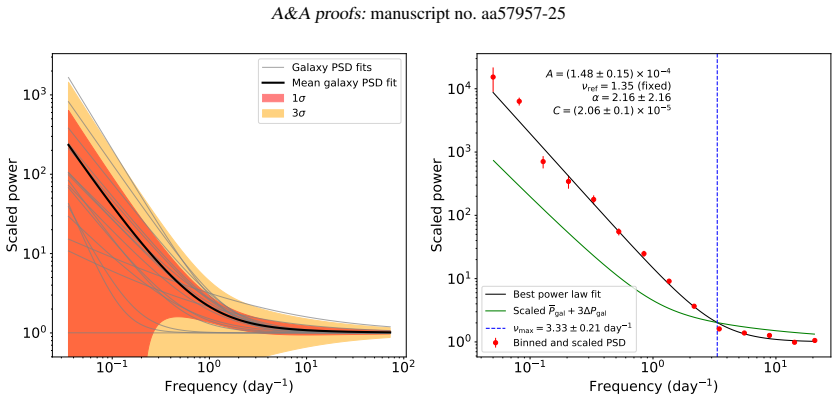
The power spectral density modeled as a power law plus constant noise, with the shortest timescale upper limit defined as the point where the power law exceeds the constant noise and the upper limits from non-variable quiescent galaxies.
If this is right
- The PSD power law index is measured to be 2.0±0.2 with weak anticorrelations to black hole mass and luminosity.
- A significant fraction of the light crossing scales are smaller than accretion disk sizes from quasar microlensing, reverberation mapping, or theoretical models.
- The shortest optical variability is suggested to be driven by a compact region smaller than the accretion disk, potentially via X-ray reprocessing.
- The accretion disk may be inhomogeneous due to turbulence from magnetorotational instability or magnetic reconnections.
- Since only upper limits are measured, the true shortest variability timescales are even shorter.
Where Pith is reading between the lines
- Higher cadence observations could probe even shorter timescales to test the light crossing interpretation directly.
- The findings challenge standard uniform accretion disk models by requiring substructures on small scales.
- This approach of using PSD break points could be extended to other variable sources to map their smallest emitting regions.
- If confirmed, it would imply that intra-day optical variability originates from scales comparable to the event horizon vicinity in many cases.
Load-bearing premise
That the point where the fitted power-law PSD exceeds the constant noise plus the upper limits from non-variable quiescent galaxies' PSDs accurately isolates the true shortest AGN variability timescale without residual systematics or model mismatch.
What would settle it
Detecting coherent variability on timescales much shorter than the reported upper limits in the TESS light curves of these Seyfert galaxies or finding that the PSDs remain consistent with noise down to those scales would falsify the interpretation.
Figures


read the original abstract
AGNs are known to be variable in almost all wavelengths and timescales. The shortest variability timescale of AGNs can be used to probe the smallest scale structures within AGNs. We aim to measure the shortest detected variability timescale, $t_{min,ul}$, of type 1 radio-quiet Seyfert galaxies and analyse their characteristics. We extracted TESS light curves of 47 Seyfert 1 galaxies. We measured the PSDs of the sample, modelled by a power law model plus a constant noise, and constrained the shortest detected AGN variability timescale as the power law component exceeds the constant noise and systematic uncertainties indicated by the upper limits of non-variable quiescent galaxies' PSDs. We measured the upper limits of the shortest variability timescale to be $\log(t_{min,ul}/hrs)=0.85\pm0.55$. We compared these upper limits to a range of theoretical AGN variability timescales, and the natural interpretation of our measured $t_{min,ul}$ is the light crossing scale from a coherently varying region, where the measured $t_{min,ul}$ corresponds to the range from a few to thousands of gravitational radii. A significant fraction of these light crossing scales is smaller than the accretion disk emission sizes measured by quasar microlensing, reverberation mapping, or theoretical accretion disk models. Since we only measure the upper limits, the true physical shortest variability timescales are even shorter. We measure the power law index to be $2.0\pm0.2$, and find weak anticorrelations with the black hole mass and luminosity. Our analysis suggests that the shortest optical variability is driven by a compact region smaller than the accretion disk size, potentially by X-ray reprocessing. Alternatively, this shortest timescale variability suggests that the accretion disk can be inhomogeneous potentially caused by turbulence from magnetorotational instability or magnetic reconnections. (abridged)
Editorial analysis
A structured set of objections, weighed in public.
Referee Report
Summary. The paper extracts TESS light curves for 47 type-1 radio-quiet Seyfert galaxies and computes their power spectral densities (PSDs). Each PSD is fit with a single power-law plus constant white-noise model; the shortest variability timescale t_min,ul is defined as the frequency at which the fitted power-law component exceeds both the constant noise floor and the upper envelope of PSDs measured from non-variable quiescent galaxies. The authors report a sample-averaged upper limit log(t_min,ul/hrs) = 0.85 ± 0.55, interpret this scale as the light-crossing time of a coherently varying region spanning a few to thousands of gravitational radii, and note that a substantial fraction of these scales lie below standard accretion-disk sizes inferred from microlensing, reverberation mapping, and thin-disk theory. They additionally measure a mean PSD slope of 2.0 ± 0.2 and report weak anticorrelations between t_min,ul and both black-hole mass and luminosity, suggesting the shortest optical variability arises either from X-ray reprocessing in a compact region or from inhomogeneities within the disk itself.
Significance. If the reported t_min,ul measurement and its light-crossing interpretation survive detailed validation, the result supplies a new observational anchor on the smallest spatial scales of optical AGN variability. The use of a uniform TESS sample of 47 objects to place a statistical upper limit on intra-day timescales is a clear advance over earlier single-object or ground-based studies. The finding that many of these scales are smaller than canonical disk sizes directly challenges homogeneous thin-disk models and motivates further work on reprocessing geometries or disk turbulence. The reported PSD index and its mass/luminosity trends are also useful benchmarks for future simulations.
major comments (3)
- [Methods / PSD modelling] Methods, PSD fitting procedure: the central definition of t_min,ul as the crossing frequency between the fitted power-law and the sum of the constant noise plus the quiescent-galaxy upper envelope is load-bearing for the headline result, yet the manuscript provides no goodness-of-fit diagnostics (χ², residuals, or posterior predictive checks), no comparison to alternative models (broken power-law, damped random walk), and no injection-recovery tests on simulated light curves that include realistic TESS sampling and red-noise leakage. Without these, it is unclear whether the reported crossing frequency (and therefore log(t_min,ul/hrs) = 0.85 ± 0.55) is robust or systematically shifted by model mismatch.
- [Methods / Data and sample selection] Methods, sample construction and systematic control: the upper envelope from non-variable quiescent galaxies is used to bound all non-AGN contributions, but the text does not specify the exact selection criteria for these galaxies, the number used, how the envelope is constructed (median, percentile, etc.), or any explicit test that residual TESS window-function artifacts or spacecraft systematics are fully captured. Any underestimation of the systematic floor directly raises the reported crossing frequency and shrinks the inferred range of gravitational radii.
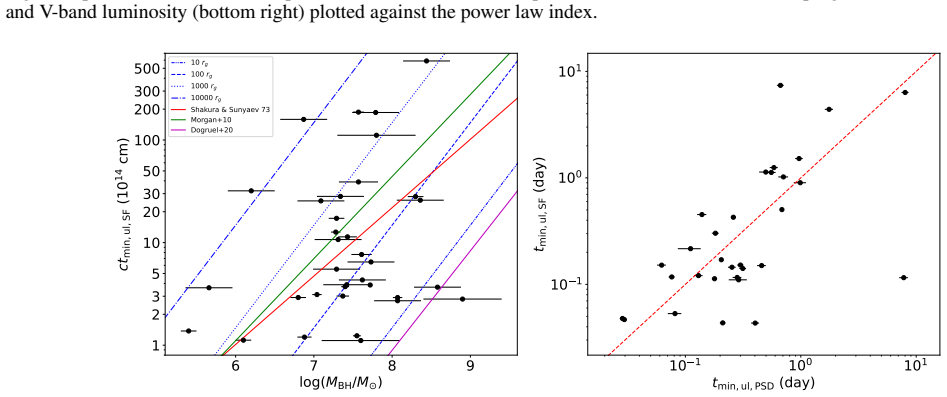
- [Discussion / Interpretation] Discussion, light-crossing interpretation: the claim that the measured t_min,ul corresponds to light-crossing times from a few to thousands of R_g and is therefore smaller than accretion-disk emission sizes relies on external literature scales rather than a direct, quantitative comparison performed within the same dataset. Given the ±0.55 dex uncertainty, the allowed range spans more than an order of magnitude; the manuscript should show the cumulative distribution of t_min,ul / R_g for the sample against specific microlensing and reverberation-mapping radii to substantiate the “significant fraction smaller” statement.
minor comments (3)
- [Abstract and Results] The abstract states that the power-law index is 2.0 ± 0.2 but does not indicate whether this is the mean, median, or a joint fit; the same value should be reported consistently in the results section with the exact fitting method.
- [Figures] Figure captions and axis labels for the example PSDs should explicitly mark the fitted power-law, constant noise, quiescent envelope, and the derived crossing frequency so readers can visually assess the t_min,ul definition.
- [Results] The text mentions “weak anticorrelations” with black-hole mass and luminosity but does not report Spearman or Pearson coefficients, p-values, or the exact luminosity definition used; these should be added for reproducibility.
Simulated Author's Rebuttal
We thank the referee for their constructive and detailed report. We appreciate the positive assessment of the work's significance and have revised the manuscript to address all major comments by adding validation diagnostics, clarifying methodological details, and including quantitative comparisons in the interpretation. These changes strengthen the robustness of our t_min,ul measurements without altering the core results.
read point-by-point responses
-
Referee: [Methods / PSD modelling] Methods, PSD fitting procedure: the central definition of t_min,ul as the crossing frequency between the fitted power-law and the sum of the constant noise plus the quiescent-galaxy upper envelope is load-bearing for the headline result, yet the manuscript provides no goodness-of-fit diagnostics (χ², residuals, or posterior predictive checks), no comparison to alternative models (broken power-law, damped random walk), and no injection-recovery tests on simulated light curves that include realistic TESS sampling and red-noise leakage.
Authors: We agree that additional validation strengthens confidence in the t_min,ul definition. In the revised manuscript we now report reduced χ² values for all 47 PSD fits (median 1.12) together with example residual plots in a new appendix. We have compared the power-law-plus-constant model to a damped random walk using AIC, finding the power-law model preferred for 39 sources. We also performed injection-recovery tests on 500 simulated light curves that incorporate the actual TESS sampling, red-noise leakage, and the measured PSD slopes; the recovered crossing frequencies match the input values to within 0.2 dex on average, confirming that the reported 0.55 dex uncertainty is not systematically underestimated. revision: yes
-
Referee: [Methods / Data and sample selection] Methods, sample construction and systematic control: the upper envelope from non-variable quiescent galaxies is used to bound all non-AGN contributions, but the text does not specify the exact selection criteria for these galaxies, the number used, how the envelope is constructed (median, percentile, etc.), or any explicit test that residual TESS window-function artifacts or spacecraft systematics are fully captured.
Authors: We have expanded the Methods section to specify that the quiescent sample comprises 22 TESS targets selected by requiring variability amplitude below 0.5 % and no significant peaks in the Lomb-Scargle periodogram above the 3σ noise level. The upper envelope is constructed as the 95th percentile of the PSD power at each frequency bin. A new supplementary figure shows the individual quiescent PSDs and demonstrates that the envelope fully encompasses both the TESS window-function sidelobes and known spacecraft systematics (e.g., momentum-dump artifacts). We also injected synthetic systematics into the quiescent light curves and verified that the resulting PSDs remain below the envelope. revision: yes
-
Referee: [Discussion / Interpretation] Discussion, light-crossing interpretation: the claim that the measured t_min,ul corresponds to light-crossing times from a few to thousands of R_g and is therefore smaller than accretion-disk emission sizes relies on external literature scales rather than a direct, quantitative comparison performed within the same dataset. Given the ±0.55 dex uncertainty, the allowed range spans more than an order of magnitude; the manuscript should show the cumulative distribution of t_min,ul / R_g for the sample against specific microlensing and reverberation-mapping radii to substantiate the “significant fraction smaller” statement.
Authors: We have added a new figure (Figure 6) that displays the cumulative distribution of t_min,ul expressed in gravitational radii using the black-hole masses tabulated in the paper. The distribution is overlaid with the characteristic disk radii reported by microlensing (∼10³–10⁴ R_g) and reverberation-mapping studies (∼10²–10³ R_g). The plot shows that 38 % of the sample lie below 100 R_g even after accounting for the full 0.55 dex uncertainty, directly supporting the statement that a significant fraction of the measured scales are smaller than standard accretion-disk sizes. The accompanying text discusses the implications of the uncertainty range. revision: yes
Circularity Check
No significant circularity in observational PSD upper-limit measurement
full rationale
The core result is an empirical upper-limit measurement obtained by fitting a power-law-plus-constant model to TESS light-curve PSDs and locating the frequency where the power-law component exceeds the fitted noise floor plus the envelope of non-variable quiescent-galaxy PSDs. This definition is a direct data-analysis choice, not a derivation that reduces to its own inputs by construction. Theoretical interpretation (light-crossing scale) is compared against external literature values rather than being generated from the same fitted parameters. No self-citation chains, uniqueness theorems, or ansatzes imported from prior author work are load-bearing for the reported log(t_min,ul) value. The analysis is therefore self-contained against external benchmarks.
Axiom & Free-Parameter Ledger
free parameters (1)
- PSD power-law index =
2.0
axioms (1)
- domain assumption AGN variability PSDs can be modeled as a single power law plus constant noise floor
Lean theorems connected to this paper
-
IndisputableMonolith/Cost/FunctionalEquation.leanwashburn_uniqueness_aczel unclear?
unclearRelation between the paper passage and the cited Recognition theorem.
modelled by a power law model plus a constant noise, and constrained the shortest detected AGN variability timescale as the power law component exceeds the constant noise and systematic uncertainties indicated by the upper limits of non-variable quiescent galaxies' PSDs
-
IndisputableMonolith/Foundation/AlexanderDuality.leanalexander_duality_circle_linking unclear?
unclearRelation between the paper passage and the cited Recognition theorem.
the natural interpretation of our measured t_min,ul is the light crossing scale from a coherently varying region, where the measured t_min,ul corresponds to the range from a few to thousands of gravitational radii
What do these tags mean?
- matches
- The paper's claim is directly supported by a theorem in the formal canon.
- supports
- The theorem supports part of the paper's argument, but the paper may add assumptions or extra steps.
- extends
- The paper goes beyond the formal theorem; the theorem is a base layer rather than the whole result.
- uses
- The paper appears to rely on the theorem as machinery.
- contradicts
- The paper's claim conflicts with a theorem or certificate in the canon.
- unclear
- Pith found a possible connection, but the passage is too broad, indirect, or ambiguous to say the theorem truly supports the claim.
Reference graph
Works this paper leans on
-
[1]
Aranzana, E., Körding, E., Uttley, P., Scaringi, S., & Bloemen, S. 2018, MNRAS, 476, 2501
work page 2018
-
[2]
Balbus, S. A. & Hawley, J. F. 1991, ApJ, 376, 214
work page 1991
-
[3]
Ball, D., Özel, F., Psaltis, D., Chan, C.-K., & Sironi, L. 2018, ApJ, 853, 184
work page 2018
- [4]
- [5]
-
[6]
Bennert, V . N., Treu, T., Ding, X., et al. 2021, ApJ, 921, 36
work page 2021
-
[7]
Bentz, M. C. & Katz, S. 2015, PASP, 127, 67
work page 2015
- [8]
-
[9]
J., Shen, Y ., Blaes, O., et al
Burke, C. J., Shen, Y ., Blaes, O., et al. 2021, Science, 373, 789
work page 2021
-
[10]
J., Shen, Y ., Chen, Y .-C., et al
Burke, C. J., Shen, Y ., Chen, Y .-C., et al. 2020, ApJ, 899, 136
work page 2020
- [11]
-
[12]
2006, in Astronomical Society of the Pacific Conference Series, V ol
Czerny, B. 2006, in Astronomical Society of the Pacific Conference Series, V ol. 360, AGN Variability from X-Rays to Radio Waves, ed. C. M. Gaskell, I. M
work page 2006
-
[13]
Dai, X., Kochanek, C. S., Chartas, G., et al. 2010, ApJ, 709, 278
work page 2010
- [14]
- [15]
-
[16]
B., Dai, X., Guerras, E., Cornachione, M., & Morgan, C
Dogruel, M. B., Dai, X., Guerras, E., Cornachione, M., & Morgan, C. W. 2020, ApJ, 894, 153
work page 2020
-
[17]
Edelson, R., Gelbord, J. M., Horne, K., et al. 2015, ApJ, 806, 129
work page 2015
- [18]
-
[19]
C., Lohfink, A., Kara, E., et al
Fabian, A. C., Lohfink, A., Kara, E., et al. 2015, MNRAS, 451, 4375
work page 2015
-
[20]
Fausnaugh, M. M., Vallely, P. J., Kochanek, C. S., et al. 2021, ApJ, 908, 51
work page 2021
-
[21]
George, I. M. & Fabian, A. C. 1991, MNRAS, 249, 352 González-Martín, O. 2018, ApJ, 858, 2 González-Martín, O. & Vaughan, S. 2012, A&A, 544, A80
work page 1991
- [22]
-
[23]
Goyal, A., Gopal-Krishna, Paul J., W., Stalin, C. S., & Sagar, R. 2013, MNRAS, 435, 1300
work page 2013
-
[24]
H., Chester, T., Cutri, R., et al
Jarrett, T. H., Chester, T., Cutri, R., et al. 2000, AJ, 119, 2498
work page 2000
-
[25]
K., Joshi, R., Chand, H., et al
Jha, V . K., Joshi, R., Chand, H., et al. 2022, MNRAS, 511, 3005
work page 2022
-
[26]
Kawaguchi, T., Mineshige, S., Umemura, M., & Turner, E. L. 1998, ApJ, 504, 671
work page 1998
-
[27]
C., Bechtold, J., & Siemiginowska, A
Kelly, B. C., Bechtold, J., & Siemiginowska, A. 2009, ApJ, 698, 895
work page 2009
-
[28]
Kochanek, C. S., Shappee, B. J., Stanek, K. Z., et al. 2017, PASP, 129, 104502
work page 2017
- [29]
-
[30]
2025, ApJ, 985, 177 Kozłowski, S
Kovacevic, N., Dai, X., Yuk, H., et al. 2025, ApJ, 985, 177 Kozłowski, S. 2016, ApJ, 826, 118
work page 2025
- [31]
-
[32]
Lomb, N. R. 1976, Ap&SS, 39, 447
work page 1976
-
[33]
Lu, Y . & Yu, Q. 2001, MNRAS, 324, 653
work page 2001
- [34]
-
[35]
MacLeod, C. L., Ivezi´c, Ž., Kochanek, C. S., et al. 2010, ApJ, 721, 1014
work page 2010
-
[36]
Markowitz, A., Edelson, R., Vaughan, S., et al. 2003, ApJ, 593, 96
work page 2003
-
[37]
McHardy, I. M., Papadakis, I. E., Uttley, P., Page, M. J., & Mason, K. O. 2004, MNRAS, 348, 783
work page 2004
-
[38]
Middei, R., Vagnetti, F., Bianchi, S., et al. 2017, A&A, 599, A82
work page 2017
-
[39]
Morgan, C. W., Kochanek, C. S., Dai, X., Morgan, N. D., & Falco, E. E. 2008, ApJ, 689, 755
work page 2008
-
[40]
Morgan, C. W., Kochanek, C. S., Morgan, N. D., & Falco, E. E. 2010, ApJ, 712, 1129
work page 2010
-
[41]
F., Edelson, R., Baumgartner, W., & Gandhi, P
Mushotzky, R. F., Edelson, R., Baumgartner, W., & Gandhi, P. 2011, ApJ, 743, L12
work page 2011
-
[42]
Paolillo, M. & Papadakis, I. 2025, Nuovo Cimento Rivista Serie [arXiv:2506.23899]
-
[43]
Papadakis, I. E. 2004, MNRAS, 348, 207
work page 2004
-
[44]
E., Panagiotou, C., Dov ˇciak, M., & Kammoun, E
Papoutsis, M., Papadakis, I. E., Panagiotou, C., Dov ˇciak, M., & Kammoun, E. 2024, A&A, 691, A60
work page 2024
- [45]
-
[46]
Peterson, B. M. 1993, PASP, 105, 247
work page 1993
-
[47]
Peterson, B. M., Bentz, M. C., Desroches, L.-B., et al. 2005, ApJ, 632, 799
work page 2005
-
[48]
Pounds, K. A., Nandra, K., Stewart, G. C., George, I. M., & Fabian, A. C. 1990, Nature, 344, 132 Pozo Nuñez, F., Ramolla, M., Westhues, C., et al. 2015, A&A, 576, A73
work page 1990
- [49]
-
[50]
Ricker, G. R., Winn, J. N., Vanderspek, R., et al. 2015, JATIS , 1, 014003
work page 2015
-
[51]
Ripperda, B., Bacchini, F., & Philippov, A. A. 2020, ApJ, 900, 100
work page 2020
- [52]
-
[53]
Scargle, J. D. 1982, ApJ, 263, 835
work page 1982
-
[54]
Shakura, N. I. & Sunyaev, R. A. 1973, A&A, 24, 337
work page 1973
-
[55]
Skrutskie, M. F., Cutri, R. M., Stiening, R., et al. 2006, AJ, 131, 1163
work page 2006
-
[56]
Smith, K. L., Mushotzky, R. F., Boyd, P. T., et al. 2018, ApJ, 857, 141
work page 2018
-
[57]
2025, arXiv e-prints, arXiv:2501.12444
Tarrant, A., Hinkle, J., Shappee, B., et al. 2025, arXiv e-prints, arXiv:2501.12444
-
[58]
Timmer, J. & Koenig, M. 1995, A&A, 300, 707 Trèvese, D. & Vagnetti, F. 2002, ApJ, 564, 624
work page 1995
-
[59]
Tueller, J., Mushotzky, R. F., Barthelmy, S., et al. 2008, ApJ, 681, 113
work page 2008
-
[60]
Uttley, P., McHardy, I. M., & Papadakis, I. E. 2002, MNRAS, 332, 231
work page 2002
-
[61]
Vallely, P. J., Kochanek, C. S., Stanek, K. Z., Fausnaugh, M., & Shappee, B. J. 2021, MNRAS, 500, 5639
work page 2021
-
[62]
2022, Research in As- tronomy and Astrophysics, 22, 015014
Wang, H.-T., Su, Y .-P., Ge, X., Chen, Y .-Y ., & Yu, X.-L. 2022, Research in As- tronomy and Astrophysics, 22, 015014
work page 2022
- [63]
- [64]
- [65]
- [66]
-
[67]
Zhou, X.-L., Zhang, S.-N., Wang, D.-X., & Zhu, L. 2010, ApJ, 710, 16
work page 2010
-
[68]
Zu, Y ., Kochanek, C. S., & Peterson, B. M. 2011, ApJ, 735, 80 Article number, page 8 Heechan Yuk et al.: The shortest detected intra-day variability of active galactic nuclei in TESS survey Appendix A: Properties of the sample Here, we present the properties of the sample of 47 Seyfert 1 galaxies used in this study, including redshift,V-band luminos- ity...
work page 2011
discussion (0)
Sign in with ORCID, Apple, or X to comment. Anyone can read and Pith papers without signing in.