REVIEW 2 major objections 4 minor 80 references
Interactive 2D visualizations outperform random and farthest-first sampling for biomedical time-series labels when annotations from multiple people are pooled.
Reviewed by Pith at T0; open to challenge. T0 means a machine referee read the full paper against a public rubric. the ladder, T0–T4 →
T0 review · grok-4.5
2026-07-13 17:25 UTC pith:HCF5SQWL
load-bearing objection Solid multi-annotator empirical comparison of free-form 2DV sample selection vs RND/FAFT on two real biomedical time-series tasks; the free-form/budget caveat is already quantified and scoped. the 2 major comments →
Evaluating Interactive 2D Visualization as a Sample Selection Strategy for Biomedical Time-Series Data Annotation
The pith
A machine-rendered reading of the paper's core claim, the machinery that carries it, and where it could break.
Core claim
Across four classification tasks in infant motility assessment and speech emotion recognition, interactive 2-D visualization sampling produced the strongest models once labels from multiple annotators were combined, while capturing rare classes more effectively than random or farthest-first selection; under single-annotator or highly constrained budgets its free-form nature increased label-distribution variability and failure risk, so random sampling stayed safest.
What carries the argument
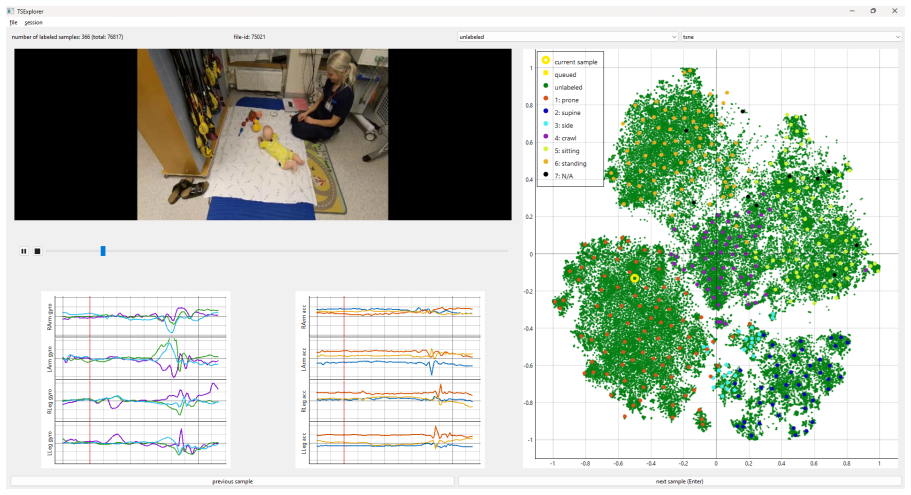
TSExplorer—a GUI that projects the entire unlabeled dataset into switchable t-SNE, PCA and UMAP scatter plots so annotators can freely pick samples near decision boundaries rather than following a fixed algorithmic order.
Load-bearing premise
That unrestricted free-form clicking on fixed self-supervised 2-D maps, with only a few hundred labels per track, fairly shows the practical value of interactive visualization rather than simply reflecting the tight budget and lack of selection guidelines.
What would settle it
Repeat the same four tasks with a substantially larger per-annotator budget (or with explicit coverage guidelines) and test whether the elevated label-distribution variability and rare-class failures of 2DV disappear while its advantage under pooled labels remains.
Editorial analysis
A structured set of objections, weighed in public.
Referee Report
Summary. The paper presents a human-annotator study comparing three sample-selection strategies—random sampling (RND), farthest-first traversal (FAFT), and interactive 2D visualization (2DV) via the TSExplorer GUI—for biomedical time-series annotation. Twelve annotators (experts and non-experts) labeled four tasks (IMA posture/movement; SER valence/arousal) under a fixed budget of 360–400 labels per track. Post-annotation analyses examine label histograms, progressive fine-tuning of SSL models under separate vs. combined labels, and a multi-metric failure-risk score. The central claim is that 2DV yields the best aggregated-label classification performance and rare-class coverage, while RND is safest under uncertainty about annotator count or expertise, and that 2DV is therefore promising when the budget is not highly constrained.
Significance. The work fills a genuine gap: almost all prior sample-selection and active-learning literature for biomedical time series relies on simulated labels, whereas this study uses real human annotators, two modalities, expert/non-expert stratification, progressive annotation counts, and an explicit risk analysis. The public release of TSExplorer and the online appendix of 2D projections further strengthen reproducibility. If the multi-annotator / less-constrained-budget regime generalizes, interactive visualization becomes a practical, low-overhead alternative to pure algorithmic sampling for clinical annotation pipelines.
major comments (2)
- The strongest claim (2DV best under aggregation; promising when budget is not highly constrained) rests on a free-form operationalization of 2DV that the paper itself shows produces high label-distribution variability and rare-class omissions under the chosen N=360–400 (Sections 5.1, 5.4, 6). Because no guided-exploration or budget-scaled ablation is reported, it remains unclear whether the elevated failure risk is intrinsic to interactive visualization or an artifact of unrestricted clicking on fixed SSL projections. A modest additional experiment (e.g., one guided-2DV arm or a higher-N subset) would make the scoped claim far more robust.
- SER evaluation uses a gold-standard test set of only 345 utterances (Section 4.1.2). The paper notes increased variance, yet the area-under-curve comparisons and risk rankings for SER (Figures 5, 7; Table 2) are presented with the same weight as the large IMA test set. Confidence intervals or bootstrap tests on the SER UAR differences would clarify whether the expert-annotator 2DV advantage is statistically reliable.
minor comments (4)
- Figure 3 caption and surrounding text appear twice (once mid-Section 4.3.2, once as the proper figure); remove the duplicate block.
- Clarify whether the SSL features used for FAFT/2DV were frozen before annotation or could have been influenced by any of the original labels (Section 4.2).
- Table 2 ranks are dense-ranked sums; a short note on how ties were broken (or left unbroken) would aid reproducibility.
- The post-experiment interview remarks on enjoyment are anecdotal; either quantify them or move them fully to Discussion.
Circularity Check
No circularity: purely empirical comparison of three sampling strategies against external original labels and held-out test sets.
full rationale
The paper is an empirical human-annotator study comparing RND, FAFT, and interactive 2DV sample selection on two biomedical time-series modalities (IMA multi-sensor IMU posture/movement; SER valence/arousal). Annotators label under a fixed budget without access to original labels; post-annotation evaluation uses those original labels only as external references for histograms and as ground-truth for fine-tuning SSL models and measuring UAF1/UAR on held-out test sets (unannotated MAIJU-DS frames; NICU-A GS). Failure-risk metrics (0.9 imes best performance, half rare-class proportion, Hellinger instability) are explicit evaluation choices, not definitions that force the ranking. No parameters are fitted to data and then re-used as ‘predictions’; no uniqueness theorems or load-bearing self-citations close a definitional loop; SSL features and FAFT are standard tools applied for representation and coverage, not derived from the target performance claims. The strongest claim (2DV best under label aggregation, promising when budget is not highly constrained) is scoped by the paper’s own reported variability and risk analysis. The derivation chain is therefore self-contained against external benchmarks and exhibits no circular reduction.
Axiom & Free-Parameter Ledger
free parameters (4)
- annotation budget N =
360 / 400
- rare-class failure threshold =
0.5 × reference proportion
- model-performance failure threshold =
0.9 × best
- SSL model size =
3 blocks
axioms (4)
- domain assumption Self-supervised embeddings (Vaaras et al. 2025) preserve the manifolds relevant to the annotation tasks so that 2D projections are informative for human selection.
- domain assumption Original MAIJU-DS and NICU-A gold-standard labels constitute an unbiased external reference for both histogram comparison and test-set evaluation.
- domain assumption Majority vote (or random tie-break) of multiple annotators yields a valid combined training label.
- ad hoc to paper Unrestricted free-form clicking on any of the three projections is a fair operationalization of ‘2DV-based sample selection’.
invented entities (1)
-
TSExplorer GUI
independent evidence
read the original abstract
Reliable machine-learning models in biomedical settings depend on accurate labels, yet annotating biomedical time-series data remains challenging. Algorithmic sample selection may support annotation, but evidence from studies involving real human annotators is scarce. Consequently, we compare three sample selection methods for annotation: random sampling (RND), farthest-first traversal (FAFT), and a graphical user interface-based method enabling exploration of complementary 2D visualizations (2DVs) of high-dimensional data. We evaluated the methods across four classification tasks in infant motility assessment (IMA) and speech emotion recognition (SER). Twelve annotators, categorized as experts or non-experts, performed data annotation under a limited annotation budget, and post-annotation experiments were conducted to evaluate the sampling methods. Across all classification tasks, 2DV performed best when aggregating labels across annotators. In IMA, 2DV most effectively captured rare classes, but also exhibited greater annotator-to-annotator label distribution variability resulting from the limited annotation budget, decreasing classification performance when models were trained on individual annotators' labels; in these cases, FAFT excelled. For SER, 2DV outperformed the other methods among expert annotators and matched their performance for non-experts in the individual-annotator setting. A failure risk analysis revealed that RND was the safest choice when annotator count or annotator expertise was uncertain, whereas 2DV had the highest risk due to its greater label distribution variability. Furthermore, post-experiment interviews indicated that 2DV made the annotation task more interesting and enjoyable. Overall, 2DV-based sampling appears promising for biomedical time-series data annotation, particularly when the annotation budget is not highly constrained.
Figures



Reference graph
Works this paper leans on
-
[1]
Addressing the Cold Start Problem in Active Learning Approach Used For Semi-automated Sleep Stages Classification,
N. Grimova, M. Macas, and V . Gerla, “Addressing the Cold Start Problem in Active Learning Approach Used For Semi-automated Sleep Stages Classification,” inProc. BIBM, 2018, pp. 2249–2253
2018
-
[2]
Clinical applications of machine learning algorithms: beyond the black box,
D. S. Watson, J. Krutzinna, I. N. Bruce, C. E. Griffiths, I. B. McInnes, M. R. Barnes, and L. Floridi, “Clinical applications of machine learning algorithms: beyond the black box,”BMJ, vol. 364, 2019
2019
-
[3]
The impact of inconsistent human annotations on AI driven clinical decision making,
A. Sylolypavan, D. Sleeman, H. Wu, and M. Sim, “The impact of inconsistent human annotations on AI driven clinical decision making,”npj Digital Medicine, vol. 6, no. 26, 2023
2023
-
[4]
Interrater reliability estimators tested against true interrater reliabilities,
X. Zhao, G. C. Feng, S. H. Ao, and P. L. Liu, “Interrater reliability estimators tested against true interrater reliabilities,”BMC Medical Research Methodology, vol. 22, no. 232, 2022
2022
-
[5]
Improved Manual Annotation of EEG Signals through Convolutional Neural Network Guidance,
M. Diachenko, S. J. Houtman, E. L. Juarez-Martinez, J. R. Ramautar, R. Weiler, H. D. Mansvelder, H. Bruining, P. Bloem, and K. Linkenkaer-Hansen, “Improved Manual Annotation of EEG Signals through Convolutional Neural Network Guidance,”eNeuro, vol. 9, no. 5, 2022
2022
-
[6]
A multi-interactive learning model for sleep staging based on polysomnography signals,
S. K. Sahu, S. K. Satapathy, S. K. Mohapatra, and G. M. Habtemariam, “A multi-interactive learning model for sleep staging based on polysomnography signals,”Discover Computing, vol. 28, 2025
2025
-
[7]
RobustSleepNet: Transfer Learning for Automated Sleep Staging at Scale,
A. Guillot and V . Thorey, “RobustSleepNet: Transfer Learning for Automated Sleep Staging at Scale,”IEEE Transactions on Neural Systems and Rehabilitation Engineering, vol. 29, pp. 1441–1451, 2021
2021
-
[8]
IAR 2.0: An Algorithm for Refining Inconsistent Annotations for Time-Series Data Using Discriminative Classifiers,
E. Vaaras, M. Airaksinen, and O. R¨as¨anen, “IAR 2.0: An Algorithm for Refining Inconsistent Annotations for Time-Series Data Using Discriminative Classifiers,”IEEE Access, vol. 13, pp. 19 979–19 995, 2025
2025
-
[9]
A survey of label-noise deep learning for medical image analysis,
J. Shi, K. Zhang, C. Guo, Y . Yang, Y . Xu, and J. Wu, “A survey of label-noise deep learning for medical image analysis,”Medical Image Analysis, vol. 95, p. 103166, 2024. 23
2024
-
[10]
Deep learning with noisy labels in medical prediction problems: a scoping review,
Y . Wei, Y . Deng, C. Sun, M. Lin, H. Jiang, and Y . Peng, “Deep learning with noisy labels in medical prediction problems: a scoping review,”Journal of the American Medical Informatics Association, vol. 31, no. 7, pp. 1596–1607, 2024
2024
-
[11]
Hurdles to Artificial Intelligence Deployment: Noise in Schemas and “Gold
M. Abdalla and B. Fine, “Hurdles to Artificial Intelligence Deployment: Noise in Schemas and “Gold” Labels,” Radiology: Artificial Intelligence, vol. 5, no. 2, p. e220056, 2023
2023
-
[12]
Deep self-cleansing for medical image segmentation with noisy labels,
J. Dong, Y . Zhang, Q. Wang, R. Tong, S. Ying, S. Gong, X. Zhang, L. Lin, Y .-W. Chen, and S. K. Zhou, “Deep self-cleansing for medical image segmentation with noisy labels,”Medical Physics, vol. 52, no. 10, p. e70007, 2025
2025
-
[13]
Y . Ma, J. Hou, C. Zhang, Y . Zhou, Z. Ge, H. Xie, and L. Ju, “Benchmarking Real-World Medical Image Classification with Noisy Labels: Challenges, Practice, and Outlook,”arXiv preprint arXiv: 2512.09315, 2025
Pith/arXiv arXiv 2025
-
[14]
Vision6D: 3D-to-2D Interactive Visualization and Annotation Tool for 6D Pose Estimation,
Y . Zhang, E. Davalos, and J. Noble, “Vision6D: 3D-to-2D Interactive Visualization and Annotation Tool for 6D Pose Estimation,”arXiv preprint arXiv: 2504.15329, 2025
Pith/arXiv arXiv 2025
-
[15]
Dimensionality reduction by UMAP for visualizing and aiding in classification of imaging flow cytometry data,
I. Stolarek, A. Samelak-Czajka, M. Figlerowicz, and P. Jackowiak, “Dimensionality reduction by UMAP for visualizing and aiding in classification of imaging flow cytometry data,”iScience, vol. 25, no. 10, p. 105142, 2022
2022
-
[16]
How to Annotate 100 Hours in 45 Minutes,
P. Fallgren, Z. Malisz, and J. Edlund, “How to Annotate 100 Hours in 45 Minutes,” inProc. Interspeech, 2019, pp. 341–345
2019
-
[17]
t-viSNE: Interactive Assessment and Interpretation of t-SNE Projections,
A. Chatzimparmpas, R. M. Martins, and A. Kerren, “t-viSNE: Interactive Assessment and Interpretation of t-SNE Projections,”IEEE Transactions on Visualization and Computer Graphics, vol. 26, no. 8, pp. 2696–2714, 2020
2020
-
[18]
V oxplorer: V oice data exploration and projection in an interactive dashboard,
A. De Luca, S. Madikeri, and V . Dellwo, “V oxplorer: V oice data exploration and projection in an interactive dashboard,” inProc. Interspeech, 2025, pp. 296–297
2025
-
[19]
CZ CELLxGENE Discover: a single-cell data platform for scalable exploration, analysis and modeling of aggregated data,
C. C. S. Program, S. Abdulla, B. Aevermann, P. Assis, S. Badajoz, S. M. Bell, E. Bezzi, B. Cakir, J. Chaffer, S. Chambers, J. M. Cherry, T. Chi, J. Chien, L. Dorman, P. Garcia-Nieto, N. Gloria, M. Hastie, D. Hegeman, J. Hilton, T. Huang, A. Infeld, A.-M. Istrate, I. Jelic, K. Katsuya, Y . J. Kim, K. Liang, M. Lin, M. Lombardo, B. Marshall, B. Martin, F. M...
2024
-
[20]
Assessing the clinical applicability of dimensionality reduction algorithms in flow cytometry for hematologic malignancies,
M.-S. Park, J. K. Lee, B. Kim, H. Y . Ju, K. H. Yoo, C. W. Jung, H.-J. Kim, and H.-Y . Kim, “Assessing the clinical applicability of dimensionality reduction algorithms in flow cytometry for hematologic malignancies,” Clinical Chemistry and Laboratory Medicine, vol. 63, no. 7, pp. 1432–1442, 2025. 24
2025
-
[21]
Harnessing Native-Resolution 2D Embeddings for Lung Cancer Classification: A Feasibility Study with the RAD-DINO Self-supervised Foundation Model,
E. Hoq, L. Tarbox, D. J. Jr., L. Larson-Prior, and F. Prior, “Harnessing Native-Resolution 2D Embeddings for Lung Cancer Classification: A Feasibility Study with the RAD-DINO Self-supervised Foundation Model,” Journal of Imaging Informatics in Medicine, 2025
2025
-
[22]
viSNE enables visualization of high dimensional single-cell data and reveals phenotypic heterogeneity of leukemia,
E.-a. D. Amir, K. L. Davis, M. D. Tadmor, E. F. Simonds, J. H. Levine, S. C. Bendall, D. K. Shenfeld, S. Krishnaswamy, G. P. Nolan, and D. Pe’er, “viSNE enables visualization of high dimensional single-cell data and reveals phenotypic heterogeneity of leukemia,”Nature Biotechnology, vol. 31, no. 6, pp. 545–552, 2013
2013
-
[23]
Human Activity Recognition Based on Dynamic Active Learning,
H. Bi, M. Perello-Nieto, R. Santos-Rodriguez, and P. Flach, “Human Activity Recognition Based on Dynamic Active Learning,”IEEE Journal of Biomedical and Health Informatics, vol. 25, no. 4, pp. 922–934, 2021
2021
-
[24]
A Novel Active Learning Framework for Cross-Subject Human Activity Recognition from Surface Electromyography,
Z. Ding, T. Hu, Y . Li, L. Li, Q. Li, P. Jin, and C. Yi, “A Novel Active Learning Framework for Cross-Subject Human Activity Recognition from Surface Electromyography,”Sensors, vol. 24, no. 18, 2024
2024
-
[25]
Exploring Sampling in the Detection of Multicategory EEG Signals,
S. Siuly, E. Kabir, H. Wang, and Y . Zhang, “Exploring Sampling in the Detection of Multicategory EEG Signals,”Computational and Mathematical Methods in Medicine, vol. 2015, no. 1, p. 576437, 2015
2015
-
[26]
Unsupervised Feature Selection-Driven Active Learning for Semi-Supervised Automatic ECG Analysis,
X. Li, Y . Zhou, S. An, Y . Zeng, X. Zhang, J. Wang, Y . Huang, F. Lin, and P. Zhang, “Unsupervised Feature Selection-Driven Active Learning for Semi-Supervised Automatic ECG Analysis,”IEEE Journal of Biomedical and Health Informatics, vol. (Early Access), pp. 1–12, 2025
2025
-
[27]
Active learning in latent spaces for long-term ECG monitoring: Morphology and rhythm analysis,
R. Holgado–Cuadrado, C. Plaza–Seco, F. M. Melgarejo-Meseguer, J. L. Rojo-´Alvarez, and M. Blanco–Velasco, “Active learning in latent spaces for long-term ECG monitoring: Morphology and rhythm analysis,”Biomedical Signal Processing and Control, vol. 112, p. 108622, 2026
2026
-
[28]
Active Learning with Real Annotation Costs,
B. Settles, M. Craven, and L. Friedland, “Active Learning with Real Annotation Costs,” inProc. NIPS Workshop on Cost-Sensitive Learning, 2008, pp. 1–10
2008
-
[29]
How well does active learningactuallywork? Time-based evaluation of cost- reduction strategies for language documentation
J. Baldridge and A. Palmer, “How well does active learningactuallywork? Time-based evaluation of cost- reduction strategies for language documentation.” inProc. EMNLP, 2009, pp. 296–305
2009
-
[30]
Active Learning for Human Pose Estimation,
B. Liu and V . Ferrari, “Active Learning for Human Pose Estimation,” inProc. ICCV, 2017, pp. 4373–4382
2017
-
[31]
Cost-aware active learning for named entity recognition in clinical text,
Q. Wei, Y . Chen, M. Salimi, J. C. Denny, Q. Mei, T. A. Lasko, Q. Chen, S. Wu, A. Franklin, T. Cohen, and H. Xu, “Cost-aware active learning for named entity recognition in clinical text,”Journal of the American Medical Informatics Association, vol. 26, no. 11, pp. 1314–1322, 2019
2019
-
[32]
Annotation Curricula to Implicitly Train Non-Expert Annotators,
J.-U. Lee, J.-C. Klie, and I. Gurevych, “Annotation Curricula to Implicitly Train Non-Expert Annotators,” Computational Linguistics, vol. 48, no. 2, pp. 343–373, 2022
2022
-
[33]
Active Learning With Realistic Data - A Case Study,
A. Calma, M. Stolz, D. Kottke, S. Tomforde, and B. Sick, “Active Learning With Realistic Data - A Case Study,” inProc. IJCNN, 2018, pp. 1–8. 25
2018
-
[34]
Development of a speech emotion recognizer for large-scale child-centered audio recordings from a hospital environment,
E. Vaaras, S. Ahlqvist-Bj¨orkroth, K. Drossos, L. Lehtonen, and O. R¨as¨anen, “Development of a speech emotion recognizer for large-scale child-centered audio recordings from a hospital environment,”Speech Communication, vol. 148, pp. 9–22, 2023
2023
-
[35]
FinnAffect: An affective speech corpus for spontaneous Finnish,
K. Lahtinen, L. Mustanoja, and O. R¨as¨anen, “FinnAffect: An affective speech corpus for spontaneous Finnish,” Speech Communication, vol. 175, p. 103327, 2025
2025
-
[36]
Active Semi-Supervision for Pairwise Constrained Clustering,
S. Basu, A. Banerjee, and R. J. Mooney, “Active Semi-Supervision for Pairwise Constrained Clustering,” in Proc. SDM, 2004, pp. 333–344
2004
-
[37]
Active learning for sound event classification by clustering unlabeled data,
Z. Shuyang, T. Heittola, and T. Virtanen, “Active learning for sound event classification by clustering unlabeled data,” inProc. ICASSP, 2017, pp. 751–755
2017
-
[38]
Active Learning for Convolutional Neural Networks: A Core-Set Approach,
O. Sener and S. Savarese, “Active Learning for Convolutional Neural Networks: A Core-Set Approach,” in Proc. ICLR, 2018
2018
-
[39]
Active Learning for Sound Event Detection,
Z. Shuyang, T. Heittola, and T. Virtanen, “Active Learning for Sound Event Detection,”IEEE/ACM Transactions on Audio, Speech, and Language Processing, vol. 28, pp. 2895–2905, 2020
2020
-
[40]
Clustering to minimize the maximum intercluster distance,
T. F. Gonzalez, “Clustering to minimize the maximum intercluster distance,”Theoretical Computer Science, vol. 38, pp. 293–306, 1985
1985
-
[41]
Clustering without Over-Representation,
S. Ahmadian, A. Epasto, R. Kumar, and M. Mahdian, “Clustering without Over-Representation,” inProc. KDD, 2019, pp. 267–275
2019
-
[42]
Analysis of Self-Supervised Learning and Dimensionality Reduction Methods in Clustering-Based Active Learning for Speech Emotion Recognition,
E. Vaaras, M. Airaksinen, and O. R¨as¨anen, “Analysis of Self-Supervised Learning and Dimensionality Reduction Methods in Clustering-Based Active Learning for Speech Emotion Recognition,” inProc. Interspeech, 2022, pp. 1143–1147
2022
-
[43]
Investigating Affect Mining Techniques for Annotation Sample Selection in the Creation of Finnish Affective Speech Corpus,
K. Lahtinen, E. Vaaras, L. Mustanoja, and O. R¨as¨anen, “Investigating Affect Mining Techniques for Annotation Sample Selection in the Creation of Finnish Affective Speech Corpus,” inProc. Interspeech, 2025, pp. 3958– 3962
2025
-
[44]
Premature Ventricular Contractions’ Detection Based on Active Learning,
X. Zhang, M. Shafiq, G. Zheng, J. Wan, and Z. Sun, “Premature Ventricular Contractions’ Detection Based on Active Learning,”Scientific Programming, vol. 2021, no. 1, p. 5556011, 2021
2021
-
[45]
Comparing Sampling Strategies for Tackling Imbalanced Data in Human Activity Recognition,
F. Alharbi, L. Ouarbya, and J. A. Ward, “Comparing Sampling Strategies for Tackling Imbalanced Data in Human Activity Recognition,”Sensors, vol. 22, no. 4, 2022
2022
-
[46]
ActiveSelfHAR: Incorporating Self-Training Into Active Learning to Improve Cross-Subject Human Activity Recognition,
B. Wei, C. Yi, Q. Zhang, H. Zhu, J. Zhu, and F. Jiang, “ActiveSelfHAR: Incorporating Self-Training Into Active Learning to Improve Cross-Subject Human Activity Recognition,”IEEE Internet of Things Journal, vol. 11, no. 4, pp. 6833–6847, 2024
2024
-
[47]
A tutorial on human activity recognition using body-worn inertial sensors,
A. Bulling, U. Blanke, and B. Schiele, “A tutorial on human activity recognition using body-worn inertial sensors,”ACM Computing Surveys, vol. 46, no. 3, pp. 1–33, 2014. 26
2014
-
[48]
Recent trends in machine learning for human activity recognition—A survey,
S. Ramasamy Ramamurthy and N. Roy, “Recent trends in machine learning for human activity recognition—A survey,”WIREs Data Mining and Knowledge Discovery, vol. 8, no. 4, p. e1254, 2018
2018
-
[49]
Leveraging Active Learning and Conditional Mutual Information to Minimize Data Annotation in Human Activity Recognition,
R. Adaimi and E. Thomaz, “Leveraging Active Learning and Conditional Mutual Information to Minimize Data Annotation in Human Activity Recognition,”Proceedings of the ACM on Interactive, Mobile, Wearable and Ubiquitous Technologies, vol. 3, no. 3, pp. 1–23, 2019
2019
-
[50]
Transfer Learning in Sensor-Based Human Activity Recognition: A Survey,
S. G. Dhekane and T. Ploetz, “Transfer Learning in Sensor-Based Human Activity Recognition: A Survey,” ACM Computing Surveys, vol. 57, no. 8, pp. 1–39, 2025
2025
-
[51]
Dimensionality reduction by UMAP reinforces sample heterogeneity analysis in bulk transcriptomic data,
Y . Yang, H. Sun, Y . Zhang, T. Zhang, J. Gong, Y . Wei, Y .-G. Duan, M. Shu, Y . Yang, D. Wu, and D. Yu, “Dimensionality reduction by UMAP reinforces sample heterogeneity analysis in bulk transcriptomic data,”Cell Reports, vol. 36, no. 4, p. 109442, 2021
2021
-
[52]
Dimensionality reduction for visualizing spatially resolved profiling data using SpaSNE,
Y . Zhou, C. Tang, X. Xiao, X. Zhan, T. Wang, G. Xiao, and L. Xu, “Dimensionality reduction for visualizing spatially resolved profiling data using SpaSNE,”GigaScience, vol. 14, p. giaf002, 2025
2025
-
[53]
An Analysis of Several Heuristics for the Traveling Salesman Problem,
D. J. Rosenkrantz, R. E. Stearns, and P. M. Lewis, II, “An Analysis of Several Heuristics for the Traveling Salesman Problem,”SIAM Journal on Computing, vol. 6, no. 3, pp. 563–581, 1977
1977
-
[54]
Visualizing High-Dimensional Data Using t-SNE,
L. van der Maaten and G. Hinton, “Visualizing High-Dimensional Data Using t-SNE,”Journal of Machine Learning Research, vol. 9, no. 86, pp. 2579–2605, 2008
2008
-
[55]
UMAP: Uniform Manifold Approximation and Projection for Dimension Reduction,
L. McInnes, J. Healy, and J. Melville, “UMAP: Uniform Manifold Approximation and Projection for Dimension Reduction,”arXiv preprint arXiv: 1802.03426, 2018
Pith/arXiv arXiv 2018
-
[56]
Uniform manifold approximation and projection,
J. Healy and L. McInnes, “Uniform manifold approximation and projection,”Nature Reviews Methods Primers, vol. 4, no. 82, 2024
2024
-
[57]
Intelligent wearable allows out-of-the-lab tracking of developing motor abilities in infants,
M. Airaksinen, A. Gallen, A. Kivi, P. Vijayakrishnan, T. H¨ayrinen, E. Ilen, O. R¨as¨anen, L. M. Haataja, and S. Vanhatalo, “Intelligent wearable allows out-of-the-lab tracking of developing motor abilities in infants,” Communications Medicine, vol. 2, no. 69, 2022
2022
-
[58]
Assessing Infant Gross Motor Performance With an At-Home Wearable,
M. Airaksinen, A. Gallen, E. Taylor, S. de Sena, T. Palsa, L. Haataja, and S. Vanhatalo, “Assessing Infant Gross Motor Performance With an At-Home Wearable,”Pediatrics, vol. 155, no. 4, p. e2024068647, 2025
2025
-
[59]
The validity of the Language Environment Analysis system in two neonatal intensive care units,
E. St˚ahlberg-Forsen, A. Aija, B. Kaasik, R. Latva, S. Ahlqvist-Bj¨orkroth, L. Toome, L. Lehtonen, and S. Stolt, “The validity of the Language Environment Analysis system in two neonatal intensive care units,”Acta Paediatrica, vol. 110, no. 7, pp. 2045–2051, 2021
2045
-
[60]
Exposure to the parents’ speech is positively associated with preterm infant’s face preference,
A. Aija, J. Lepp¨anen, L. Aarnos, M. Hyv¨onen, E. St˚ahlberg-Forsen, S. Ahlqvist-Bj¨orkroth, S. Stolt, L. Toome, and L. Lehtonen, “Exposure to the parents’ speech is positively associated with preterm infant’s face preference,” Pediatric Research, vol. 96, no. 7, pp. 1803–1811, 2024. 27
2024
-
[61]
Parents’ Speech in the NICU and Language Development of Very Preterm Children at 12 and 24 Months,
A. Aija, E. St˚ahlberg-Fors´en, L. Toome, L. Aarnos, S. Ahlqvist-Bj¨orkroth, S. Stolt, and L. Lehtonen, “Parents’ Speech in the NICU and Language Development of Very Preterm Children at 12 and 24 Months,”The Journal of Pediatrics: Clinical Practice, vol. 17, p. 200156, 2025
2025
-
[62]
Factors affecting the cognitive profile of 11-year-old children born very preterm,
A. Nyman, T. Korhonen, P. Munck, R. Parkkola, L. Lehtonen, L. Haataja, and PIPARI Study Group, “Factors affecting the cognitive profile of 11-year-old children born very preterm,”Pediatric Research, vol. 82, no. 2, pp. 324–332, 2017
2017
-
[63]
Preterm Birth Is Associated With Depression From Childhood to Early Adulthood,
S. Upadhyaya, A. Sourander, T. Luntamo, H.-M. Matinolli, R. Chudal, S. Hinkka-Yli-Salom¨aki, S. Filatova, K. Cheslack-Postava, M. Sucksdorff, M. Gissler, A. Brown, and L. Lehtonen, “Preterm Birth Is Associated With Depression From Childhood to Early Adulthood,”Journal of the American Academy of Child and Adolescent Psychiatry, vol. 60, no. 9, pp. 1127–1136, 2021
2021
-
[64]
Signal processing for young child speech language development,
D. Xu, U. Yapanel, S. Gray, J. Gilkerson, J. Richards, and J. Hansen, “Signal processing for young child speech language development,” inProc. WOCCI, 2008
2008
-
[65]
PFML: Self-Supervised Learning of Time-Series Data Without Representation Collapse,
E. Vaaras, M. Airaksinen, and O. R¨as¨anen, “PFML: Self-Supervised Learning of Time-Series Data Without Representation Collapse,”IEEE Access, vol. 13, pp. 60 233–60 244, 2025
2025
-
[66]
Interpretability-Driven Sample Selection Using Self Supervised Learning for Disease Classification and Segmentation,
D. Mahapatra, A. Poellinger, L. Shao, and M. Reyes, “Interpretability-Driven Sample Selection Using Self Supervised Learning for Disease Classification and Segmentation,”IEEE Transactions on Medical Imaging, vol. 40, no. 10, pp. 2548–2562, 2021
2021
-
[67]
iSSL-AL: a deep active learning framework based on self-supervised learning for image classification,
R. Agha, A. M. Mustafa, and Q. Abuein, “iSSL-AL: a deep active learning framework based on self-supervised learning for image classification,”Neural Computing and Applications, vol. 36, no. 28, pp. 17 699–17 713, 2024
2024
-
[68]
Self-supervised class-balanced active learning with uncertainty-mastery fusion,
Y .-X. Wu, F. Min, G.-S. Chen, S.-P. Shen, Z.-C. Wen, and X.-B. Zhou, “Self-supervised class-balanced active learning with uncertainty-mastery fusion,”Knowledge-Based Systems, vol. 300, p. 112192, 2024
2024
-
[69]
A Density-Based Active Learning Framework Leveraging Self-supervised Features,
P. Kumar and S. Sharma, “A Density-Based Active Learning Framework Leveraging Self-supervised Features,” inProc. ISMS, 2025, pp. 338–352. 28 Appendices A Key features of the data annotation platform Figures 2 and 8 show example screenshots of the TSExplorer GUI as used for data annotation in the present study for IMA and SER, respectively. The following l...
2025
-
[70]
Users can save the current annotation session usingfile→save session / save as
-
[71]
Users can load a previous annotation session usingsession→load previous session
-
[72]
Users can export their annotations as a CSV file usingsession→export annotations as .csv
-
[73]
Users can see the total number of samples and the current number of annotated samples
-
[74]
Users can see the file ID of the currently selected sample
-
[75]
Common media player functions like play, pause, stop, and scrolling function normally
For cross-platform compatibility, TSExplorer uses the VLC Media Player to play audio and video. Common media player functions like play, pause, stop, and scrolling function normally. Video without audio was used in IMA annotation, and audio only was used in SER annotation
-
[76]
In the present experiments, the multi-channel signals (as shown in Figure 2) were visible in IMA annotation, whereas signals were not visible in SER annotation
Signal visualizations, such as waveforms (single- or multi-channel) or spectrograms, can be set visible, and their panels show a vertical line that is in sync with the scroll marker of the VLC media player. In the present experiments, the multi-channel signals (as shown in Figure 2) were visible in IMA annotation, whereas signals were not visible in SER a...
-
[77]
Each data point represents one sample-to-be- annotated
Users can see a 2D scatter plot representing the entire dataset. Each data point represents one sample-to-be- annotated. In the present study, one data point corresponds to approximately 2.3 seconds of multi-sensor IMU data (video, accelerometer, and gyroscope data) in IMA, or an utterance (audio) in SER. The user can change the visualization algorithm be...
-
[78]
Users can select samples in the scatter plot for annotation or inspection by clicking the left mouse button. Users can also enqueue samples by pressing the right mouse button, after which the user can go through the queued samples one by one either with thenext samplebutton (shortcut:Enterkey), or by left-clicking the queued samples. Queuing is useful e.g...
-
[79]
Users can annotate samples either using a drop-down menu, or by using keyboard shortcuts. Each data point in the scatter plot is colored based on its assigned label (green for unlabeled samples), and the currently 29 Figure 8: An example screenshot of the TSExplorer GUI as used for valence annotation for SER in the present study. On the left of the GUI, t...
-
[80]
Note that for the RND and FAFT sample selection methods, the same GUI was used without the 2D scatter plot to enable a similar annotation interface between the sampling methods
Users can go sample-by-sample backwards in the order they have annotated using theprevious samplebutton. Note that for the RND and FAFT sample selection methods, the same GUI was used without the 2D scatter plot to enable a similar annotation interface between the sampling methods. In these cases, instead of the scatter plot, the GUI contained a list of t...
discussion (0)
Sign in with ORCID, Apple, or X to comment. Anyone can read and Pith papers without signing in.