Recognition: no theorem link
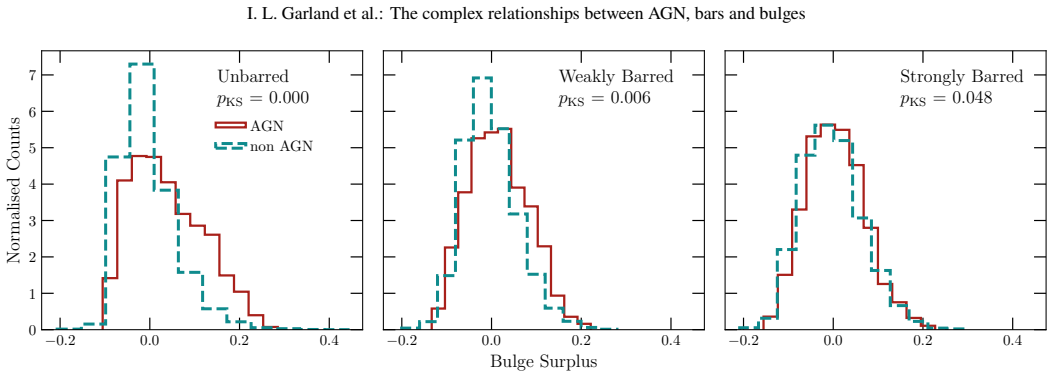
The complex relationships between AGN, bars and bulges
Pith reviewed 2026-05-14 22:01 UTC · model grok-4.3
The pith
AGN activity in galaxies rises with bar strength and bulge prominence independently after controlling for mass and color.
A machine-rendered reading of the paper's core claim, the machinery that carries it, and where it could break.
Core claim
After controlling for stellar mass and color, the AGN fraction rises with increasing bar strength within fixed bins of bulge prominence, and rises with bulge prominence within subsamples of fixed bar strength. These trends show that AGN presence correlates with both bar strength and bulge prominence at the same time rather than one feature explaining the other.
What carries the argument
Comparison of AGN fractions across morphological bins of bar strength and bulge prominence from DESI Legacy Survey imaging, after mass and color controls.
If this is right
- Bar-driven gas inflows can fuel AGN even in galaxies with weak bulges.
- Bulge prominence increases AGN likelihood independently of bars.
- The AGN-bar correlation cannot be fully attributed to shared links with bulges.
- Morphological features add predictive information about AGN beyond mass and color alone.
Where Pith is reading between the lines
- Secular internal processes may dominate black hole growth in the local universe.
- Galaxy evolution models need to track bar and bulge effects on AGN activity as separate channels.
- Higher-resolution imaging could check whether faint bars still produce measurable AGN enhancement.
Load-bearing premise
Visual classifications of bar strength and bulge prominence from the imaging are accurate and free of systematic bias when galaxies are grouped by mass and color.
What would settle it
Repeating the analysis with quantitative, automated measurements of bar strength and bulge prominence that erase the trend of rising AGN fraction with bar strength at fixed bulge prominence would falsify the central claim.
Figures


read the original abstract
Context. Via scaling relations, it is well-known that active galactic nuclei (AGN) and bulges are linked. This link was thought to be driven by mergers, but recent studies show that secular processes are the dominant mechanism of supermassive black hole growth. One such secular mechanism is gas inflow driven by large-scale bars. Since bulges can also grow via these bars, there is likely some common process between these three features. Aims. We investigate whether the observed correlation between AGN and bars is real or arises as a result of correlations between bars and bulges. Methods. Using a catalogue of AGN identifications and galaxy morphologies in the DESI Legacy Survey at $z\leq0.1$, we control for mass and colour and investigate the AGN fraction variation with bulge prominence and bar strength. Results. We first show that the variation in AGN fraction between strongly barred, weakly barred and unbarred galaxies does not qualitatively change if we additionally control for bulge prominence. Second, we find that in fixed bins of bulge prominence, the AGN fraction increases with increasing bar strength. In subsamples split by bar strength, the AGN fraction increases with bulge prominence, indicating that AGN presence correlates with both bar strength and bulge prominence simultaneously.
Editorial analysis
A structured set of objections, weighed in public.
Referee Report
Summary. The paper analyzes a catalog of AGN identifications and galaxy morphologies from the DESI Legacy Survey at z ≤ 0.1. After controlling for stellar mass and color, it reports that AGN fractions increase with bar strength in fixed bins of bulge prominence, and increase with bulge prominence in subsamples split by bar strength, indicating simultaneous correlations of AGN presence with both features.
Significance. If the morphological classifications prove robust against selection biases, the result provides empirical support for secular processes (such as bar-driven gas inflows) contributing to AGN activity alongside bulge growth, helping distinguish these from merger-driven scenarios in low-redshift supermassive black hole evolution.
major comments (3)
- [Methods] Methods section: The control for mass and color is stated, but the manuscript provides no quantitative assessment of morphological classification accuracy, purity, or inter-observer agreement as a function of AGN luminosity or central concentration; this is load-bearing because the skeptic concern (DESI imaging biases from point-source contamination) directly affects the independence of the reported trends.
- [Results] Results section: The binning analysis reports qualitative trends in AGN fractions but includes no error bars, bootstrap uncertainties, or statistical significance tests on the fraction differences across bar-strength and bulge-prominence bins, making it impossible to evaluate whether the increases are significant after the mass+color control.
- [Results] Results section: No table or figure directly compares AGN fractions before versus after the additional bulge-prominence control, so the claim that 'the variation does not qualitatively change' cannot be verified quantitatively.
minor comments (1)
- [Abstract] The abstract and methods should explicitly state the total sample size, the number of galaxies per bin, and the precise AGN selection criteria (e.g., emission-line or X-ray thresholds) to allow reproducibility.
Simulated Author's Rebuttal
We thank the referee for their constructive comments, which highlight important areas for improving the clarity and robustness of our analysis. We address each major comment below and will revise the manuscript accordingly to incorporate quantitative assessments and statistical details.
read point-by-point responses
-
Referee: [Methods] Methods section: The control for mass and color is stated, but the manuscript provides no quantitative assessment of morphological classification accuracy, purity, or inter-observer agreement as a function of AGN luminosity or central concentration; this is load-bearing because the skeptic concern (DESI imaging biases from point-source contamination) directly affects the independence of the reported trends.
Authors: We agree that a quantitative assessment of morphological classification reliability is needed to address potential biases from AGN point-source contamination in DESI imaging. The classifications are drawn from the DESI Legacy Survey morphology catalog, which has been validated in the literature for low-redshift galaxies. In the revised manuscript, we will add a new subsection in Methods that includes available metrics on classification accuracy and purity from prior studies, along with a targeted check comparing bar and bulge classifications for AGN hosts versus non-AGN galaxies to assess any central concentration effects. This will directly support the independence of the reported trends. revision: yes
-
Referee: [Results] Results section: The binning analysis reports qualitative trends in AGN fractions but includes no error bars, bootstrap uncertainties, or statistical significance tests on the fraction differences across bar-strength and bulge-prominence bins, making it impossible to evaluate whether the increases are significant after the mass+color control.
Authors: We acknowledge that the current presentation relies on qualitative trends without error estimates or significance tests. In the revised manuscript, we will add binomial or bootstrap-derived error bars to all AGN fraction plots and include statistical tests (such as chi-squared or Kolmogorov-Smirnov tests) to quantify the significance of differences across bar-strength and bulge-prominence bins after the mass and color control. revision: yes
-
Referee: [Results] Results section: No table or figure directly compares AGN fractions before versus after the additional bulge-prominence control, so the claim that 'the variation does not qualitatively change' cannot be verified quantitatively.
Authors: We will add a new supplementary figure (or table) in the revised manuscript that explicitly shows AGN fractions versus bar strength both before and after applying the bulge-prominence control. This will enable direct quantitative verification that the trends remain qualitatively unchanged. revision: yes
Circularity Check
No circularity: purely empirical binning of AGN fractions
full rationale
The paper performs an observational analysis by binning galaxies from the DESI Legacy Survey catalogue according to visual or automated morphological classifications of bar strength and bulge prominence, then computes AGN fractions after controlling for stellar mass and colour. No equations, derivations, fitted parameters, ansatzes, or uniqueness theorems appear in the abstract or described methods. The central results (AGN fraction increasing with bar strength at fixed bulge prominence, and vice versa) are direct counts from the data splits and do not reduce to any input quantity by construction. Self-citations, if present, are not load-bearing for any claimed derivation because none exists. This matches the default expectation of an honest non-finding for an empirical study.
Axiom & Free-Parameter Ledger
axioms (2)
- domain assumption Bar strength and bulge prominence can be measured reliably and consistently from DESI Legacy Survey images
- domain assumption AGN identifications in the catalog are sufficiently complete and pure for statistical fraction measurements
Reference graph
Works this paper leans on
-
[1]
Abazajian, K. N., Adelman-McCarthy, J. K., Agüeros, M. A., et al. 2009, ApJS, 182, 543 Alonso,S.,Coldwell,G.,Duplancic,F.,Mesa,V.,&Lambas,D.G.2018,A&A, 618, A149 Astropy Collaboration, Price-Whelan, A. M., Lim, P. L., et al. 2022, ApJ, 935, 167 AstropyCollaboration,Price-Whelan,A.M.,Sipőcz,B.M.,etal.2018,AJ,156, 123 Astropy Collaboration, Robitaille, T. P...
work page 2009
- [2]
- [3]
-
[4]
Beifiori, A., Courteau, S., Corsini, E. M., & Zhu, Y. 2012, MNRAS, 419, 2497
work page 2012
-
[5]
F., Monachesi, A., Harmsen, B., et al
Bell, E. F., Monachesi, A., Harmsen, B., et al. 2017, ApJ, 837, L8
work page 2017
-
[6]
Blanton, M. R., Schlegel, D. J., Strauss, M. A., et al. 2005, AJ, 129, 2562
work page 2005
-
[7]
Cheung, E., Trump, J. R., Athanassoula, E., et al. 2015, MNRAS, 447, 506
work page 2015
-
[8]
Cisternas, M., Jahnke, K., Bongiorno, A., et al. 2011, ApJ, 741, L11
work page 2011
-
[9]
Coelho, P. & Gadotti, D. A. 2011, ApJ, 743, L13 Combes,F.2009,inAstronomicalSocietyofthePacificConferenceSeries,Vol. 419,GalaxyEvolution:EmergingInsightsandFutureChallenges,ed.S.Jogee, I. Marinova, L. Hao, & G. A. Blanc, 31
work page 2011
- [10]
- [11]
-
[12]
Fahey, M. J., Garland, I. L., Simmons, B. D., et al. 2025, MNRAS, 537, 3511
work page 2025
-
[13]
Ferrarese, L. & Merritt, D. 2000, ApJ, 539, L9 Frosst,M.,Obreschkow,D.,Ludlow,A.,Bottrell,C.,&Genel,S.2025,MNRAS, 537, 3543
work page 2000
-
[14]
Galloway, M. A., Willett, K. W., Fortson, L. F., et al. 2015, MNRAS, 448, 3442
work page 2015
-
[15]
Gargiulo, I. D., Cora, S. A., Vega-Martínez, C. A., et al. 2017, MNRAS, 472, 4133
work page 2017
-
[16]
Garland, I. L., Fahey, M. J., Simmons, B. D., et al. 2023, MNRAS, 522, 211
work page 2023
-
[17]
Garland, I. L., Walmsley, M., Silcock, M. S., et al. 2024, MNRAS, 532, 2320 Géron, T., Smethurst, R. J., Lintott, C., et al. 2021, MNRAS, 507, 4389
work page 2024
- [18]
-
[19]
Goulding, A. D., Matthaey, E., Greene, J. E., et al. 2017, ApJ, 843, 135
work page 2017
-
[20]
Guo, M., Du, M., Ho, L. C., Debattista, V. P., & Zhao, D. 2020, ApJ, 888, 65
work page 2020
-
[21]
Hamabe, M. & Kormendy, J. 1987, in IAU Symposium, Vol. 127, Structure and Dynamics of Elliptical Galaxies, ed. P. T. de Zeeuw, 379 Häring, N. & Rix, H.-W. 2004, ApJ, 604, L89
work page 1987
-
[22]
Harris, C. R., Millman, K. J., van der Walt, S. J., et al. 2020, Nature, 585, 357
work page 2020
-
[23]
Heckman, T. M. & Best, P. N. 2014, ARA&A, 52, 589
work page 2014
- [24]
-
[25]
Huertas-Company, M., Shuntov, M., Dong, Y., et al. 2025, A&A, 704, A94
work page 2025
-
[26]
Hunter, J. D. 2007, Computing in Science and Engineering, 9, 90
work page 2007
-
[27]
Kataria, S. K. & Vivek, M. 2024, MNRAS, 527, 3366
work page 2024
-
[28]
Kauffmann, G., Heckman, T. M., Tremonti, C., et al. 2003, MNRAS, 346, 1055
work page 2003
-
[29]
H., Shlosman, I., & Peletier, R
Knapen, J. H., Shlosman, I., & Peletier, R. F. 2000, ApJ, 529, 93
work page 2000
- [30]
- [31]
-
[32]
Kormendy, J., Drory, N., Bender, R., & Cornell, M. E. 2010, ApJ, 723, 54
work page 2010
-
[33]
Kormendy, J. & Ho, L. C. 2013, ARA&A, 51, 511
work page 2013
- [34]
-
[35]
2012, ApJ, 757, 60 La Marca, A., Nardone, M
Kraljic, K., Bournaud, F., & Martig, M. 2012, ApJ, 757, 60 La Marca, A., Nardone, M. T., Wang, L., et al. 2026, A&A, 707, A152
work page 2012
-
[36]
Laine, S., Shlosman, I., Knapen, J. H., & Peletier, R. F. 2002, ApJ, 567, 97
work page 2002
- [37]
-
[38]
Laurikainen, E., Salo, H., Buta, R., & Knapen, J. H. 2007, MNRAS, 381, 401
work page 2007
-
[39]
Marels, V., Mesa, V., Jaque Arancibia, M., et al. 2025, A&A, 699, A204
work page 2025
-
[40]
Marleau, F. R., Clancy, D., & Bianconi, M. 2013, MNRAS, 435, 3085
work page 2013
-
[41]
Martig, M., Bournaud, F., Croton, D. J., Dekel, A., & Teyssier, R. 2012, ApJ, 756, 26
work page 2012
-
[42]
Martin, G., Kaviraj, S., Volonteri, M., et al. 2018, MNRAS, 476, 2801
work page 2018
-
[43]
Masters, K. L., Lintott, C. J., Hart, R. E., et al. 2019, MNRAS, 487, 1808
work page 2019
-
[44]
Masters, K. L., Nichol, R. C., Haynes, M. P., et al. 2012, MNRAS, 424, 2180
work page 2012
-
[45]
McAlpine, S., Harrison, C. M., Rosario, D. J., et al. 2020, MNRAS, 494, 5713
work page 2020
- [46]
-
[47]
Oh, S., Oh, K., & Yi, S. K. 2012, ApJS, 198, 4
work page 2012
- [48]
- [49]
-
[50]
Rosario, D. J., Mendel, J. T., Ellison, S. L., Lutz, D., & Trump, J. R. 2016, MNRAS, 457, 2703
work page 2016
-
[51]
Salim, S., Rich, R. M., Charlot, S., et al. 2007, ApJS, 173, 267 Schawinski,K.,Koss,M.,Berney,S.,&Sartori,L.F.2015,MNRAS,451,2517
work page 2007
-
[52]
Sellwood, J. A. 2014, Reviews of Modern Physics, 86, 1
work page 2014
-
[53]
Sellwood, J. A. & Wilkinson, A. 1993, Reports on Progress in Physics, 56, 173
work page 1993
-
[54]
Shlosman, I., Frank, J., & Begelman, M. C. 1989, Nature, 338, 45 Silva-Lima,L.A.,Martins,L.P.,Coelho,P.R.T.,&Gadotti,D.A.2022,A&A, 661, A105
work page 1989
-
[55]
Simmons, B. D., Smethurst, R. J., & Lintott, C. 2017, MNRAS, 470, 1559
work page 2017
-
[56]
Skibba, R. A., Masters, K. L., Nichol, R. C., et al. 2012, MNRAS, 423, 1485
work page 2012
-
[57]
Smethurst, R. J., Beckmann, R. S., Simmons, B. D., et al. 2024, MNRAS, 527, 10855 Taylor,M.B.2005,inAstronomicalSocietyofthePacificConferenceSeries,Vol. 347,AstronomicalDataAnalysisSoftwareandSystemsXIV,ed.P.Shopbell, M. Britton, & R. Ebert, 29
work page 2024
-
[58]
Urrutia, T., Lacy, M., & Becker, R. H. 2008, ApJ, 674, 80
work page 2008
- [59]
- [60]
-
[61]
Walmsley, M., Lintott, C., Géron, T., et al. 2022, MNRAS, 509, 3966
work page 2022
-
[62]
Wang, L., Obreschkow, D., Lagos, C. d. P., et al. 2019, MNRAS, 482, 5477
work page 2019
-
[63]
Willett, K. W., Lintott, C. J., Bamford, S. P., et al. 2013, MNRAS, 435, 2835
work page 2013
-
[64]
G., Paudel, S., Moon, J.-S., & Yoon, S.-J
Zee, W.-B. G., Paudel, S., Moon, J.-S., & Yoon, S.-J. 2023, ApJ, 949, 91 Article number, page 8 I. L. Garland et al.: The complex relationships between AGN, bars and bulges Appendix A: Supplementary stellar mass, colour and bulge distributions Fig. A.1 shows the stellar mass (𝑀∗),(𝑔−𝑟) 0 colour and bulge prominence (𝐵) distributions for the LINERs, compos...
work page 2023
discussion (0)
Sign in with ORCID, Apple, or X to comment. Anyone can read and Pith papers without signing in.