pith. sign in

arxiv: 2604.01911 · v2 · submitted 2026-04-02 · 📊 stat.ME

On the uncertainty from the first-stage estimation of prognostic covariate adjustment in randomized controlled trials

Pith reviewed 2026-05-13 21:19 UTC · model grok-4.3

classification 📊 stat.ME
keywords prognostic covariate adjustmentasymptotic variancerandomized controlled trialstwo-stage estimationprognostic scoreanalysis of covariance
0
0 comments X

The pith

Estimating the prognostic score from historical data yields the same asymptotic variance for the treatment effect estimator as treating the score as known.

A machine-rendered reading of the paper's core claim, the machinery that carries it, and where it could break.

Prognostic covariate adjustment first estimates a prognostic score, the expected outcome under control given covariates, from historical data. It then fits analysis of covariance using the estimated score and treatment assignment to estimate the average treatment effect. The paper derives the asymptotic variances of this estimator under both the known-score and estimated-score cases and shows they are identical. Because the variances match, the simpler variance estimator that ignores first-stage estimation remains asymptotically valid and is recommended for routine use. Only when historical data are small does the paper suggest using the variance estimator that accounts for score estimation to obtain more conservative inference.

Core claim

The asymptotic variance of the average treatment effect estimator obtained via analysis of covariance after prognostic score estimation equals the asymptotic variance obtained when the prognostic score is treated as known.

What carries the argument

Equality of the two asymptotic variances derived for the PROCOVA estimator, one treating the prognostic score as known and the other accounting for its first-stage estimation from historical data.

If this is right

  • The variance estimator that treats the prognostic score as known is asymptotically valid.
  • This estimator is simpler to derive and implement than the one that accounts for first-stage estimation.
  • Use the known-score variance estimator unless historical data are small, in which case the estimator that accounts for estimation is preferred for conservative results.

Where Pith is reading between the lines

These are editorial extensions of the paper, not claims the author makes directly.

  • First-stage estimation uncertainty from historical data does not inflate the asymptotic variance of the treatment-effect estimator.
  • The result may apply to other two-stage procedures that adjust trial analyses with externally estimated nuisance parameters.
  • Finite-sample studies could quantify how large the historical data must be before the simpler variance estimator performs adequately.

Load-bearing premise

The derivations assume standard regularity conditions for two-stage estimators, including consistency of the prognostic score estimator and sufficiently large samples.

What would settle it

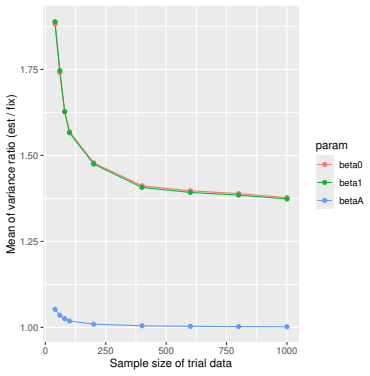
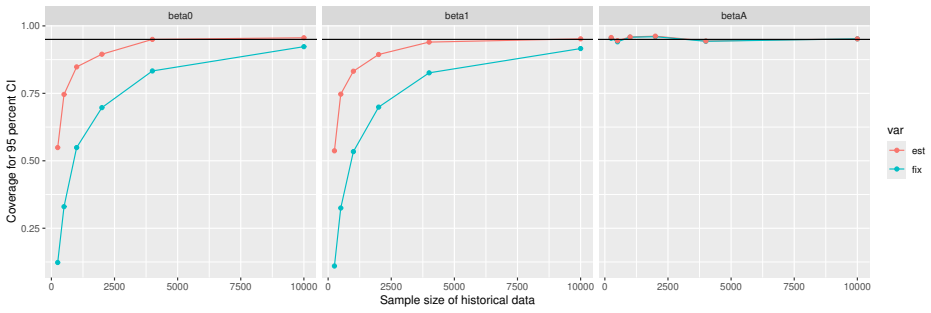
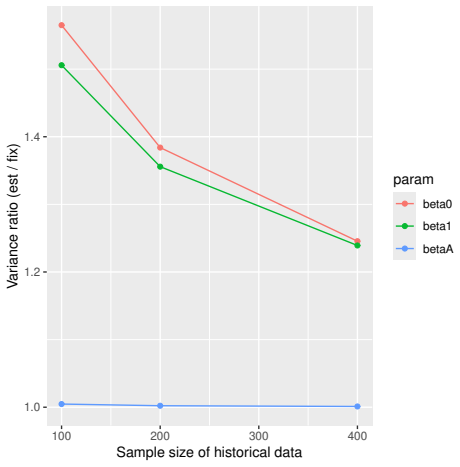
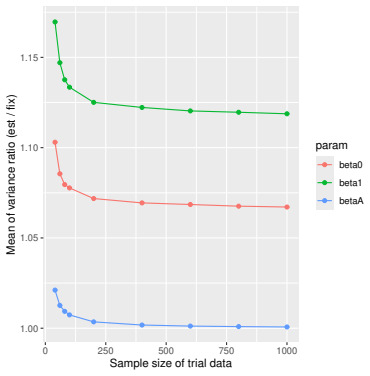
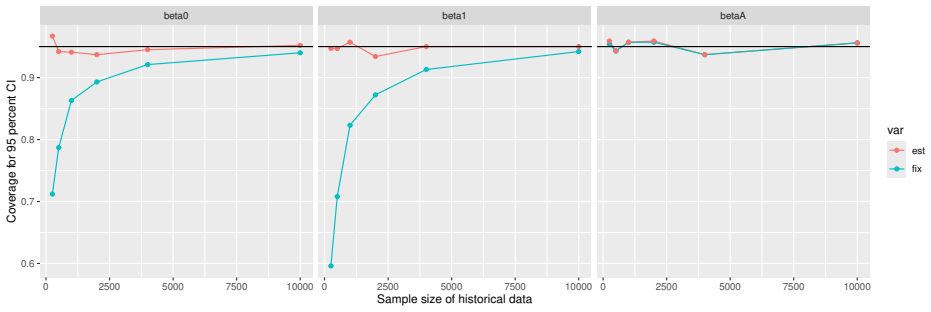
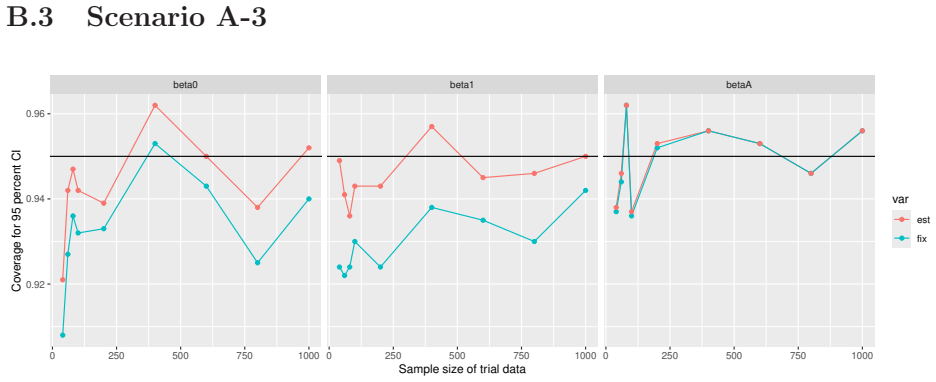
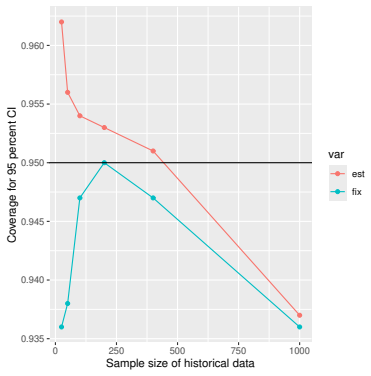
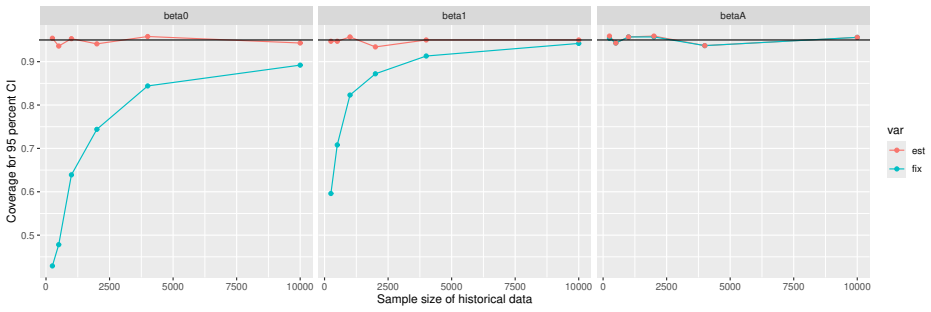
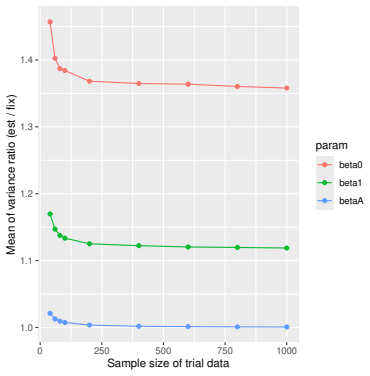
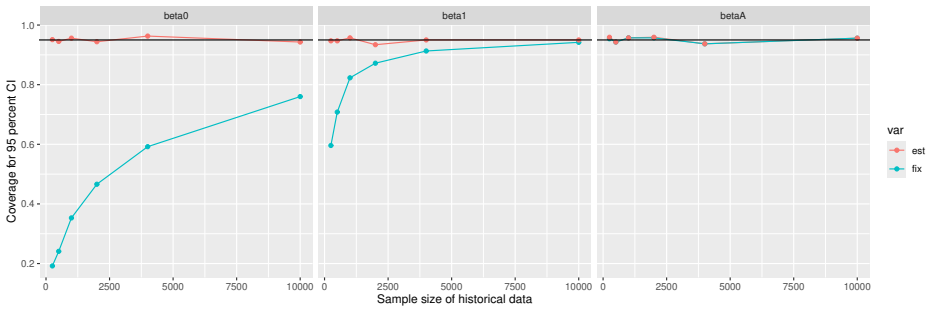
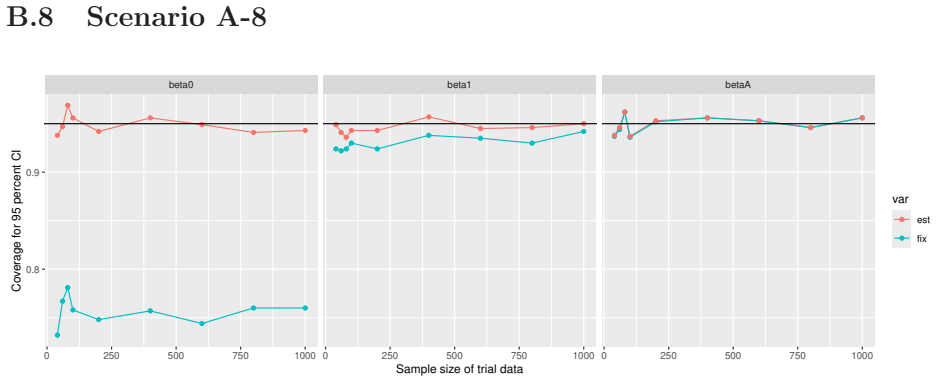
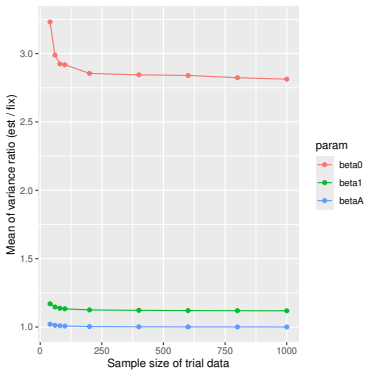
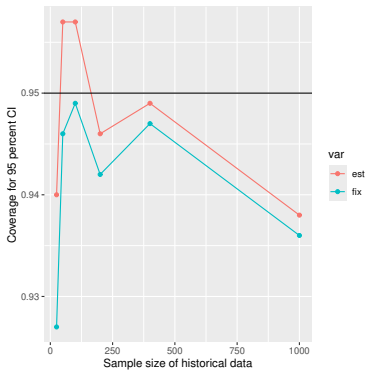
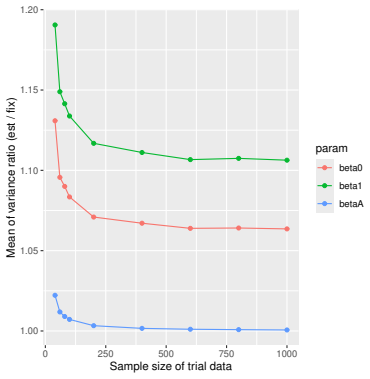
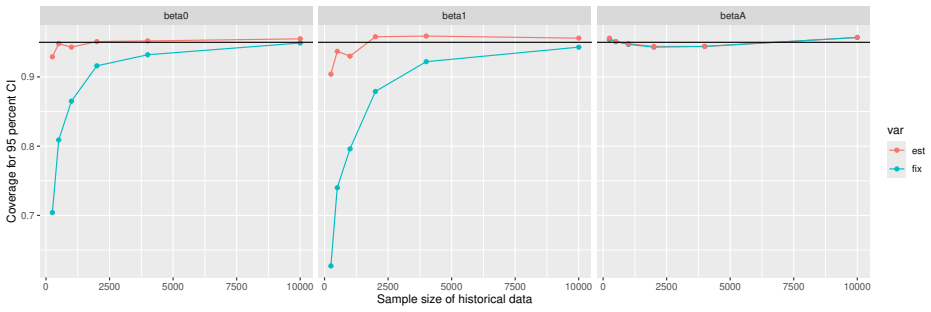
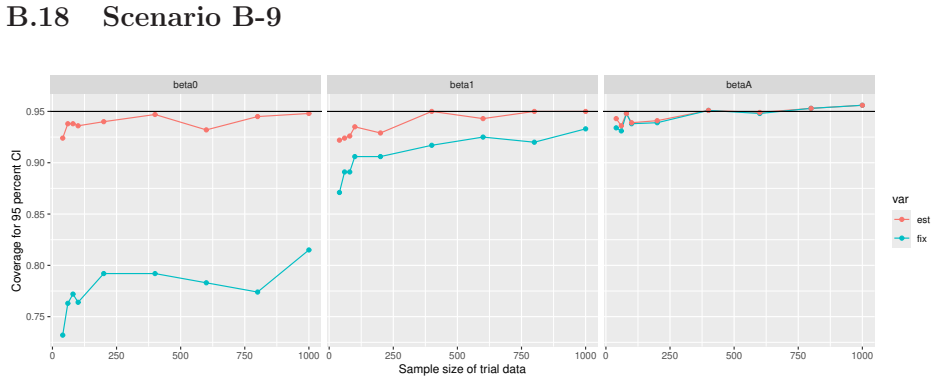
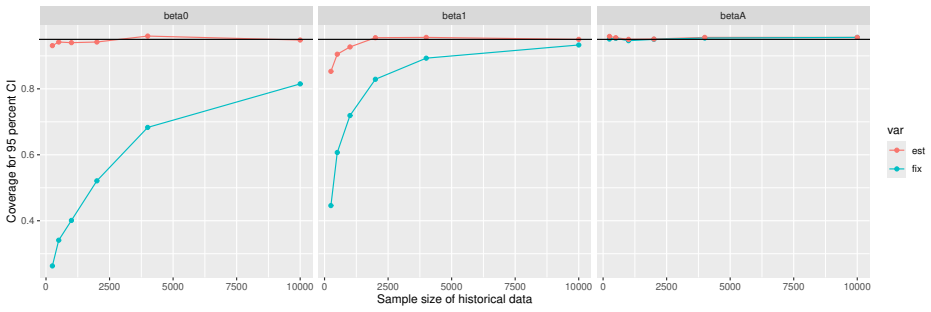
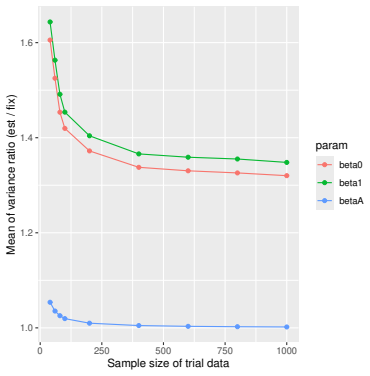
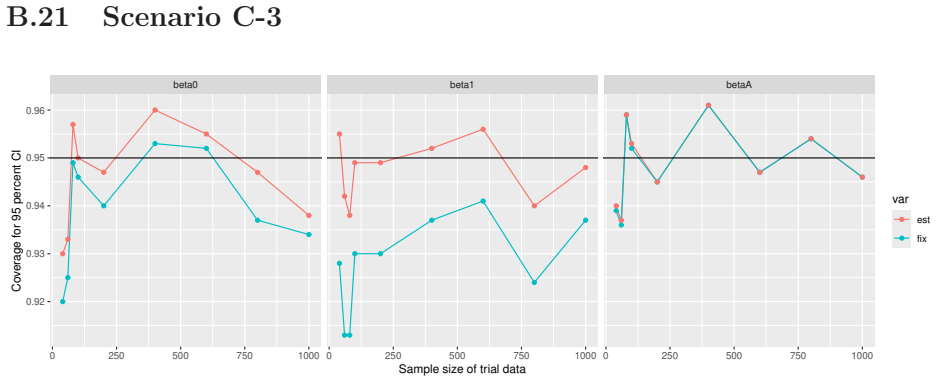
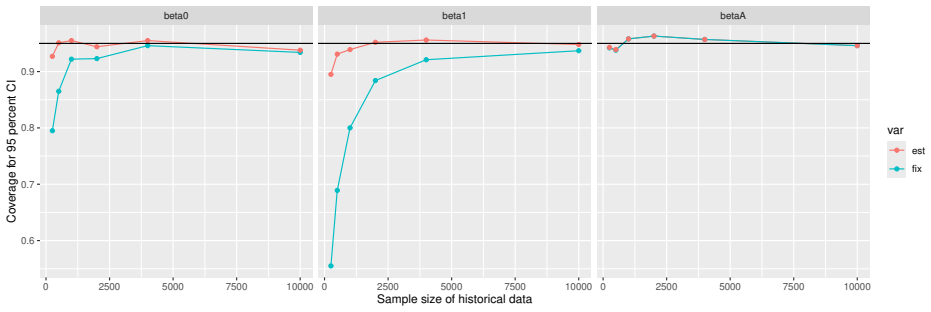
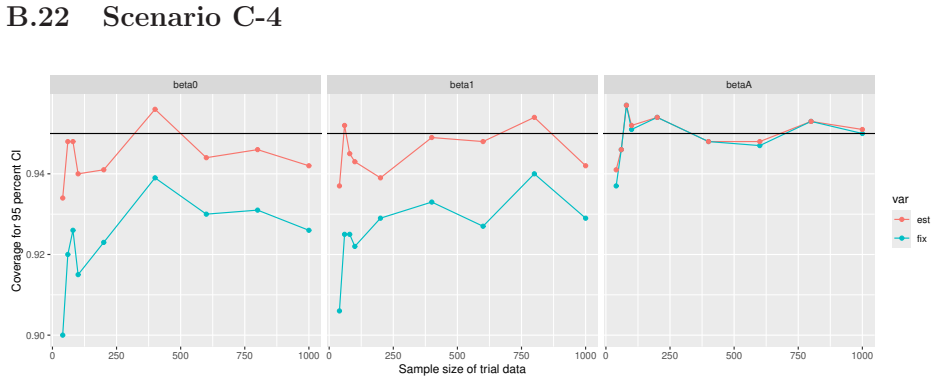
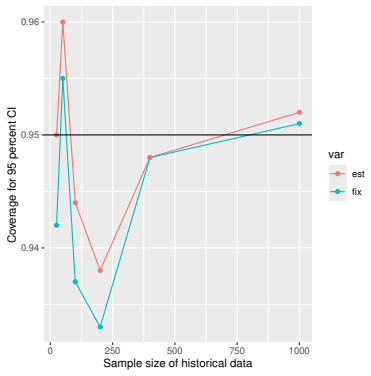
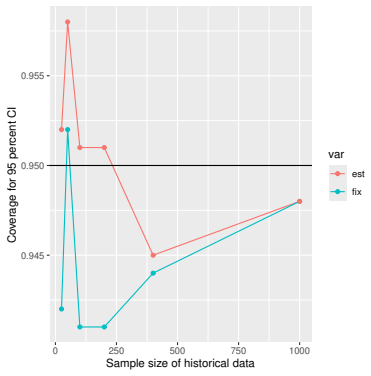
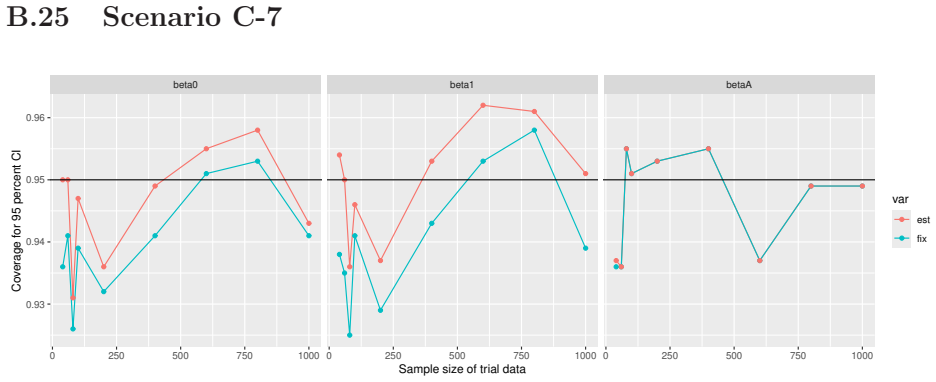
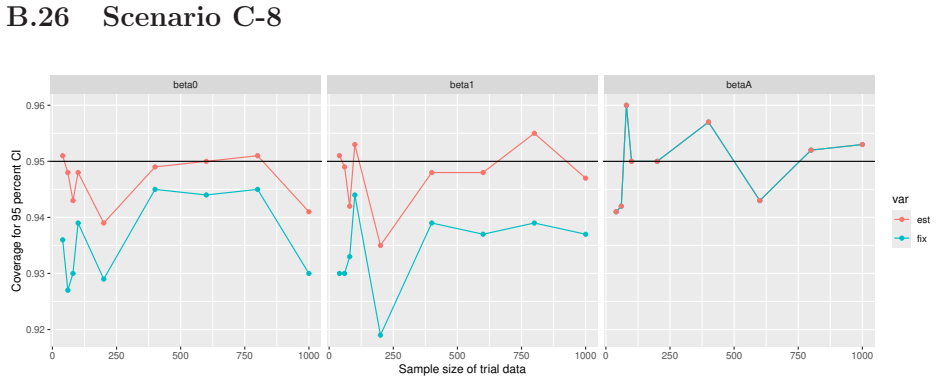
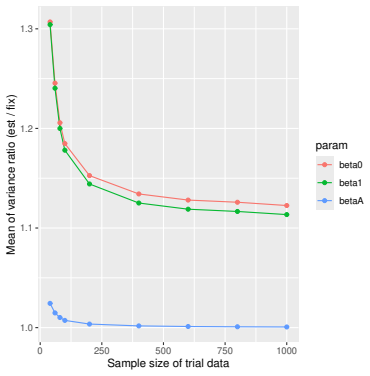
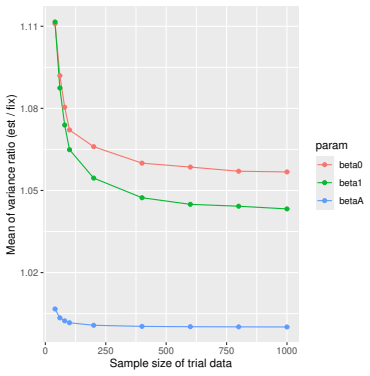
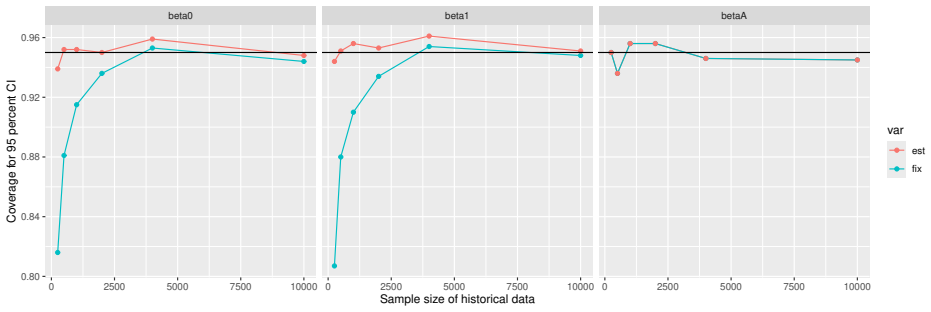
Monte Carlo simulations that compute both variance estimators for increasing sizes of historical and trial data and check whether their values and resulting confidence-interval coverage converge.

Figures

Figures reproduced from arXiv: 2604.01911 by Masataka Taguri, Nodoka Seya.

Figure 1
Figure 1. Figure 1: Plots of the coverage probability of 95 % CI over 1000 simula [PITH_FULL_IMAGE:figures/full_fig_p027_1.png] view at source ↗
Figure 2
Figure 2. Figure 2: Plots of the mean of the ratio of two variance estimators o [PITH_FULL_IMAGE:figures/full_fig_p028_2.png] view at source ↗
Figure 3
Figure 3. Figure 3: Plots of the coverage probability of the 95 % CI for [PITH_FULL_IMAGE:figures/full_fig_p029_3.png] view at source ↗
Figure 4
Figure 4. Figure 4: Plots of the coverage probability of 95 % CI over 1000 simula [PITH_FULL_IMAGE:figures/full_fig_p030_4.png] view at source ↗
Figure 5
Figure 5. Figure 5: Plots of the ratio of two variance estimators when PROCOVA [PITH_FULL_IMAGE:figures/full_fig_p032_5.png] view at source ↗
Figure 6
Figure 6. Figure 6: Plots of the coverage probability of 95 % CI over 1000 simula [PITH_FULL_IMAGE:figures/full_fig_p065_6.png] view at source ↗
Figure 7
Figure 7. Figure 7: Plots of the mean of the ratio of two variance estimators o [PITH_FULL_IMAGE:figures/full_fig_p066_7.png] view at source ↗
Figure 8
Figure 8. Figure 8: Plots of the coverage probability of the 95 % CI for [PITH_FULL_IMAGE:figures/full_fig_p067_8.png] view at source ↗
Figure 9
Figure 9. Figure 9: Plots of the coverage probability of 95 % CI over 1000 simula [PITH_FULL_IMAGE:figures/full_fig_p068_9.png] view at source ↗
Figure 10
Figure 10. Figure 10: Plots of the coverage probability of 95 % CI over 1000 simu [PITH_FULL_IMAGE:figures/full_fig_p069_10.png] view at source ↗
Figure 11
Figure 11. Figure 11: Plots of the mean of the ratio of two variance estimators [PITH_FULL_IMAGE:figures/full_fig_p070_11.png] view at source ↗
Figure 12
Figure 12. Figure 12: Plots of the coverage probability of the 95 % CI for [PITH_FULL_IMAGE:figures/full_fig_p071_12.png] view at source ↗
Figure 13
Figure 13. Figure 13: Plots of the coverage probability of 95 % CI over 1000 simu [PITH_FULL_IMAGE:figures/full_fig_p072_13.png] view at source ↗
Figure 14
Figure 14. Figure 14: Plots of the coverage probability of 95 % CI over 1000 simu [PITH_FULL_IMAGE:figures/full_fig_p073_14.png] view at source ↗
Figure 15
Figure 15. Figure 15: Plots of the mean of the ratio of two variance estimators [PITH_FULL_IMAGE:figures/full_fig_p074_15.png] view at source ↗
Figure 16
Figure 16. Figure 16: Plots of the coverage probability of the 95 % CI for [PITH_FULL_IMAGE:figures/full_fig_p075_16.png] view at source ↗
Figure 17
Figure 17. Figure 17: Plots of the coverage probability of 95 % CI over 1000 simu [PITH_FULL_IMAGE:figures/full_fig_p076_17.png] view at source ↗
Figure 18
Figure 18. Figure 18: Plots of the coverage probability of 95 % CI over 1000 simu [PITH_FULL_IMAGE:figures/full_fig_p077_18.png] view at source ↗
Figure 19
Figure 19. Figure 19: Plots of the mean of the ratio of two variance estimators [PITH_FULL_IMAGE:figures/full_fig_p078_19.png] view at source ↗
Figure 20
Figure 20. Figure 20: Plots of the coverage probability of the 95 % CI for [PITH_FULL_IMAGE:figures/full_fig_p079_20.png] view at source ↗
Figure 21
Figure 21. Figure 21: Plots of the coverage probability of 95 % CI over 1000 simu [PITH_FULL_IMAGE:figures/full_fig_p080_21.png] view at source ↗
Figure 22
Figure 22. Figure 22: Plots of the coverage probability of 95 % CI over 1000 simu [PITH_FULL_IMAGE:figures/full_fig_p081_22.png] view at source ↗
Figure 23
Figure 23. Figure 23: Plots of the mean of the ratio of two variance estimators [PITH_FULL_IMAGE:figures/full_fig_p082_23.png] view at source ↗
Figure 24
Figure 24. Figure 24: Plots of the coverage probability of the 95 % CI for [PITH_FULL_IMAGE:figures/full_fig_p083_24.png] view at source ↗
Figure 25
Figure 25. Figure 25: Plots of the coverage probability of 95 % CI over 1000 simu [PITH_FULL_IMAGE:figures/full_fig_p084_25.png] view at source ↗
Figure 26
Figure 26. Figure 26: Plots of the coverage probability of 95 % CI over 1000 simu [PITH_FULL_IMAGE:figures/full_fig_p085_26.png] view at source ↗
Figure 27
Figure 27. Figure 27: Plots of the mean of the ratio of two variance estimators [PITH_FULL_IMAGE:figures/full_fig_p086_27.png] view at source ↗
Figure 28
Figure 28. Figure 28: Plots of the coverage probability of the 95 % CI for [PITH_FULL_IMAGE:figures/full_fig_p087_28.png] view at source ↗
Figure 29
Figure 29. Figure 29: Plots of the coverage probability of 95 % CI over 1000 simu [PITH_FULL_IMAGE:figures/full_fig_p088_29.png] view at source ↗
Figure 30
Figure 30. Figure 30: Plots of the coverage probability of 95 % CI over 1000 simu [PITH_FULL_IMAGE:figures/full_fig_p089_30.png] view at source ↗
Figure 31
Figure 31. Figure 31: Plots of the mean of the ratio of two variance estimators [PITH_FULL_IMAGE:figures/full_fig_p090_31.png] view at source ↗
Figure 32
Figure 32. Figure 32: Plots of the coverage probability of the 95 % CI for [PITH_FULL_IMAGE:figures/full_fig_p091_32.png] view at source ↗
Figure 33
Figure 33. Figure 33: Plots of the coverage probability of 95 % CI over 1000 simu [PITH_FULL_IMAGE:figures/full_fig_p092_33.png] view at source ↗
Figure 34
Figure 34. Figure 34: Plots of the coverage probability of 95 % CI over 1000 simu [PITH_FULL_IMAGE:figures/full_fig_p093_34.png] view at source ↗
Figure 35
Figure 35. Figure 35: Plots of the mean of the ratio of two variance estimators [PITH_FULL_IMAGE:figures/full_fig_p094_35.png] view at source ↗
Figure 36
Figure 36. Figure 36: Plots of the coverage probability of the 95 % CI for [PITH_FULL_IMAGE:figures/full_fig_p095_36.png] view at source ↗
Figure 37
Figure 37. Figure 37: Plots of the coverage probability of 95 % CI over 1000 simu [PITH_FULL_IMAGE:figures/full_fig_p096_37.png] view at source ↗
Figure 38
Figure 38. Figure 38: Plots of the coverage probability of 95 % CI over 1000 simu [PITH_FULL_IMAGE:figures/full_fig_p097_38.png] view at source ↗
Figure 39
Figure 39. Figure 39: Plots of the mean of the ratio of two variance estimators [PITH_FULL_IMAGE:figures/full_fig_p098_39.png] view at source ↗
Figure 40
Figure 40. Figure 40: Plots of the coverage probability of the 95 % CI for [PITH_FULL_IMAGE:figures/full_fig_p099_40.png] view at source ↗
Figure 41
Figure 41. Figure 41: Plots of the coverage probability of 95 % CI over 1000 simu [PITH_FULL_IMAGE:figures/full_fig_p100_41.png] view at source ↗
Figure 42
Figure 42. Figure 42: Plots of the coverage probability of 95 % CI over 1000 simu [PITH_FULL_IMAGE:figures/full_fig_p101_42.png] view at source ↗
Figure 43
Figure 43. Figure 43: Plots of the mean of the ratio of two variance estimators [PITH_FULL_IMAGE:figures/full_fig_p102_43.png] view at source ↗
Figure 44
Figure 44. Figure 44: Plots of the coverage probability of the 95 % CI for [PITH_FULL_IMAGE:figures/full_fig_p103_44.png] view at source ↗
Figure 45
Figure 45. Figure 45: Plots of the coverage probability of 95 % CI over 1000 simu [PITH_FULL_IMAGE:figures/full_fig_p104_45.png] view at source ↗
Figure 46
Figure 46. Figure 46: Plots of the coverage probability of 95 % CI over 1000 simu [PITH_FULL_IMAGE:figures/full_fig_p105_46.png] view at source ↗
Figure 47
Figure 47. Figure 47: Plots of the mean of the ratio of two variance estimators [PITH_FULL_IMAGE:figures/full_fig_p106_47.png] view at source ↗
Figure 48
Figure 48. Figure 48: Plots of the coverage probability of the 95 % CI for [PITH_FULL_IMAGE:figures/full_fig_p107_48.png] view at source ↗
Figure 49
Figure 49. Figure 49: Plots of the coverage probability of 95 % CI over 1000 simu [PITH_FULL_IMAGE:figures/full_fig_p108_49.png] view at source ↗
Figure 50
Figure 50. Figure 50: Plots of the coverage probability of 95 % CI over 1000 simu [PITH_FULL_IMAGE:figures/full_fig_p109_50.png] view at source ↗
Figure 51
Figure 51. Figure 51: Plots of the mean of the ratio of two variance estimators [PITH_FULL_IMAGE:figures/full_fig_p110_51.png] view at source ↗
Figure 52
Figure 52. Figure 52: Plots of the coverage probability of the 95 % CI for [PITH_FULL_IMAGE:figures/full_fig_p111_52.png] view at source ↗
Figure 53
Figure 53. Figure 53: Plots of the coverage probability of 95 % CI over 1000 simu [PITH_FULL_IMAGE:figures/full_fig_p112_53.png] view at source ↗
Figure 54
Figure 54. Figure 54: Plots of the coverage probability of 95 % CI over 1000 simu [PITH_FULL_IMAGE:figures/full_fig_p113_54.png] view at source ↗
Figure 55
Figure 55. Figure 55: Plots of the mean of the ratio of two variance estimators [PITH_FULL_IMAGE:figures/full_fig_p114_55.png] view at source ↗
Figure 56
Figure 56. Figure 56: Plots of the coverage probability of the 95 % CI for [PITH_FULL_IMAGE:figures/full_fig_p115_56.png] view at source ↗
Figure 57
Figure 57. Figure 57: Plots of the coverage probability of 95 % CI over 1000 simu [PITH_FULL_IMAGE:figures/full_fig_p116_57.png] view at source ↗
Figure 58
Figure 58. Figure 58: Plots of the coverage probability of 95 % CI over 1000 simu [PITH_FULL_IMAGE:figures/full_fig_p117_58.png] view at source ↗
Figure 59
Figure 59. Figure 59: Plots of the mean of the ratio of two variance estimators [PITH_FULL_IMAGE:figures/full_fig_p118_59.png] view at source ↗
Figure 60
Figure 60. Figure 60: Plots of the coverage probability of the 95 % CI for [PITH_FULL_IMAGE:figures/full_fig_p119_60.png] view at source ↗
Figure 61
Figure 61. Figure 61: Plots of the coverage probability of 95 % CI over 1000 simu [PITH_FULL_IMAGE:figures/full_fig_p120_61.png] view at source ↗
Figure 62
Figure 62. Figure 62: Plots of the coverage probability of 95 % CI over 1000 simu [PITH_FULL_IMAGE:figures/full_fig_p121_62.png] view at source ↗
Figure 63
Figure 63. Figure 63: Plots of the mean of the ratio of two variance estimators [PITH_FULL_IMAGE:figures/full_fig_p122_63.png] view at source ↗
Figure 64
Figure 64. Figure 64: Plots of the coverage probability of the 95 % CI for [PITH_FULL_IMAGE:figures/full_fig_p123_64.png] view at source ↗
Figure 65
Figure 65. Figure 65: Plots of the coverage probability of 95 % CI over 1000 simu [PITH_FULL_IMAGE:figures/full_fig_p124_65.png] view at source ↗
Figure 66
Figure 66. Figure 66: Plots of the coverage probability of 95 % CI over 1000 simu [PITH_FULL_IMAGE:figures/full_fig_p125_66.png] view at source ↗
Figure 67
Figure 67. Figure 67: Plots of the mean of the ratio of two variance estimators [PITH_FULL_IMAGE:figures/full_fig_p126_67.png] view at source ↗
Figure 68
Figure 68. Figure 68: Plots of the coverage probability of the 95 % CI for [PITH_FULL_IMAGE:figures/full_fig_p127_68.png] view at source ↗
Figure 69
Figure 69. Figure 69: Plots of the coverage probability of 95 % CI over 1000 simu [PITH_FULL_IMAGE:figures/full_fig_p128_69.png] view at source ↗
Figure 70
Figure 70. Figure 70: Plots of the coverage probability of 95 % CI over 1000 simu [PITH_FULL_IMAGE:figures/full_fig_p129_70.png] view at source ↗
Figure 71
Figure 71. Figure 71: Plots of the mean of the ratio of two variance estimators [PITH_FULL_IMAGE:figures/full_fig_p130_71.png] view at source ↗
Figure 72
Figure 72. Figure 72: Plots of the coverage probability of the 95 % CI for [PITH_FULL_IMAGE:figures/full_fig_p131_72.png] view at source ↗
Figure 73
Figure 73. Figure 73: Plots of the coverage probability of 95 % CI over 1000 simu [PITH_FULL_IMAGE:figures/full_fig_p132_73.png] view at source ↗
Figure 74
Figure 74. Figure 74: Plots of the coverage probability of 95 % CI over 1000 simu [PITH_FULL_IMAGE:figures/full_fig_p133_74.png] view at source ↗
Figure 75
Figure 75. Figure 75: Plots of the mean of the ratio of two variance estimators [PITH_FULL_IMAGE:figures/full_fig_p134_75.png] view at source ↗
Figure 76
Figure 76. Figure 76: Plots of the coverage probability of the 95 % CI for [PITH_FULL_IMAGE:figures/full_fig_p135_76.png] view at source ↗
Figure 77
Figure 77. Figure 77: Plots of the coverage probability of 95 % CI over 1000 simu [PITH_FULL_IMAGE:figures/full_fig_p136_77.png] view at source ↗
Figure 78
Figure 78. Figure 78: Plots of the coverage probability of 95 % CI over 1000 simu [PITH_FULL_IMAGE:figures/full_fig_p137_78.png] view at source ↗
Figure 79
Figure 79. Figure 79: Plots of the mean of the ratio of two variance estimators [PITH_FULL_IMAGE:figures/full_fig_p138_79.png] view at source ↗
Figure 80
Figure 80. Figure 80: Plots of the coverage probability of the 95 % CI for [PITH_FULL_IMAGE:figures/full_fig_p139_80.png] view at source ↗
Figure 81
Figure 81. Figure 81: Plots of the coverage probability of 95 % CI over 1000 simu [PITH_FULL_IMAGE:figures/full_fig_p140_81.png] view at source ↗
Figure 82
Figure 82. Figure 82: Plots of the coverage probability of 95 % CI over 1000 simu [PITH_FULL_IMAGE:figures/full_fig_p141_82.png] view at source ↗
Figure 83
Figure 83. Figure 83: Plots of the mean of the ratio of two variance estimators [PITH_FULL_IMAGE:figures/full_fig_p142_83.png] view at source ↗
Figure 84
Figure 84. Figure 84: Plots of the coverage probability of the 95 % CI for [PITH_FULL_IMAGE:figures/full_fig_p143_84.png] view at source ↗
Figure 85
Figure 85. Figure 85: Plots of the coverage probability of 95 % CI over 1000 simu [PITH_FULL_IMAGE:figures/full_fig_p144_85.png] view at source ↗
Figure 86
Figure 86. Figure 86: Plots of the coverage probability of 95 % CI over 1000 simu [PITH_FULL_IMAGE:figures/full_fig_p145_86.png] view at source ↗
Figure 87
Figure 87. Figure 87: Plots of the mean of the ratio of two variance estimators [PITH_FULL_IMAGE:figures/full_fig_p146_87.png] view at source ↗
Figure 88
Figure 88. Figure 88: Plots of the coverage probability of the 95 % CI for [PITH_FULL_IMAGE:figures/full_fig_p147_88.png] view at source ↗
Figure 89
Figure 89. Figure 89: Plots of the coverage probability of 95 % CI over 1000 simu [PITH_FULL_IMAGE:figures/full_fig_p148_89.png] view at source ↗
Figure 90
Figure 90. Figure 90: Plots of the coverage probability of 95 % CI over 1000 simu [PITH_FULL_IMAGE:figures/full_fig_p149_90.png] view at source ↗
Figure 91
Figure 91. Figure 91: Plots of the mean of the ratio of two variance estimators [PITH_FULL_IMAGE:figures/full_fig_p150_91.png] view at source ↗
Figure 92
Figure 92. Figure 92: Plots of the coverage probability of the 95 % CI for [PITH_FULL_IMAGE:figures/full_fig_p151_92.png] view at source ↗
Figure 93
Figure 93. Figure 93: Plots of the coverage probability of 95 % CI over 1000 simu [PITH_FULL_IMAGE:figures/full_fig_p152_93.png] view at source ↗
Figure 94
Figure 94. Figure 94: Plots of the coverage probability of 95 % CI over 1000 simu [PITH_FULL_IMAGE:figures/full_fig_p153_94.png] view at source ↗
Figure 95
Figure 95. Figure 95: Plots of the mean of the ratio of two variance estimators [PITH_FULL_IMAGE:figures/full_fig_p154_95.png] view at source ↗
Figure 96
Figure 96. Figure 96: Plots of the coverage probability of the 95 % CI for [PITH_FULL_IMAGE:figures/full_fig_p155_96.png] view at source ↗
Figure 97
Figure 97. Figure 97: Plots of the coverage probability of 95 % CI over 1000 simu [PITH_FULL_IMAGE:figures/full_fig_p156_97.png] view at source ↗
Figure 98
Figure 98. Figure 98: Plots of the coverage probability of 95 % CI over 1000 simu [PITH_FULL_IMAGE:figures/full_fig_p157_98.png] view at source ↗
Figure 99
Figure 99. Figure 99: Plots of the mean of the ratio of two variance estimators [PITH_FULL_IMAGE:figures/full_fig_p158_99.png] view at source ↗
Figure 100
Figure 100. Figure 100: Plots of the coverage probability of the 95 % CI for [PITH_FULL_IMAGE:figures/full_fig_p159_100.png] view at source ↗
Figure 101
Figure 101. Figure 101: Plots of the coverage probability of 95 % CI over 1000 sim [PITH_FULL_IMAGE:figures/full_fig_p160_101.png] view at source ↗
Figure 102
Figure 102. Figure 102: Plots of the coverage probability of 95 % CI over 1000 sim [PITH_FULL_IMAGE:figures/full_fig_p161_102.png] view at source ↗
Figure 103
Figure 103. Figure 103: Plots of the mean of the ratio of two variance estimator [PITH_FULL_IMAGE:figures/full_fig_p162_103.png] view at source ↗
Figure 104
Figure 104. Figure 104: Plots of the coverage probability of the 95 % CI for [PITH_FULL_IMAGE:figures/full_fig_p163_104.png] view at source ↗
Figure 105
Figure 105. Figure 105: Plots of the coverage probability of 95 % CI over 1000 sim [PITH_FULL_IMAGE:figures/full_fig_p164_105.png] view at source ↗
Figure 106
Figure 106. Figure 106: Plots of the coverage probability of 95 % CI over 1000 sim [PITH_FULL_IMAGE:figures/full_fig_p165_106.png] view at source ↗
Figure 107
Figure 107. Figure 107: Plots of the mean of the ratio of two variance estimator [PITH_FULL_IMAGE:figures/full_fig_p166_107.png] view at source ↗
Figure 108
Figure 108. Figure 108: Plots of the coverage probability of the 95 % CI for [PITH_FULL_IMAGE:figures/full_fig_p167_108.png] view at source ↗
Figure 109
Figure 109. Figure 109: Plots of the coverage probability of 95 % CI over 1000 sim [PITH_FULL_IMAGE:figures/full_fig_p168_109.png] view at source ↗
Figure 110
Figure 110. Figure 110: Plots of the coverage probability of 95 % CI over 1000 sim [PITH_FULL_IMAGE:figures/full_fig_p169_110.png] view at source ↗
Figure 111
Figure 111. Figure 111: Plots of the mean of the ratio of two variance estimator [PITH_FULL_IMAGE:figures/full_fig_p170_111.png] view at source ↗
Figure 112
Figure 112. Figure 112: Plots of the coverage probability of the 95 % CI for [PITH_FULL_IMAGE:figures/full_fig_p171_112.png] view at source ↗
Figure 113
Figure 113. Figure 113: Plots of the coverage probability of 95 % CI over 1000 sim [PITH_FULL_IMAGE:figures/full_fig_p172_113.png] view at source ↗
Figure 114
Figure 114. Figure 114: Plots of the coverage probability of 95 % CI over 1000 sim [PITH_FULL_IMAGE:figures/full_fig_p173_114.png] view at source ↗
Figure 115
Figure 115. Figure 115: Plots of the mean of the ratio of two variance estimator [PITH_FULL_IMAGE:figures/full_fig_p174_115.png] view at source ↗
Figure 116
Figure 116. Figure 116: Plots of the coverage probability of the 95 % CI for [PITH_FULL_IMAGE:figures/full_fig_p175_116.png] view at source ↗
Figure 117
Figure 117. Figure 117: Plots of the coverage probability of 95 % CI over 1000 sim [PITH_FULL_IMAGE:figures/full_fig_p176_117.png] view at source ↗
Figure 118
Figure 118. Figure 118: Plots of the coverage probability of 95 % CI over 1000 sim [PITH_FULL_IMAGE:figures/full_fig_p177_118.png] view at source ↗
Figure 119
Figure 119. Figure 119: Plots of the mean of the ratio of two variance estimator [PITH_FULL_IMAGE:figures/full_fig_p178_119.png] view at source ↗
Figure 120
Figure 120. Figure 120: Plots of the coverage probability of the 95 % CI for [PITH_FULL_IMAGE:figures/full_fig_p179_120.png] view at source ↗
Figure 121
Figure 121. Figure 121: Plots of the coverage probability of 95 % CI over 1000 sim [PITH_FULL_IMAGE:figures/full_fig_p180_121.png] view at source ↗
Figure 122
Figure 122. Figure 122: Plots of the coverage probability of 95 % CI over 1000 sim [PITH_FULL_IMAGE:figures/full_fig_p181_122.png] view at source ↗
Figure 123
Figure 123. Figure 123: Plots of the mean of the ratio of two variance estimator [PITH_FULL_IMAGE:figures/full_fig_p182_123.png] view at source ↗
Figure 124
Figure 124. Figure 124: Plots of the coverage probability of the 95 % CI for [PITH_FULL_IMAGE:figures/full_fig_p183_124.png] view at source ↗
Figure 125
Figure 125. Figure 125: Plots of the coverage probability of 95 % CI over 1000 sim [PITH_FULL_IMAGE:figures/full_fig_p184_125.png] view at source ↗
Figure 126
Figure 126. Figure 126: Plots of the coverage probability of 95 % CI over 1000 sim [PITH_FULL_IMAGE:figures/full_fig_p185_126.png] view at source ↗
Figure 127
Figure 127. Figure 127: Plots of the mean of the ratio of two variance estimator [PITH_FULL_IMAGE:figures/full_fig_p186_127.png] view at source ↗
Figure 128
Figure 128. Figure 128: Plots of the coverage probability of the 95 % CI for [PITH_FULL_IMAGE:figures/full_fig_p187_128.png] view at source ↗
Figure 129
Figure 129. Figure 129: Plots of the coverage probability of 95 % CI over 1000 sim [PITH_FULL_IMAGE:figures/full_fig_p188_129.png] view at source ↗
Figure 130
Figure 130. Figure 130: Plots of the coverage probability of 95 % CI over 1000 sim [PITH_FULL_IMAGE:figures/full_fig_p189_130.png] view at source ↗
Figure 131
Figure 131. Figure 131: Plots of the mean of the ratio of two variance estimator [PITH_FULL_IMAGE:figures/full_fig_p190_131.png] view at source ↗
Figure 132
Figure 132. Figure 132: Plots of the coverage probability of the 95 % CI for [PITH_FULL_IMAGE:figures/full_fig_p191_132.png] view at source ↗
Figure 133
Figure 133. Figure 133: Plots of the coverage probability of 95 % CI over 1000 sim [PITH_FULL_IMAGE:figures/full_fig_p192_133.png] view at source ↗
Figure 134
Figure 134. Figure 134: Plots of the coverage probability of 95 % CI over 1000 sim [PITH_FULL_IMAGE:figures/full_fig_p193_134.png] view at source ↗
Figure 135
Figure 135. Figure 135: Plots of the mean of the ratio of two variance estimator [PITH_FULL_IMAGE:figures/full_fig_p194_135.png] view at source ↗
Figure 136
Figure 136. Figure 136: Plots of the coverage probability of the 95 % CI for [PITH_FULL_IMAGE:figures/full_fig_p195_136.png] view at source ↗
Figure 137
Figure 137. Figure 137: Plots of the coverage probability of 95 % CI over 1000 sim [PITH_FULL_IMAGE:figures/full_fig_p196_137.png] view at source ↗
Figure 138
Figure 138. Figure 138: Plots of the coverage probability of 95 % CI over 1000 sim [PITH_FULL_IMAGE:figures/full_fig_p197_138.png] view at source ↗
Figure 139
Figure 139. Figure 139: Plots of the mean of the ratio of two variance estimator [PITH_FULL_IMAGE:figures/full_fig_p198_139.png] view at source ↗
Figure 140
Figure 140. Figure 140: Plots of the coverage probability of the 95 % CI for [PITH_FULL_IMAGE:figures/full_fig_p199_140.png] view at source ↗
Figure 141
Figure 141. Figure 141: Plots of the coverage probability of 95 % CI over 1000 sim [PITH_FULL_IMAGE:figures/full_fig_p200_141.png] view at source ↗
Figure 142
Figure 142. Figure 142: Plots of the coverage probability of 95 % CI over 1000 sim [PITH_FULL_IMAGE:figures/full_fig_p201_142.png] view at source ↗
Figure 143
Figure 143. Figure 143: Plots of the mean of the ratio of two variance estimator [PITH_FULL_IMAGE:figures/full_fig_p202_143.png] view at source ↗
Figure 144
Figure 144. Figure 144: Plots of the coverage probability of the 95 % CI for [PITH_FULL_IMAGE:figures/full_fig_p203_144.png] view at source ↗
Figure 145
Figure 145. Figure 145: Plots of the coverage probability of 95 % CI over 1000 sim [PITH_FULL_IMAGE:figures/full_fig_p204_145.png] view at source ↗
read the original abstract

Prognostic covariate adjustment (PROCOVA) is a two-sample two-stage estimation method used in randomized controlled trials. In the first stage, a prognostic score, defined as the conditional expectation of an outcome given covariates under the control treatment, is estimated using historical data. In the second stage, analysis of covariance with the estimated prognostic score and treatment assignment as explanatory variables is performed, and the average treatment effect is estimated. Although the prognostic score is estimated in this procedure, the variance estimator, which treats the prognostic score as known, has been used. Furthermore, the difference in the asymptotic variance between cases where the prognostic score is known versus where it is estimated has not been previously clarified. In this study, we derived these two asymptotic variances and showed that they are equal. We also constructed two variance estimator: one that treats the prognostic score as known, and another that accounts for its estimation, and compared their performance through simulation studies and data applications. For PROCOVA, since both variance estimators are asymptotically valid, it is generally recommended to use a variance estimator that treats the prognostic score as known, as it is simpler to derive and implement. However, when historical data is small, a variance estimator that explicitly accounts for prognostic score estimation is recommended if conservative inference is preferred.

Editorial analysis

A structured set of objections, weighed in public.

Desk editor's note, referee report, simulated authors' rebuttal, and a circularity audit. Tearing a paper down is the easy half of reading it; the pith above is the substance, this is the friction.

Referee Report

1 major / 2 minor

Summary. The paper derives the asymptotic variance of the average treatment effect estimator under prognostic covariate adjustment (PROCOVA) in randomized trials. It shows via two-stage asymptotic expansion that this variance is identical whether the prognostic score (conditional expectation under control) is treated as known or estimated from independent historical data. The authors construct two variance estimators—one treating the score as known and one accounting for its estimation—then compare them in simulations and real-data applications, recommending the simpler known-score estimator except when historical samples are small.

Significance. The equality result supplies a theoretical justification for routine use of the simpler variance estimator that ignores first-stage uncertainty, which is easier to derive and implement. By clarifying that first-stage estimation does not inflate the leading asymptotic variance term under standard regularity and independence conditions, the work removes a practical barrier to wider adoption of PROCOVA while still offering a conservative alternative for small historical data. The simulation and application comparisons provide useful finite-sample guidance.

major comments (1)
  1. [Theoretical derivation (around the asymptotic expansion)] The central equality rests on the cross-term between first-stage estimation error and the second-stage score vanishing at o_p(1/sqrt(n)). The manuscript should explicitly display this step (including the role of independence between historical and trial samples) rather than invoking it only by reference to standard two-stage theory.
minor comments (2)
  1. [Abstract and §5] In the abstract and recommendation paragraph, state the precise regularity conditions (correct model specification or consistency of the prognostic estimator, rate requirements on historical sample size) under which the equality and validity of both variance estimators hold.
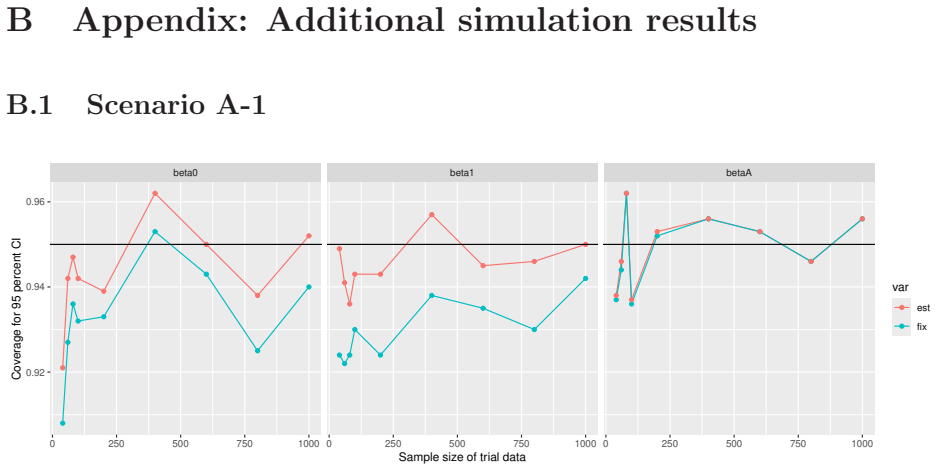
  2. [Simulation studies] Clarify in the simulation design whether the historical sample size is varied independently of the trial sample size, and report coverage probabilities for both variance estimators across the full range of historical sizes examined.

Simulated Author's Rebuttal

1 responses · 0 unresolved

We appreciate the referee's positive summary and recommendation for minor revision. We address the major comment point by point below.

read point-by-point responses
  1. Referee: [Theoretical derivation (around the asymptotic expansion)] The central equality rests on the cross-term between first-stage estimation error and the second-stage score vanishing at o_p(1/sqrt(n)). The manuscript should explicitly display this step (including the role of independence between historical and trial samples) rather than invoking it only by reference to standard two-stage theory.

    Authors: We agree that making this step explicit will clarify the derivation. In the revised manuscript, we will expand the asymptotic expansion to explicitly demonstrate that the cross-term between the first-stage estimation error and the second-stage score vanishes at o_p(1/sqrt(n)). This follows directly from the independence of the historical data (used to estimate the prognostic score) and the randomized trial sample, under standard regularity conditions. We will include a detailed calculation or lemma showing this cancellation, rather than only referencing general two-stage theory. revision: yes

Circularity Check

0 steps flagged

No significant circularity; derivation relies on standard two-stage asymptotics

full rationale

The paper's central claim is that the asymptotic variance of the PROCOVA estimator is identical whether the prognostic score is treated as known or estimated from independent historical data. This equality follows from a standard two-stage asymptotic expansion: the estimator is expanded around the true conditional expectation, the first-stage estimation error contributes an o_p(1/sqrt(n)) term whose covariance with the second-stage score vanishes under the maintained independence between historical and trial data plus standard regularity conditions. No step reduces to a self-definition, a fitted parameter renamed as a prediction, or a load-bearing self-citation whose content is itself unverified; the argument is self-contained against external asymptotic theory and does not import uniqueness theorems or ansatzes from the authors' prior work.

Axiom & Free-Parameter Ledger

0 free parameters · 1 axioms · 0 invented entities

The claim rests on standard regularity conditions for asymptotic normality of two-stage estimators in randomized trials; no free parameters or invented entities are introduced.

axioms (1)
  • standard math Standard regularity conditions for asymptotic expansions of two-stage estimators (consistency of first-stage estimator, bounded moments, correct model specification or at least consistency)
    Invoked to equate the two asymptotic variances and to justify the variance estimators.

pith-pipeline@v0.9.0 · 5526 in / 1111 out tokens · 44915 ms · 2026-05-13T21:19:04.767807+00:00 · methodology

discussion (0)

Sign in with ORCID, Apple, or X to comment. Anyone can read and Pith papers without signing in.

Lean theorems connected to this paper

Citations machine-checked in the Pith Canon. Every link opens the source theorem in the public Lean library.

What do these tags mean?
matches
The paper's claim is directly supported by a theorem in the formal canon.
supports
The theorem supports part of the paper's argument, but the paper may add assumptions or extra steps.
extends
The paper goes beyond the formal theorem; the theorem is a base layer rather than the whole result.
uses
The paper appears to rely on the theorem as machinery.
contradicts
The paper's claim conflicts with a theorem or certificate in the canon.
unclear
Pith found a possible connection, but the passage is too broad, indirect, or ambiguous to say the theorem truly supports the claim.

Reference graph

Works this paper leans on

4 extracted references · 4 canonical work pages

  1. [1]

    By (A2) and (A3), { ∂ ∂β ⊤ Ψ n(β, ¯θ˜n) ⏐ ⏐ ⏐ ⏐β = ˆβ (¯θ˜n) } − 1 p → Q− 1 0 , and { ∂ ∂θ⊤ Ψ n( ˆβn(θ),θ ) ⏐ ⏐ ⏐ ⏐θ=¯θ˜n } p → Q1

    into ( 15): ˆβn(ˆθ˜n) − ˆβn(θ∗) = − { ∂ ∂β ⊤ Ψ n(β, ¯θ˜n) ⏐ ⏐ ⏐ ⏐β = ˆβ (¯θ˜n) } − 1 { ∂ ∂θ⊤ Ψ n( ˆβn(θ),θ ) ⏐ ⏐ ⏐ ⏐θ=¯θ˜n } (ˆθ˜n − θ∗). By (A2) and (A3), { ∂ ∂β ⊤ Ψ n(β, ¯θ˜n) ⏐ ⏐ ⏐ ⏐β = ˆβ (¯θ˜n) } − 1 p → Q− 1 0 , and { ∂ ∂θ⊤ Ψ n( ˆβn(θ),θ ) ⏐ ⏐ ⏐ ⏐θ=¯θ˜n } p → Q1. Thus, the following holds: ˆβn(ˆθ˜n) − ˆβn(θ∗) = −Q− 1 0 Q1(ˆθ˜n − θ∗) +op(∥ˆθ˜n − θ∗∥)...

  2. [2]

    can be expressed as follows: ψ (O;β,θ ) = (Y − β ⊤Xθ)Xθ =       Y − β ⊤Xθ (Y − β ⊤Xθ)A (Y − β ⊤Xθ)θ⊤W       =       Y − β0 − βAA − β1θ⊤W (Y − β0 − βAA − β1θ⊤W )A (Y − β0 − βAA − β1θ⊤W )θ⊤W       . Thus,Q0 can be expressed as follows: Q0 = E [ ∂ ∂β ⊤ ψ (O;β,θ ∗) ⏐ ⏐ ⏐ β =β ∗ ] = E [ ∂ ∂β ⊤ (Y − β ⊤Xθ∗ )Xθ∗ ⏐ ⏐ ⏐ β =β ∗ ] = − E[Xθ∗X ...

  3. [3]

    Then, the following holds: √ n { ˆβ emp n (ˆθ˜n) − ˆβ emp n (θ∗) } = √ n { ˆβn(ˆθ˜n) − ˆβn(θ∗) } +op(1)

    Additionally, assume E[Y 2]< ∞ and E[||W ||2]< ∞ . Then, the following holds: √ n { ˆβ emp n (ˆθ˜n) − ˆβ emp n (θ∗) } = √ n { ˆβn(ˆθ˜n) − ˆβn(θ∗) } +op(1). Proof. By denoting ¯Dθ := 1 n n∑ j=1 θ⊤Wj − E[θ⊤W ], the following holds: θ⊤Wi − 1 n n∑ j=1 θ⊤Wj =θ⊤Wi − E[θ⊤W ] − ¯Dθ. Then, the following holds: X emp θ,i =Bn(θ)Xθ,i, where Bn(θ) =          ...

  4. [4]

    beta0”, “betaA, “beta1

    can be expressed as follows: ψ (O;β,θ ) = (Y − β ⊤Xθ)Xθ =       Y − β ⊤Xθ (Y − β ⊤Xθ)A (Y − β ⊤Xθ)(θ⊤W − E[θ⊤W ])       =       Y − β0 − βAA − β1(θ⊤W − E[θ⊤W ]) {Y − β0 − βAA − β1(θ⊤W − E[θ⊤W ])}A {Y − β0 − βAA − β1(θ⊤W − E[θ⊤W ])}(θ⊤W − E[θ⊤W ])       . Thus,Q0 can be expressed as follows: Q0 = E [ ∂ ∂β ⊤ ψ (O;β,θ ∗) ⏐ ⏐ ⏐ β =β ∗ ...