Recognition: 2 theorem links
· Lean TheoremFinancial Anomaly Detection for the Canadian Market
Pith reviewed 2026-05-13 20:29 UTC · model grok-4.3
The pith
Neural network methods and topological data analysis outperform PCA at detecting financial stress events in Canadian TSX-60 data.
A machine-rendered reading of the paper's core claim, the machinery that carries it, and where it could break.
Core claim
Neural network-based methods such as GlocalKD and One-Shot GIN(E) together with topological data analysis achieve the strongest performance on TSX-60 data for identifying major financial stress events, while principal component analysis performs less well; the success of topological data analysis indicates that global topological properties distinguish these events.
What carries the argument
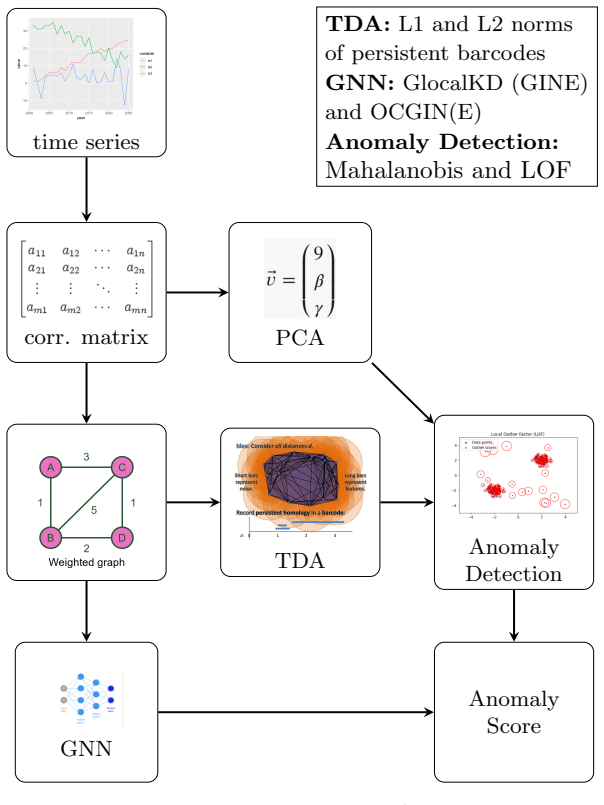
Direct comparison of topological data analysis, principal component analysis, and neural network models applied to daily returns of TSX-60 constituents to flag anomalies aligned with financial stress periods.
If this is right
- Topological summaries of stock relationships can serve as practical features for anomaly detection in equity markets.
- Neural network approaches and topological methods can be used together or as alternatives when monitoring Canadian indices.
- Global shape properties of return data carry information that linear dimensionality reduction misses.
- Performance rankings observed on TSX-60 may guide method selection for similar small-cap or index-based monitoring tasks.
Where Pith is reading between the lines
- Markets may exhibit detectable topological signatures during stress that persist across different economic regimes.
- Applying the same pipeline to other national indices could test whether the topological advantage holds outside Canada.
- Hybrid models that feed topological features into neural detectors might improve precision on sparse stress events.
Load-bearing premise
The detected anomalies line up with actual major financial stress events in the historical TSX-60 record without additional independent validation.
What would settle it
A manual timeline check that shows the dates flagged by the top methods do not match documented Canadian market stress periods or major global events affecting Canadian equities.
Figures


read the original abstract
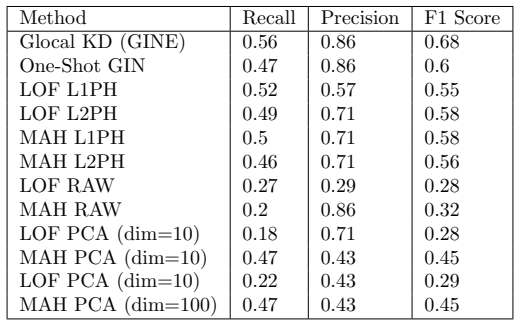
In this work we evaluate the performance of three classes of methods for detecting financial anomalies: topological data analysis (TDA), principal component analyis (PCA), and Neural Network-based approaches. We apply these methods to the TSX-60 data to identify major financial stress events in the Canadian stock market. We show how neural network-based methods (such as GlocalKD and One-Shot GIN(E)) and TDA methods achieve the strongest performance. The effectiveness of TDA in detecting financial anomalies suggests that global topological properties are meaningful in distinguishing financial stress events.
Editorial analysis
A structured set of objections, weighed in public.
Referee Report
Summary. The manuscript evaluates topological data analysis (TDA), principal component analysis (PCA), and neural network-based methods (including GlocalKD and One-Shot GIN(E)) for anomaly detection on TSX-60 Canadian market data. It claims that the neural network and TDA approaches achieve the strongest performance at identifying major financial stress events and concludes that global topological properties are therefore meaningful for distinguishing such events.
Significance. If the performance rankings were supported by explicit metrics, baselines, and a reproducible mapping to documented stress events, the work could usefully extend TDA applications into financial monitoring. The current absence of quantitative results and validation details prevents any assessment of whether the topological-interpretation claim adds new insight beyond existing anomaly-detection literature.
major comments (3)
- [Abstract] Abstract: the claim that GlocalKD, One-Shot GIN(E), and TDA methods achieve the strongest performance is unsupported because no metrics (precision, recall, F1, AUC), baselines, error bars, or statistical tests are supplied.
- [Results] Results section: no ground-truth definition, labeled list of TSX-60 stress events, labeling rule, or overlap metric is described, so the reported superiority cannot be distinguished from internal reconstruction error and the topological-meaning claim remains untestable.
- [Methodology] Methodology: the paper provides no description of the TDA pipeline (filtration function, persistence diagram construction, or distance metric to anomaly scores) or how it is aligned with the PCA and neural-network pipelines for a fair comparison.
minor comments (2)
- Define all acronyms (TDA, PCA, GIN, GlocalKD) on first use and ensure consistent notation for method names throughout.
- [Data] Add the time span and number of observations in the TSX-60 dataset to the abstract or data section for reproducibility.
Simulated Author's Rebuttal
We appreciate the referee's detailed feedback on our manuscript. We agree that the current version lacks sufficient quantitative support and methodological details, which are essential for validating our claims. We will make major revisions to address these points by adding the requested metrics, ground-truth definitions, and pipeline descriptions.
read point-by-point responses
-
Referee: [Abstract] Abstract: the claim that GlocalKD, One-Shot GIN(E), and TDA methods achieve the strongest performance is unsupported because no metrics (precision, recall, F1, AUC), baselines, error bars, or statistical tests are supplied.
Authors: We acknowledge this limitation in the current manuscript. The abstract's claim is based on our internal evaluations, but we agree that explicit metrics are needed for transparency. In the revised manuscript, we will include tables with precision, recall, F1, AUC scores for all methods, along with baselines (such as standard isolation forest or autoencoders), error bars from multiple runs, and statistical significance tests (e.g., paired t-tests). revision: yes
-
Referee: [Results] Results section: no ground-truth definition, labeled list of TSX-60 stress events, labeling rule, or overlap metric is described, so the reported superiority cannot be distinguished from internal reconstruction error and the topological-meaning claim remains untestable.
Authors: We agree that a clear ground-truth is crucial. We will add to the Results section a definition of financial stress events based on historical Canadian market data (e.g., events like the 2008 financial crisis, 2020 COVID crash, etc.), a labeled list for the TSX-60 period, the specific labeling rule (such as days with returns below -2 standard deviations or volatility above threshold), and an overlap metric (e.g., precision at k or intersection over union with detected anomalies) to demonstrate that the detections align with these events rather than just reconstruction errors. revision: yes
-
Referee: [Methodology] Methodology: the paper provides no description of the TDA pipeline (filtration function, persistence diagram construction, or distance metric to anomaly scores) or how it is aligned with the PCA and neural-network pipelines for a fair comparison.
Authors: We will revise the Methodology section to provide a complete description of the TDA pipeline: we use the Vietoris-Rips filtration on the point cloud of stock returns, compute persistence diagrams with the Ripser library, and derive anomaly scores via the bottleneck distance to a reference diagram or persistence entropy. For fair comparison, all methods (TDA, PCA, neural networks) will use the same data preprocessing (e.g., normalized returns over the same window), same train/test splits, and same evaluation protocol. revision: yes
Circularity Check
No circularity: empirical comparison with no derivation or fitted-parameter reduction
full rationale
The paper reports an empirical evaluation of TDA, PCA, and neural-network anomaly detectors on TSX-60 returns, claiming that GlocalKD, One-Shot GIN(E), and TDA methods perform best at identifying stress events. No derivation chain, uniqueness theorem, ansatz, or self-citation is invoked to obtain the performance ordering; the ordering is presented as the direct output of the applied algorithms on the chosen data. The central interpretive sentence (“global topological properties are meaningful”) follows immediately from the observed performance numbers and does not reduce to any prior result by construction. No fitted parameter is relabeled as a prediction, and no load-bearing premise rests on a self-citation whose content is itself unverified. The analysis is therefore self-contained against external benchmarks and receives the default non-circularity score.
Axiom & Free-Parameter Ledger
Lean theorems connected to this paper
-
IndisputableMonolith/Foundation/AlexanderDuality.leanalexander_duality_circle_linking unclear?
unclearRelation between the paper passage and the cited Recognition theorem.
We compute the directed flag complex of each weighted graph and compute the L1 and L2 norms of the resulting persistent barcodes.
What do these tags mean?
- matches
- The paper's claim is directly supported by a theorem in the formal canon.
- supports
- The theorem supports part of the paper's argument, but the paper may add assumptions or extra steps.
- extends
- The paper goes beyond the formal theorem; the theorem is a base layer rather than the whole result.
- uses
- The paper appears to rely on the theorem as machinery.
- contradicts
- The paper's claim conflicts with a theorem or certificate in the canon.
- unclear
- Pith found a possible connection, but the passage is too broad, indirect, or ambiguous to say the theorem truly supports the claim.
Reference graph
Works this paper leans on
-
[1]
A. Adesh, Shobha G, J. Shetty, and L. Xu. Local outlier factor for anomaly detection in hpcc systems. Journal of Parallel and Distributed Computing , 192:104923, 2024
work page 2024
- [2]
- [3]
- [4]
-
[5]
L. Caputi and H. Riihim \"a ki. Hochschild homology, and a persistent approach via connectivity digraphs. J. Appl. Comput. Topol. , 8(5):1121--1170, 2024
work page 2024
-
[6]
D. Cohen-Steiner, H. Edelsbrunner, and J. Harer. Stability of persistence diagrams. Discrete Comput. Geom. , 37(1):103--120, 2007
work page 2007
- [7]
-
[8]
T. Duprey. Canadian financial stress and macroeconomic condition. Canadian Public Policy , 46, 2020
work page 2020
-
[9]
H. Edelsbrunner, D. Letscher, and A. Zomorodian. Topological persistence and simplification. Discrete Comput. Geom. , 28(4):511--533, 2002
work page 2002
-
[10]
M. Gidea. Topology data analysis of critical transitions in financial networks. In 3rd International Winter School and Conference on Network Science , 2017
work page 2017
-
[11]
M. Gidea and Y. Katz. Topological data analysis of financial time series: Landscapes of crashes. Physica A: Statistical mechanics and its applications , 491:820--834, 2018
work page 2018
- [12]
- [13]
-
[14]
M. Lokanan, V. Tran, and Nam H. Vuong. Detecting anomalies in financial statements using machine learning algorithm: The case of vietnamese listed firms. Asian Journal of Accounting Research , 4(2):181--201, 08 2019
work page 2019
-
[15]
L. Zhao L. Wu, P. Cui J. Pei. Graph Neural Networks: Foundations, Frontiers and Applications . Springer Nature, Singapore, 2024
work page 2024
-
[16]
R. Mckibben and R. Fernando. The global economic impacts of the covid-19 pandemic. Economic Modelling , 129, 2023
work page 2023
- [17]
-
[18]
X. Ma, J. Wu, S. Xue, J. Yang, C. Zhou, Q. Z. Sheng, H. Xiong, and L. Akoglu. A comprehensive survey on graph anomaly detection using deep learning. IEEE Transactions on Knowledge and Data Engineering , 35(12):12012 -- 12038, 2021
work page 2021
-
[19]
https://www.financialresearch.gov/financial-stress-index/
Ofr financial stress index. https://www.financialresearch.gov/financial-stress-index/
- [20]
-
[21]
https://pytorch-geometric.readthedocs.io/en/latest/generated/torch_geometric.nn.conv.GINEConv.html
Pytorch geometric: Gineconv layer. https://pytorch-geometric.readthedocs.io/en/latest/generated/torch_geometric.nn.conv.GINEConv.html
-
[22]
H. Qiao, H. Tong, B. An, I. King, C. Aggarwal, and G. Pang. Deep graph anomaly detection: A survey and new perspectives. IEEE Transactions on Knowledge and Data Engineering , 2025
work page 2025
-
[23]
A. Rai, A. Mahata, M. Nurujjaman, and O. Prakash. Statistical properties of the aftershocks of stock market crashes revisited: Analysis based on the 1987 crash, financial-crisis-2008 and covid-19 pandemic. International Journal of Modern Physics C , 33, 2022
work page 1987
-
[24]
A. Rai, B. Sharma, S. Luwang, M. Nurujjaman, and S. Majhi. Identifying extreme events in the stock market: A topological data analysis. Chaos , 34, 2024
work page 2024
-
[25]
L. Ruff, R. Vandermeulen, N. Goernitz, L. Deecke, S. A. Siddiqui, A. Binder, E. Müller, and MariusKloft. Deep one-class classification. In Proceedings of the International Conference on Machine Learning (ICML) , pages 4493--4402, 2018. Available at https://proceedings.mlr.press/v80/ruff18a.html
work page 2018
-
[26]
H. Kantz S. Albeverio, V. Jentsch. Extreme Events in Nature and Society . The Frontiers Collection. Springer Nature, New York, 2006
work page 2006
-
[27]
G. Sugihara, R. May, H. Ye, C. Hsieh, E. Deyle, M. Fogarty, and S. Munch. Detecting causality in complex ecosystems. Science , 338(6106):496--500, 2012
work page 2012
- [28]
- [29]
-
[30]
K. Xu, J. Leskovec, W. Hu, and S. Jegelka. How powerful are graph neural networks. In Proceedings of the International Conference on Learning Representations (ICLR) , 2019. Available at https://openreview.net/pdf?id=ryGs6iA5Km
work page 2019
-
[31]
J. Yao, J. Li, J. Wu, M. Yang, and X. Wang. Change point detection in financial market using topological data analysis. Systems , 13, 2025
work page 2025
-
[32]
L. Zhao and Akoglu L. “on using classification datasets to evaluate graph outlier detection: Peculiar observations and new insights. Big Data , 11, 2023
work page 2023
discussion (0)
Sign in with ORCID, Apple, or X to comment. Anyone can read and Pith papers without signing in.