Recognition: 2 theorem links
· Lean TheoremChart-RL: Policy Optimization Reinforcement Learning for Enhanced Visual Reasoning in Chart Question Answering with Vision Language Models
Pith reviewed 2026-05-13 20:00 UTC · model grok-4.3
The pith
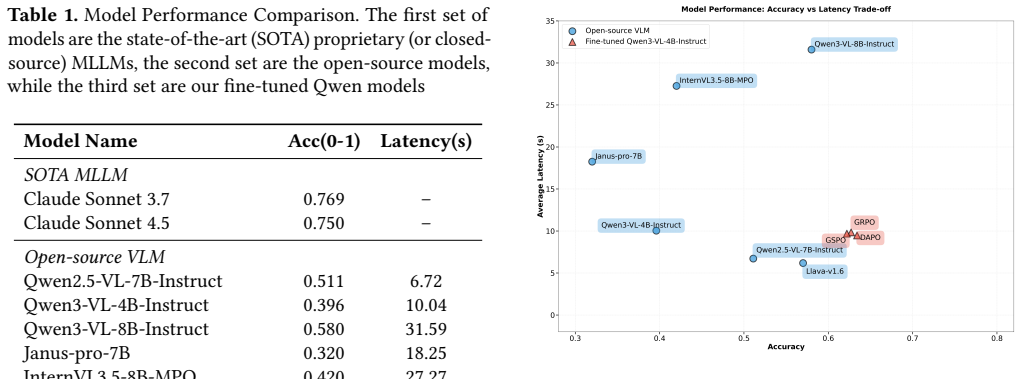
Chart-RL uses RL policy optimization and LoRA to boost VLM chart reasoning, enabling a 4B model to reach 0.634 accuracy versus 0.580 for an 8B model with lower latency.
A machine-rendered reading of the paper's core claim, the machinery that carries it, and where it could break.
Core claim
The RL fine-tuned Qwen3-VL-4B-Instruct model achieved an answer accuracy of 0.634, surpassing the 0.580 accuracy of the Qwen3-VL-8B-Instruct foundation model despite utilizing half the parameter count, while simultaneously reducing inference latency from 31 seconds to 9 seconds.
Load-bearing premise
That the adaptive reward functions and policy optimization steps produce genuine gains in visual reasoning rather than overfitting to the specific ChartQAPro dataset or rewarding superficial pattern matching.
Figures


read the original abstract
The recent advancements in Vision Language Models (VLMs) have demonstrated progress toward true intelligence requiring robust reasoning capabilities. Beyond pattern recognition, linguistic reasoning must integrate with visual comprehension, particularly for Chart Question Answering (CQA) tasks involving complex data visualizations. Current VLMs face significant limitations in CQA, including imprecise numerical extraction, difficulty interpreting implicit visual relationships, and inadequate attention mechanisms for capturing spatial relationships in charts. In this work, we address these challenges by presenting Chart-RL, a novel reinforcement learning framework that enhances VLMs chart understanding through feedback-driven policy optimization of visual perception and logical inference. Our key innovation includes a comprehensive framework integrating Reinforcement Learning (RL) from Policy Optimization techniques along with adaptive reward functions, that demonstrates superior performance compared to baseline foundation models and competitive results against larger state-of-the-art architectures. We also integrated Parameter-Efficient Fine-Tuning through Low-Rank Adaptation (LoRA) in the RL framework that only requires single GPU configurations while preserving performance integrity. We conducted extensive benchmarking across open-source, proprietary, and state-of-the-art closed-source models utilizing the ChartQAPro dataset. The RL fine-tuned Qwen3-VL-4B-Instruct model achieved an answer accuracy of 0.634, surpassing the 0.580 accuracy of the Qwen3-VL-8B-Instruct foundation model despite utilizing half the parameter count, while simultaneously reducing inference latency from 31 seconds to 9 seconds.
Editorial analysis
A structured set of objections, weighed in public.
Referee Report
Summary. The manuscript introduces Chart-RL, a reinforcement learning framework that applies policy optimization with adaptive reward functions and LoRA-based fine-tuning to improve vision-language models on chart question answering. It reports that the resulting Qwen3-VL-4B-Instruct model reaches 0.634 accuracy on ChartQAPro, exceeding the 0.580 accuracy of the larger Qwen3-VL-8B-Instruct baseline while cutting inference latency from 31 s to 9 s.
Significance. If the performance gains are shown to be robust, the work would demonstrate that RL-driven policy optimization can produce smaller, faster VLMs that outperform larger foundation models on visual reasoning tasks, with clear implications for efficient deployment in chart interpretation applications.
major comments (3)
- [Abstract] Abstract: the reported 0.634 vs. 0.580 accuracy improvement is presented without error bars, number of evaluation runs, or statistical significance tests, leaving the central performance claim only weakly supported.
- [Method] Method section: the adaptive reward functions and the precise policy optimization objective are described only at a high level with no equations, pseudocode, or implementation details, which are load-bearing for reproducing and validating the claimed gains in visual reasoning.
- [Experiments] Experiments: no ablation studies, SFT-only baselines, or training curves are provided to isolate the contribution of the RL policy optimization step versus LoRA or dataset-specific effects, undermining the claim that the improvements stem from enhanced visual reasoning rather than overfitting.
minor comments (1)
- [Abstract] Abstract: the latency figures (31 s to 9 s) should specify the hardware platform, batch size, and whether measurements include any post-processing steps.
Simulated Author's Rebuttal
We thank the referee for the constructive feedback on our manuscript. We agree that the current presentation of results and methods requires strengthening for reproducibility and to better isolate the contributions of our approach. Below we address each major comment and describe the revisions we will make.
read point-by-point responses
-
Referee: [Abstract] Abstract: the reported 0.634 vs. 0.580 accuracy improvement is presented without error bars, number of evaluation runs, or statistical significance tests, leaving the central performance claim only weakly supported.
Authors: We agree that the performance claims would be more robust with statistical support. In the revised manuscript we will report mean accuracy and standard deviation over five independent evaluation runs for both the 4B and 8B models, include error bars in the abstract and results tables, and add a paired t-test to assess statistical significance of the 0.634 vs. 0.580 difference. revision: yes
-
Referee: [Method] Method section: the adaptive reward functions and the precise policy optimization objective are described only at a high level with no equations, pseudocode, or implementation details, which are load-bearing for reproducing and validating the claimed gains in visual reasoning.
Authors: We acknowledge the need for greater technical detail. The revised method section will include the full policy optimization objective (including the adaptive reward formulation), the exact loss function, and pseudocode for the training loop. We will also add implementation specifics such as LoRA rank, learning-rate schedule, reward scaling coefficients, and the precise form of the adaptive reward components. revision: yes
-
Referee: [Experiments] Experiments: no ablation studies, SFT-only baselines, or training curves are provided to isolate the contribution of the RL policy optimization step versus LoRA or dataset-specific effects, undermining the claim that the improvements stem from enhanced visual reasoning rather than overfitting.
Authors: We agree that additional controls are necessary to substantiate the source of the gains. In the revision we will add (1) an SFT-only baseline using the same LoRA configuration and dataset, (2) ablation variants that disable the adaptive reward or the policy-optimization step, (3) training curves for both reward and accuracy, and (4) evaluation on a held-out subset of ChartQAPro to address overfitting concerns. revision: yes
Circularity Check
No significant circularity detected
full rationale
The paper describes an empirical RL+LoRA framework for VLM fine-tuning on ChartQAPro, reporting direct accuracy and latency comparisons against external baselines (Qwen3-VL-8B, other open/closed models). No equations, derivations, or first-principles claims appear in the provided text; the central result is a measured performance delta rather than a reduction of any quantity to its own fitted inputs or self-citations. The absence of any load-bearing theoretical step means the reported numbers stand or fall on experimental controls, not on definitional equivalence.
Axiom & Free-Parameter Ledger
axioms (1)
- domain assumption Reinforcement learning from policy optimization improves visual perception and logical inference in VLMs for chart tasks
Lean theorems connected to this paper
-
IndisputableMonolith/Cost/FunctionalEquationwashburn_uniqueness_aczel unclear?
unclearRelation between the paper passage and the cited Recognition theorem.
rew(ON) = rewformat(ON) + rewaccuracy(ON) + rewreasoning(ON) with LLM judge scoring
-
IndisputableMonolith/Foundation/RealityFromDistinctionreality_from_one_distinction unclear?
unclearRelation between the paper passage and the cited Recognition theorem.
GRPO/DAPO/GSPO group-based policy optimization with relative advantage UN
What do these tags mean?
- matches
- The paper's claim is directly supported by a theorem in the formal canon.
- supports
- The theorem supports part of the paper's argument, but the paper may add assumptions or extra steps.
- extends
- The paper goes beyond the formal theorem; the theorem is a base layer rather than the whole result.
- uses
- The paper appears to rely on the theorem as machinery.
- contradicts
- The paper's claim conflicts with a theorem or certificate in the canon.
- unclear
- Pith found a possible connection, but the passage is too broad, indirect, or ambiguous to say the theorem truly supports the claim.
Reference graph
Works this paper leans on
-
[1]
Chain-of-Thought Prompting Elicits Reasoning in Large Language Models
Jason Wei, Xuezhi Wang, Dale Schuurmans, Maarten Bosma, Brian Ichter, Fei Xia, Ed Chi, Quoc Le, and Denny Zhou. Chain-of-Thought Prompting Elicits Reasoning in Large Language Models. arXiv preprint arXiv:2201.11903, 2022
work page internal anchor Pith review Pith/arXiv arXiv 2022
-
[2]
ReAct: Synergizing Reasoning and Acting in Language Models
Shunyu Yao, Je#rey Zhao, Dian Yu, Nan Du, Izzeddin Gur, Shixiang Shane Shafran, Karthik Narasimhan, and Yuan Cao. ReAct: Syner- gizing Reasoning and Acting in Language Models. arXiv preprint arXiv:2210.03629, 2022
work page internal anchor Pith review Pith/arXiv arXiv 2022
-
[3]
Xumeng Wen, Zihan Liu, Shun Zheng, Shengyu Ye, Zhirong Wu, Yang Wang, Zhijian Xu, Xiao Liang, Junjie Li, Ziming Miao, Jiang Bian, Mao Yang. Reinforcement Learning with Veri!able Rewards Implicitly Incentivizes Correct Reasoning in Base LLMs arXiv preprint arXiv:2506.14245, 2025
work page internal anchor Pith review Pith/arXiv arXiv 2025
-
[4]
Zhihong Shao, Peiyi Wang, Qihao Zhu, Runxin Xu, Junxiao Song, Xiao Bi, Haowei Zhang, Mingchuan Zhang, Y.K. Li, Y. Wu, Daya Guo. DeepSeekMath: Pushing the Limits of Mathematical Reasoning in Open Language Models arXiv preprint arXiv:2402.03300, 2024
work page internal anchor Pith review Pith/arXiv arXiv 2024
-
[5]
DAPO: An Open-Source LLM Reinforcement Learning System at Scale
Qiying Yu, Zheng Zhang, Ruofei Zhu, Yufeng Yuan, Xiaochen Zuo, Yu Yue, Weinan Dai, Tiantian Fan, Gaohong Liu, Lingjun Liu, Xin Liu, Haibin Lin, Zhiqi Lin, Bole Ma, Guangming Sheng, Yuxuan Tong, Chi Zhang, Mofan Zhang, Wang Zhang, Hang Zhu, Jinhua Zhu, Ji- aze Chen, Jiangjie Chen, Chengyi Wang, Hongli Yu, Yuxuan Song, Xiangpeng Wei, Hao Zhou, Jingjing Liu,...
work page internal anchor Pith review Pith/arXiv arXiv 2025
-
[6]
Group Sequence Policy Optimization
Chujie Zheng, Shixuan Liu, Mingze Li, Xiong-Hui Chen, Bowen Yu, Chang Gao, Kai Dang, Yuqiong Liu, Rui Men, An Yang, Jingren Zhou, Junyang Lin. Group Sequence Policy Optimization arXiv preprint arXiv:2507.18071, 2025
work page internal anchor Pith review Pith/arXiv arXiv 2025
-
[7]
ChartQA: A Benchmark for Question Answering about Charts with Visual and Logical Reasoning
Ahmed Masry, Do Xuan Long, Jia Qing Tan, Sha!q Joty, and Enamul Hoque. ChartQA: A Benchmark for Question Answering about Charts with Visual and Logical Reasoning. In Findings of the Association for Computational Linguistics: ACL 2022 , pages 2263–2279, 2022
work page 2022
-
[9]
Nitesh Methani, Pritha Ganguly, Mitesh M. Khapra, and Pratyush Kumar. PlotQA: Reasoning over Scienti!c Plots. arXiv preprint arXiv:1909.00997, 2019
-
[10]
FigureQA: An Annotated Figure Dataset for Visual Reasoning
Samira Ebrahimi Kahou, Adam Atkinson, Vincent Michalski, Akos Kadar, Adam Trischler, and Yoshua Bengio. FigureQA: An Annotated Figure Dataset for Visual Reasoning. In NeurIPS Visually Grounded Interaction and Language Workshop, 2017
work page 2017
-
[11]
ChartMuseum: Testing Visual Rea- soning Capabilities of Large Vision-Language Models
Liyan Tang, Grace Kim, Xinyu Zhao, Thom Lake, Wenxuan Ding, Fangcong Yin, Prasann Singhal, Manya Wadhwa, Zeyu Leo Liu, Za- yne Sprague, Ramya Namuduri, Bodun Hu, Juan Diego Rodriguez, Puyuan Peng, and Greg Durrett. ChartMuseum: Testing Visual Rea- soning Capabilities of Large Vision-Language Models. arXiv preprint arXiv:2505.13444, 2025
-
[12]
DePlot: One-shot Visual Language Reasoning by Plot-to-Table Translation
Fangyu Liu, Julian Eisenschlos, Francesco Piccinno, Syrine Krichene, Chenxi Pang, Kenton Lee, Mandar Joshi, Wenhu Chen, Nigel Collier, and Yasemin Altun. DePlot: One-shot Visual Language Reasoning by Plot-to-Table Translation. In Findings of the Association for Computa- tional Linguistics: ACL 2023 , pages 10381–10399, 2023
work page 2023
-
[13]
SIMPLOT: Enhancing Chart Question Answering by Dis- tilling Essentials
Wonjoong Kim, Sangwu Park, Yeonjun In, Seokwon Han, and Chany- oung Park. SIMPLOT: Enhancing Chart Question Answering by Dis- tilling Essentials. In Findings of the Association for Computational Linguistics: NAACL 2025, pages 573–593, 2025
work page 2025
-
[14]
ChartOCR: Data Extraction from Charts Images via a Deep Hybrid Framework
Junyu Luo, Zekun Li, Jinpeng Wang, and Chin-Yew Lin. ChartOCR: Data Extraction from Charts Images via a Deep Hybrid Framework. In Proceedings of the IEEE/CVF Winter Conference on Applications of Computer Vision (W ACV), 2021
work page 2021
-
[15]
Minesh Mathew, Dimosthenis Karatzas, and C. V. Jawahar. DocVQA: A Dataset for VQA on Document Images. In Proceedings of the IEEE/CVF Winter Conference on Applications of Computer Vision (W ACV), pages 2200–2209, 2021
work page 2021
- [16]
-
[17]
Pix2Struct: Screenshot Parsing as Pretraining for Visual Language Understanding
Kenton Lee, Mandar Joshi, Iulia Raluca Turc, Hexiang Hu, Fangyu Liu, Julian Martin Eisenschlos, Urvashi Khandelwal, Peter Shaw, Ming-Wei Chang, and Kristina Toutanova. Pix2Struct: Screenshot Parsing as Pretraining for Visual Language Understanding. In Proceedings of the 40th International Conference on Machine Learning (ICML) , pages 18893–18912, 2023
work page 2023
-
[18]
ChartSketcher: Reasoning with Multimodal Feedback and Re$ection for Chart Understanding
Muye Huang, Lingling Zhang, Jie Ma, Han Lai, Fangzhi Xu, Yifei Li, Wenjun Wu, Yaqiang Wu, and Jun Liu. ChartSketcher: Reasoning with Multimodal Feedback and Re$ection for Chart Understanding. arXiv preprint arXiv:2505.19076, 2025
- [19]
-
[20]
S. E. Kahou, A. Atkinson, V. Michalski, A. Kádár, A. Trischler, and Y. Bengio. Figureqa: An annotated !gure dataset for visual reasoning. CoRR, abs/1710.07300, 2017
work page Pith review arXiv 2017
-
[21]
A. Masry, D. X. Long, J. Q. Tan, S. Joty, and E. Hoque. Chartqa: A benchmark for question answering about charts with visual and logical reasoning. arXiv:2203.10244, 2022
-
[22]
A. Masry, M. S. Islam, M. Ahmed, A. Bajaj, F. Kabir, A. Kartha, Md. T. R. Laskar, M. Rahman, S. Rahman, M. Shahmohammad, M. Thakkar, Md. R. Parvez, E. Hoque, and S. Joty. Chartqapro: A more di- verse and challenging benchmark for chart question answering. arXiv:2504.05506, 2025
-
[23]
ths, and R. T. McCoy. Deciphering the factors in$uencing the e
A. Prabhakar, T. L. Gri"ths, and R. T. McCoy. Deciphering the factors in$uencing the e"cacy of chain-of-thought: Probability, memoriza- tion, and noisy reasoning. arXiv:2407.01687, 2024
- [24]
- [25]
-
[26]
Alibaba. Qwen3-vl: Sharper vision, deeper thought, broader action, 2025. h!ps://qwen.ai/blog?id= 99f0335c4ad9"6153e517418d48535ab6d8afe"rom=research.latest- advancements-list
work page 2025
-
[27]
Claude 3.7 sonnet and claude code, 2025
Anthropic. Claude 3.7 sonnet and claude code, 2025. h!ps://www. anthropic.com/news/claude-3-7-sonnet
work page 2025
-
[28]
Introducing claude sonnet 4.5, 2025
Anthropic. Introducing claude sonnet 4.5, 2025. h!ps://www. anthropic.com/news/claude-sonnet-4-5
work page 2025
-
[29]
Janus: Decoupling visual encoding for unified multimodal understanding and generation
C. Wu et al. Janus: Decoupling visual encoding for uni!ed multimodal understanding and generation. arXiv:2410.13848, 2024
-
[30]
Multiple et al. Gemini 2.5: Pushing the frontier with advanced reason- ing, multimodality, long context, and next generation agentic capabil- ities. arXiv:2507.06261, 2025
work page internal anchor Pith review Pith/arXiv arXiv 2025
-
[31]
S. Bai et al. Qwen2.5-vl technical report. arXiv:2502.13923, 2025
work page internal anchor Pith review Pith/arXiv arXiv 2025
-
[32]
InternVL3.5: Advancing Open-Source Multimodal Models in Versatility, Reasoning, and Efficiency
W. Wang et al. Internvl3.5: Advancing open-source multimodal models in versatility, reasoning, and e"ciency. arXiv:2508.18265, 2025
work page internal anchor Pith review Pith/arXiv arXiv 2025
-
[33]
OpenAI. Introducing gpt-5, 2025. h!ps://openai.com/index/ introducing-gpt-5/ . A Full Response from All Models in the Examples A.1 Example 1: open-ended question Claude Sonnet 3.7 <think> To !nd the di#erence between the sum of the blue bars and the sum of the yellow bars, I need to:
work page 2025
-
[34]
Identify which bars are blue and which are yellow in the chart
-
[35]
Sum up all the blue bars
-
[36]
Sum up all the yellow bars
-
[37]
Right” in the legend • The yellow bars appear to be labeled as “Centre
Calculate the di#erence between these sums Looking at the chart: • The blue bars appear to be labeled as “Right” in the legend • The yellow bars appear to be labeled as “Centre” in the legend Blue bars (Right) values: • Kevin Rudd: 32 • Julia Gillard: 38 • Don’t know: 30 Sum of blue bars = 32 + 38 + 30 = 100 Yellow bars (Centre) values: • Kevin Rudd: 55 •...
-
[40]
Subtract the sum of the yellow bars from the sum of the blue bars. From the chart: • Blue bars (representing “Right”) have values: 32 (Kevin Rudd), 38 (Julia Gillard), and 30 (Don’t know). • Yellow bars (representing “Centre”) have values: 55 (Kevin Rudd), 27 (Julia Gillard), and 18 (Don’t know). Sum of blue bars = 32 + 38 + 30 = 100. Sum of yellow bars =...
-
[41]
Identify all the blue bars and sum their values
-
[42]
Identify all the yellow bars and sum their values
-
[43]
Subtract the sum of the yellow bars from the sum of the blue bars. From the chart: • Blue bars (representing “Right”) have values: 32 (Kevin Rudd), 38 (Julia Gillard), and 30 (Don’t know). • Yellow bars (representing “Centre”) have values: 55 (Kevin Rudd), 27 (Julia Gillard), and 18 (Don’t know). Sum of blue bars = 32 + 38 + 30 = 100 Sum of yellow bars = ...
-
[44]
Identify the values of all blue bars (representing “Right”)
-
[45]
Identify the values of all yellow bars (representing “Centre”)
-
[46]
Sum the values of the blue bars
-
[47]
Sum the values of the yellow bars
-
[48]
Subtract the sum of the yellow bars from the sum of the blue bars. From the chart: Blue bars (Right): • Kevin Rudd: 32 • Julia Gillard: 38 • Don’t know: 30 • Sum of blue bars = 32 + 38 + 30 = 100 Yellow bars (Centre): • Kevin Rudd: 55 • Julia Gillard: 27 • Don’t know: 18 • Sum of yellow bars = 55 + 27 + 18 = 100 Now, calculate the di#erence: Di#erence = S...
-
[49]
Identify the pension fund assets values from 2010 to 2014
work page 2010
-
[50]
Calculate the growth trend during this period
-
[51]
Apply this trend to estimate the 2015 value
work page 2015
-
[52]
Compare the result with the given options Looking at the chart, I can approximate the values: • 2010: ↔1,800 N billion • 2011: ↔2,400 N billion • 2012: ↔2,700 N billion • 2013: ↔3,800 N billion • 2014: ↔4,500 N billion I can calculate the year-over-year growth rates: • 2010 to 2011: (2400-1800)/1800 = 600/1800 = 0.33 or 33% • 2011 to 2012: (2700-2400)/240...
work page 2010
-
[53]
X-axis: Case Creation Date (ranging from approxi- mately April to August)
-
[54]
Y-axis: Account Value (ranging from $0 to approxi- mately $150K)
-
[55]
Bubbles of di#erent sizes and colors (green and red) representing open cases To determine if there’s a positive correlation, I need to see if there’s a trend where account values increase as the creation date becomes more recent. Looking at the scatter plot: • The data points are scattered across the entire date range • There are high-value accounts (arou...
-
[56]
Understand the chart: The top-left chart is titled “OPEN CASES • BY CREATED DATE. ” It plots “Account Value” (y-axis) against “Case Creation Date” (x-axis). The data points are represented by circles, with size possibly indicating case volume or importance
-
[57]
What does “positive correlation” mean? A positive correlation implies that as one variable increases, the other variable also tends to increase. In this case, if account value increases as case creation date moves forward (e.g., from early to late months), then there’s a positive correlation
-
[58]
• The y-axis represents account value, ranging from $0K to $200K
Analyze the chart visually: • The x-axis represents case creation dates, spanning from early April to late June. • The y-axis represents account value, ranging from $0K to $200K. • The data points (circles) are clustered in di#erent re- gions. Notice that the largest circles (representing higher account values) appear toward the right side of the chart (l...
-
[59]
Interpretation: • The trend suggests that cases created later in the pe- riod (right side of the x-axis) tend to have higher ac- count values (top of the y-axis). • This indicates that as the case creation date progresses, account value tends to increase — which is consistent with a positive correlation
-
[60]
</think> <answer> True </answer>
Conclusion: • The visual pattern supports the claim of a positive correlation between account value and case creation date. </think> <answer> True </answer>
discussion (0)
Sign in with ORCID, Apple, or X to comment. Anyone can read and Pith papers without signing in.