Recognition: no theorem link
Choosing the Right Regularizer for Applied ML: Simulation Benchmarks of Popular Scikit-learn Regularization Frameworks
Pith reviewed 2026-05-13 18:54 UTC · model grok-4.3
The pith
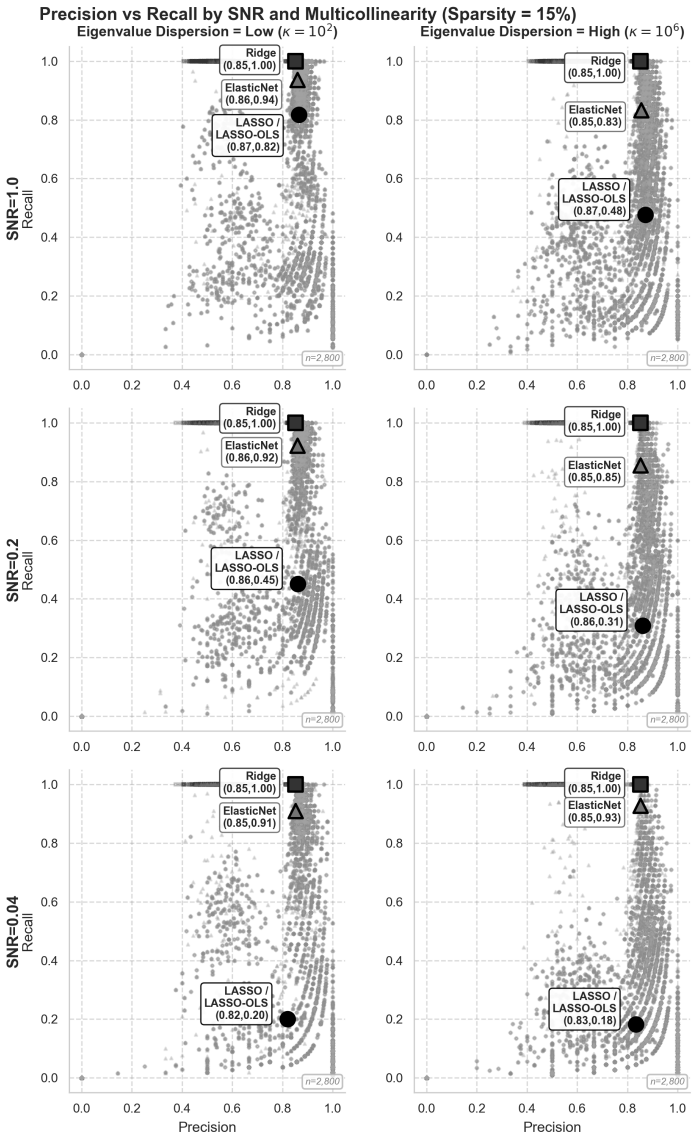
When samples greatly outnumber features, Ridge, Lasso, and ElasticNet deliver similar prediction accuracy, yet Lasso recall collapses under multicollinearity while ElasticNet remains stable.
A machine-rendered reading of the paper's core claim, the machinery that carries it, and where it could break.
Core claim
Across 134400 simulations grounded in eight production-grade models, Ridge, Lasso, and ElasticNet achieve comparable prediction accuracy once n/p >= 78. Lasso recall, by contrast, drops sharply to 0.18 at high condition numbers and low SNR, while ElasticNet maintains recall of 0.93. The authors therefore recommend against Lasso or Post-Lasso OLS when multicollinearity is strong and samples are limited, and supply an objective guide for selecting among the four frameworks based on measurable feature-space properties.
What carries the argument
A seven-dimensional simulation manifold of 134400 runs that systematically varies condition number, SNR, sample-to-feature ratio and related factors drawn from real ML models to benchmark Ridge, Lasso, ElasticNet and Post-Lasso OLS.
If this is right
- With n/p at least 78, any of Ridge, Lasso or ElasticNet can be used for prediction without large accuracy differences.
- Lasso should be avoided for feature selection whenever features are strongly correlated, because its recall collapses under those conditions.
- ElasticNet offers more reliable variable recovery than pure Lasso when multicollinearity and noise are both present.
- Post-Lasso OLS inherits the same fragility as Lasso and is likewise unsuitable at high condition numbers with modest sample sizes.
- A decision procedure based on observable quantities such as kappa and n/p can replace ad-hoc choice among the four frameworks.
Where Pith is reading between the lines
- The observed robustness gap suggests that mixed L1-L2 penalties provide a practical hedge against the correlation structures common in tabular production data.
- Extending the same simulation grid to streaming or non-stationary settings would test whether the reported interchangeability for prediction still holds over time.
- The fragility finding supplies a concrete reason to prefer ElasticNet or Ridge when downstream interpretability depends on stable feature recovery.
- Running the benchmarks with alternative solvers or cross-validation schemes inside scikit-learn could reveal whether implementation details modulate the reported recall gap.
Load-bearing premise
The seven-dimensional manifold of simulation parameters drawn from eight production models is sufficient to represent the factors that govern regularization behavior in actual applied work.
What would settle it
Replicate the high-kappa low-SNR slice of the simulation grid on a real dataset whose measured condition number and signal-to-noise ratio fall in the same regime and check whether Lasso recall indeed falls near 0.18.
Figures


read the original abstract
This study surveys the historical development of regularization, tracing its evolution from stepwise regression in the 1960s to recent advancements in formal error control, structured penalties for non-independent features, Bayesian methods, and l0-based regularization (among other techniques). We empirically evaluate the performance of four canonical frameworks -- Ridge, Lasso, ElasticNet, and Post-Lasso OLS -- across 134,400 simulations spanning a 7-dimensional manifold grounded in eight production-grade machine learning models. Our findings demonstrate that for prediction accuracy when the sample-to-feature ratio is sufficient (n/p >= 78), Ridge, Lasso, and ElasticNet are nearly interchangeable. However, we find that Lasso recall is highly fragile under multicollinearity; at high condition numbers (kappa) and low SNR, Lasso recall collapses to 0.18 while ElasticNet maintains 0.93. Consequently, we advise practitioners against using Lasso or Post-Lasso OLS at high kappa with small sample sizes. The analysis concludes with an objective-driven decision guide to assist machine learning engineers in selecting the optimal scikit-learn-supported framework based on observable feature space attributes.
Editorial analysis
A structured set of objections, weighed in public.
Referee Report
Summary. The manuscript surveys the historical development of regularization techniques and presents findings from an extensive simulation study involving 134,400 runs across a 7-dimensional manifold derived from eight production-grade machine learning models. It evaluates four regularization frameworks—Ridge, Lasso, ElasticNet, and Post-Lasso OLS—concluding that for prediction accuracy with sufficient sample-to-feature ratios (n/p >= 78), Ridge, Lasso, and ElasticNet are nearly interchangeable. However, Lasso's recall is shown to be highly fragile under multicollinearity, collapsing to 0.18 at high condition numbers and low SNR, while ElasticNet maintains 0.93. The paper advises against using Lasso or Post-Lasso OLS in high kappa, small sample scenarios and provides an objective-driven decision guide based on observable feature space attributes.
Significance. Should the simulation results generalize, this study delivers valuable empirical benchmarks for applied ML practitioners using scikit-learn, clarifying when popular regularizers can be used interchangeably and identifying specific conditions where Lasso fails in feature recovery. The large simulation scale supports the reported performance contrasts and the conditioned decision rule, potentially aiding better model selection in high-dimensional data settings.
major comments (1)
- [Simulation Setup] The claim that the 7-dimensional manifold sufficiently captures key factors determining regularization performance relies on its grounding in eight production-grade models. The manuscript should provide more explicit details on how the parameter ranges and feature-generation procedure were selected from these models, as this is load-bearing for the generalizability of the advice on avoiding Lasso at high kappa.
minor comments (1)
- [Results] The exact replication count and how the 134,400 simulations are distributed across the parameter space could be summarized in a table for clarity.
Simulated Author's Rebuttal
We thank the referee for their positive assessment of the work and recommendation for minor revision. We address the single major comment below.
read point-by-point responses
-
Referee: The claim that the 7-dimensional manifold sufficiently captures key factors determining regularization performance relies on its grounding in eight production-grade models. The manuscript should provide more explicit details on how the parameter ranges and feature-generation procedure were selected from these models, as this is load-bearing for the generalizability of the advice on avoiding Lasso at high kappa.
Authors: We agree that additional explicit details on the manifold construction will strengthen the generalizability claims. The parameter ranges for the seven dimensions (n, p, SNR, kappa, sparsity, noise structure, and correlation type) were derived by first fitting the eight production-grade models to representative datasets and extracting empirical quantiles for each factor; the feature-generation procedure then samples covariance matrices via eigenvalue scaling to achieve target condition numbers while preserving the observed marginal distributions. In the revised manuscript we will add a dedicated subsection (new Section 3.1) containing a table of the exact quantile ranges extracted from each model, the eigenvalue-adjustment algorithm, and a short justification for why these ranges cover the relevant operating regime for the Lasso-failure advice. This revision directly supports the conditioned recommendation against Lasso at high kappa. revision: yes
Circularity Check
No significant circularity
full rationale
This is a purely empirical simulation study with no derivations, self-referential equations, or fitted parameters underlying the claims. All reported metrics are direct outputs from 134400 controlled experiments on a 7-dimensional manifold. The central contrasts (e.g., Lasso vs ElasticNet recall at high kappa/low SNR) are traceable to the explicit simulation procedure and replication count supplied in the text, with no load-bearing steps that reduce by construction to inputs or self-citations.
Axiom & Free-Parameter Ledger
axioms (1)
- domain assumption The 7-dimensional manifold of simulation parameters grounded in eight production-grade ML models captures relevant real-world variability for regularization performance
Reference graph
Works this paper leans on
-
[1]
Aggarwal, C. C., Hinneburg, A., & Keim, D. A. (2001). On the surprising behavior of distance metrics in high dimensional space.Database Theory — ICDT 2001, 420–434. https://doi.org/10.1007/3- 540-44503-X 27
work page doi:10.1007/3- 2001
-
[2]
Belloni, A., & Chernozhukov, V. (2013). Least squares after model selection in high-dimensional sparse models.Bernoulli,19(2), 521–547. https://doi.org/10.3150/11-BEJ410
-
[3]
Berk, R., Brown, L., Buja, A., Zhang, K., & Zhao, L. (2013). Valid post-selection inference.The Annals of Statistics,41(2), 802–837. https://doi.org/10.1214/12-AOS1077
-
[4]
Bertsimas, D., King, A., & Mazumder, R. (2016). Best subset selection via a modern optimization lens.Annals of Statistics,44(2), 813–852. https://doi.org/10.1214/15-AOS1388
-
[5]
Bertsimas, D., Pauphilet, J., & Van Parys, B. (2020a). Rejoinder: Sparse regression: Scalable algorithms and empirical performance.Statistical Science,35(4), 623–624. https://doi.org/10.1214/20- STS701REJ
-
[6]
Bertsimas, D., Pauphilet, J., & Van Parys, B. (2021). Sparse classification: A scalable discrete optimiza- tion perspective.Machine Learning,110(11–12), 3177–3209. https://doi.org/10.1007/s10994- 021-06085-5
-
[7]
Bertsimas, D., & Van Parys, B. (2020). Sparse high-dimensional regression: Exact scalable algorithms and phase transitions.Annals of Statistics,48(1), 300–323. https://doi.org/10.1214/18- AOS1804
work page doi:10.1214/18- 2020
-
[8]
Bickel, P. J., Ritov, Y., & Tsybakov, A. B. (2009). Simultaneous analysis of Lasso and Dantzig selector. The Annals of Statistics,37(4), 1705–1732. https://doi.org/10.1214/08-AOS620
- [9]
-
[10]
Breiman, L. (1995). Better subset regression using the nonnegative garrote.Technometrics,37(4), 373–384. https://doi.org/10.1080/00401706.1995.10484371
-
[11]
Breiman, L. (1996). Heuristics of instability and stabilization in model selection.The Annals of Statis- tics,24(6), 2350–2383. http://www.jstor.org/stable/2242688 B¨ uhlmann, P., & van de Geer, S. (2011).Statistics for high-dimensional data: Methods, theory and applications. Springer. https://doi.org/10.1007/978-3-642-20192-9 Cand` es, E., Fan, Y., Janso...
-
[12]
Carvalho, C. M., Polson, N. G., & Scott, J. G. (2010). The horseshoe estimator for sparse signals. Biometrika,97(2), 465–480. https://doi.org/10.1093/biomet/asq017
-
[13]
Chen, Y., Taeb, A., & B¨ uhlmann, P. (2020). A look at robustness and stability ofℓ 1-versusℓ 0- regularization: Discussion of papers by bertsimas et al. and hastie et al.Statistical Science, 35(4), 614–622. https://doi.org/10.1214/20-STS809
-
[14]
(1988).Statistical power analysis for the behavioral sciences(2nd)
Cohen, J. (1988).Statistical power analysis for the behavioral sciences(2nd). Lawrence Erlbaum As- sociates
work page 1988
- [15]
-
[16]
Draper, N. R., & Smith, H. (1998).Applied regression analysis(3rd ed.). Wiley. https://doi.org/10. 1002/9781118625590
work page 1998
-
[17]
Efron, B., Hastie, T., Johnstone, I., & Tibshirani, R. (2004). Least angle regression.Annals of Statistics, 32(2), 407–499. https://doi.org/10.1214/009053604000000067
-
[18]
Efroymson, M. A. (1960). Multiple regression analysis. InMathematical methods for digital computers (pp. 191–203). Wiley. 30
work page 1960
-
[19]
Fan, J., & Li, R. (2001). Variable selection via nonconcave penalized likelihood and its oracle properties. Journal of the American Statistical Association,96(456), 1348–1360. https://doi.org/10.1198/ 016214501753382273
work page 2001
-
[20]
Fan, J., & Song, R. (2010). Sure independence screening in generalized linear models with np-dimensionality. Annals of Statistics,38(6), 3567–3604. https://doi.org/10.1214/10-AOS798
-
[21]
Fei, Z., Zhu, J., Banerjee, M., & Li, Y. (2019). Drawing inferences for high-dimensional linear models: A selection-assisted partial regression and smoothing approach.Biometrics,75(2), 551–561. https://doi.org/10.1111/biom.13013 Fitzgerald Sice, J., Lattimore, F., Robinson, T., & Zhu, A. (2026). Double LASSO: Replication and practical insights [Published ...
-
[22]
Frank, I. E., & Friedman, J. H. (1993). A statistical view of some chemometrics regression tools (with discussion).Technometrics,35, 109–148. Freijeiro-Gonz´ alez, L., Febrero-Bande, M., & Gonz´ alez-Manteiga, W. (2022). A critical review of LASSO and its derivatives for variable selection under dependence among covariates.Interna- tional Statistical Revi...
-
[23]
Fu, W. J. (1998). Penalized regressions: The bridge versus the lasso.Journal of Computational and Graphical Statistics,7(3), 397–416. https://doi.org/10.2307/1390712
-
[24]
Gamarnik, D., & Zadik, I. (2017). High dimensional regression with binary coefficients: Estimating squared error and a phase transition.Proceedings of the 2017 Conference on Learning Theory, 65, 948–953. https://proceedings.mlr.press/v65/david17a.html
work page 2017
-
[25]
(2009).The elements of statistical learning
Hastie, T., Tibshirani, R., & Friedman, J. (2009).The elements of statistical learning. Springer. https: //doi.org/10.1007/b94608 1
-
[26]
Hesterberg, T., Choi, N. H., Meier, L., & Fraley, C. (2008). Least angle andℓ1 penalized regression: A review.Statistics Surveys,2, 61–93. https://doi.org/10.1214/08-SS035
-
[27]
Hoerl, A. E., & Kennard, R. W. (1970). Ridge regression: Applications to nonorthogonal problems. Technometrics,12(1), 69–82. https://doi.org/10.2307/1267352
-
[28]
Huang, J., Breheny, P., & Ma, S. (2012). A selective review of group selection in high-dimensional models [Accessed February 15, 2026].Statistical Science,27(4). https://doi.org/10.1214/12- STS392
work page doi:10.1214/12- 2012
-
[29]
Javanmard, A., & Montanari, A. (2014). Confidence intervals and hypothesis testing for high-dimensional regression.Journal of Machine Learning Research,15, 2869–2909. https://jmlr.org/papers/ v15/javanmard14a.html
work page 2014
-
[30]
Lederer, J., & Vogt, M. (2021). Estimating the Lasso’s effective noise.Journal of Machine Learning Research,22(276), 1–32. https://www.jmlr.org/papers/v22/20-539.html
work page 2021
-
[31]
Lee, J. D., Sun, D. L., Sun, Y., & Taylor, J. E. (2016). Exact post-selection inference, with application to the lasso.Annals of Statistics,44(3), 907–927. https://doi.org/10.1214/15-AOS1371
-
[32]
Lemaitre, G. (2023, May 22).Why is the ridge regression loss not normalized by the number of samples? [Comment byglemaitreon GitHub Discussion]. scikit-learn. https://github.com/scikit- learn/scikit-learn/discussions/23407
work page 2023
- [33]
-
[34]
Luo, J., Kong, Y., & Li, G. (2026). From penalization to over-parameterization: Achieving implicit regularization for high-dimensional linear errors-in-variables models [Published online ahead of print].Journal of Business & Economic Statistics, 1–13. https://doi.org/10.1080/07350015. 2025.2583457
-
[35]
Meinshausen, N., Rocha, G., & Yu, B. (2007). Discussion: A tale of three cousins: Lasso, L2Boosting and Dantzig [Discussion of “The Dantzig selector” by Candes and Tao].The Annals of Statistics, 35(6), 2373–2384. https://doi.org/10.1214/009053607000000523
-
[36]
Meinshausen, N., & B¨ uhlmann, P. (2010). Stability selection.Journal of the Royal Statistical Society. Series B (Statistical Methodology),72(4), 417–473. https://doi.org/10.1111/j.1467-9868.2010. 00740.x
-
[37]
Miller, A. J. (2019).Subset selection in regression. Chapman; Hall/CRC
work page 2019
-
[38]
Park, T., & Casella, G. (2008). The bayesian lasso.Journal of the American Statistical Association, 103(482), 681–686. https://doi.org/10.1198/016214508000000337 31
-
[39]
Pedregosa, F., Varoquaux, G., Gramfort, A., Michel, V., Thirion, B., Grisel, O., Blondel, M., Pret- tenhofer, P., Weiss, R., Dubourg, V., Vanderplas, J., Passos, A., Cournapeau, D., Brucher, M., Perrot, M., & Duchesnay, E. (2011). Scikit-learn: Machine learning in python.Journal of Machine Learning Research,12, 2825–2830
work page 2011
-
[40]
Pilanci, M., Wainwright, M. J., & El Ghaoui, L. (2015). Sparse learning via boolean relaxations. Mathematical Programming,151(1), 63–87. https://doi.org/10.1007/s10107-015-0894-1
-
[41]
Rencher, A. C., & Pun, F. C. (1980). Inflation of r²in best subset regression.Technometrics,22(1), 49–53. https://doi.org/10.2307/1268382
-
[42]
Simon, N., Friedman, J., Hastie, T., & Tibshirani, R. (2013). A sparse-group lasso.Journal of Com- putational and Graphical Statistics,22(2), 231–245. https://doi.org/10.1080/10618600.2012. 681250
-
[43]
Su, W., Bogdan, M., & Cand` es, E. (2017). False discoveries occur early on the lasso path.Annals of Statistics,45(5), 2133–2150. https://doi.org/10.1214/16-AOS1521
-
[44]
Tang, S., Wu, J., Fan, J., & Jin, C. (2025). Benign overfitting in out-of-distribution generalization of linear models.Proceedings of the International Conference on Learning Representations (ICLR)
work page 2025
- [45]
-
[46]
Tibshirani, R., Saunders, M., Rosset, S., Zhu, J., & Knight, K. (2005). Sparsity and smoothness via the fused lasso [Accessed February 15, 2026].Journal of the Royal Statistical Society. Series B (Statistical Methodology),67(1), 91–108. https://academic.oup.com/jrsssb/article- abstract/67/1/91/7110658 van de Geer, S., B¨ uhlmann, P., Ritov, Y., & Dezeure,...
-
[47]
Wainwright, M. J. (2009). Information-theoretic limits on sparsity recovery in the high-dimensional and noisy setting.IEEE Transactions on Information Theory,55(12), 5728–5741. https:// doi.org/10.1109/tit.2009.2032816
-
[48]
Wang, W., Wainwright, M. J., & Ramchandran, K. (2010). Information-theoretic limits on sparse signal recovery: Dense versus sparse measurement matrices.IEEE Transactions on Information Theory,56(6), 2967–2979. https://doi.org/10.1109/tit.2010.2046199
-
[49]
Wilkinson, L., & Dallal, G. E. (1981). Tests of significance in forward selection regression with an f-to-enter stopping rule.Technometrics,23(4), 377–380. https://doi.org/10.1080/00401706. 1981.10487682
-
[50]
Yuan, M., & Lin, Y. (2006). Model selection and estimation in regression with grouped variables [Accessed February 15, 2026].Journal of the Royal Statistical Society,68, 49–67. https:// www.scirp.org/reference/referencespapers?referenceid=2514485
work page 2006
-
[51]
Zhang, C.-H. (2010). Nearly unbiased variable selection under minimax concave penalty.Annals of Statistics,38(2), 894–942. https://doi.org/10.1214/09-aos729
-
[52]
Zhang, C.-H., & Zhang, S. S. (2014). Confidence intervals for low dimensional parameters in high di- mensional linear models.Journal of the Royal Statistical Society: Series B (Statistical Method- ology),76(1), 217–242
work page 2014
-
[53]
Zou, H. (2006). The adaptive lasso and its oracle properties.Journal of the American Statistical Association,101(476), 1418–1429. https://doi.org/10.1198/016214506000000735
-
[54]
Zou, H., & Hastie, T. (2005). Addendum: Regularization and variable selection via the elastic net. Journal of the Royal Statistical Society. Series B (Statistical Methodology),67(5), 768–768. https://doi.org/10.1111/j.1467-9868.2005.00527.x 32 Appendix A Sample Model Feature Distributions Figure A.1:Distributions of eigenvalues across 8 ML models sampled ...
discussion (0)
Sign in with ORCID, Apple, or X to comment. Anyone can read and Pith papers without signing in.