Recognition: no theorem link
Geometric Limits of Knowledge Distillation: A Minimum-Width Theorem via Superposition Theory
Pith reviewed 2026-05-13 16:52 UTC · model grok-4.3
The pith
Neural network width imposes a geometric limit on retained features during knowledge distillation, creating a permanent loss floor.
A machine-rendered reading of the paper's core claim, the machinery that carries it, and where it could break.
Core claim
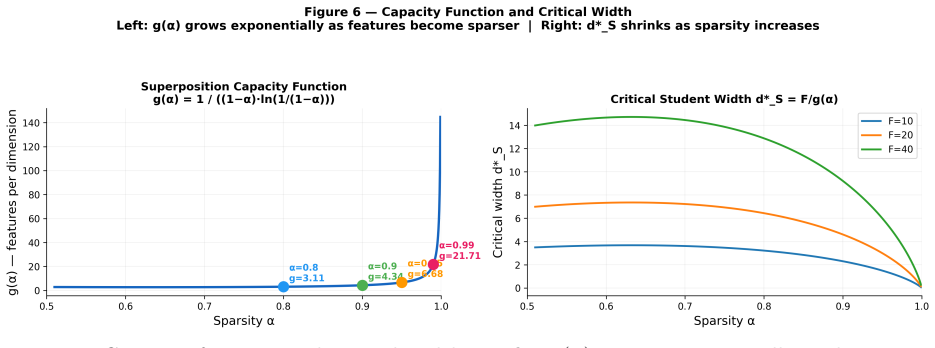
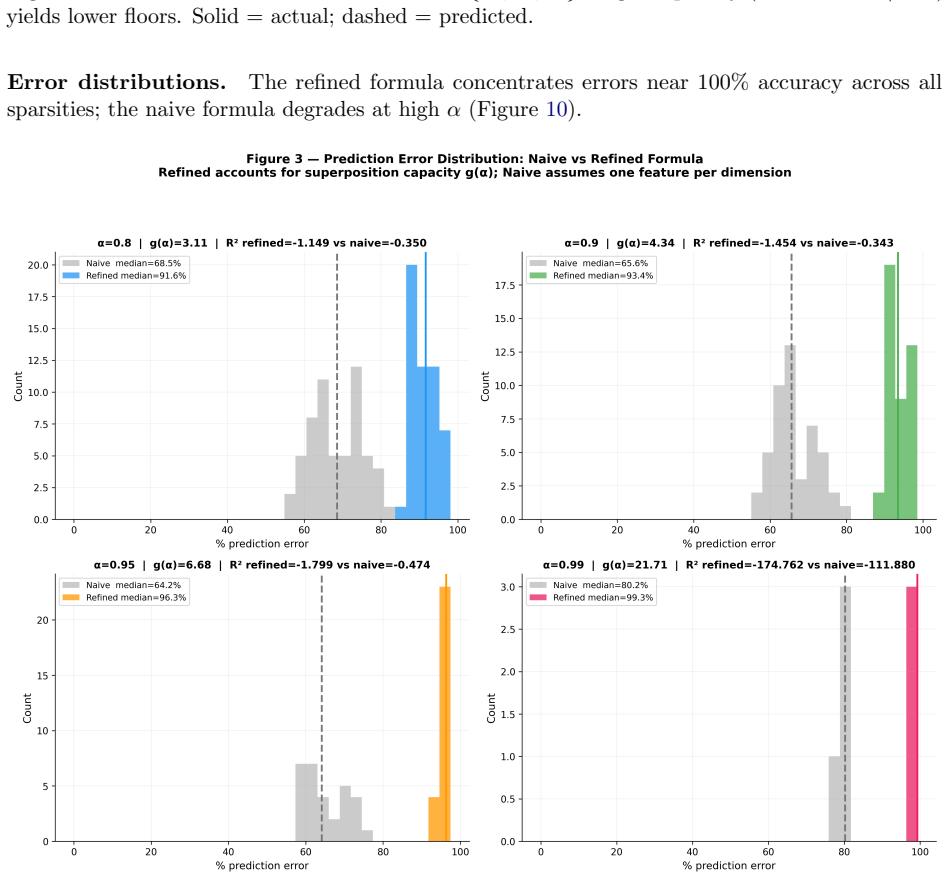
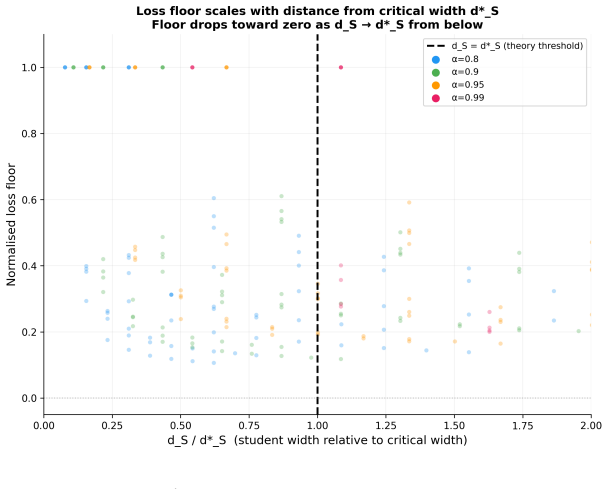
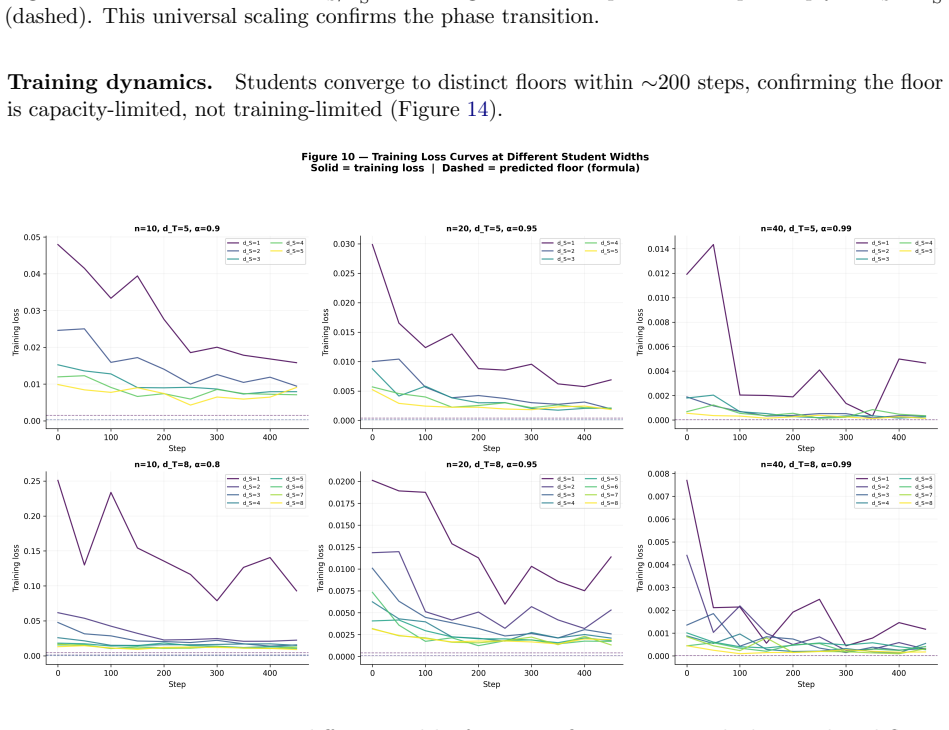
Neural networks represent more features than their dimensions allow by using superposition, but a student model with width d_S is limited to encoding at most d_S · g(α) features, where g(α) = 1/((1-α)ln(1/(1-α))). Any features beyond this budget are permanently lost, producing an importance-weighted loss floor in knowledge distillation that persists regardless of training method or objective.
What carries the argument
The superposition capacity bound d_S · g(α), with g(α) as the sparsity-dependent capacity function that determines the maximum number of features encodable in a given width.
If this is right
- Distillation performance is bounded by the geometric floor set by student width and teacher feature sparsity α.
- The observed loss floor can be decomposed into a geometric component and a width-independent architectural baseline with high accuracy.
- Coarse concepts remain even after losing 88 percent of features, but the loss comes from fine-grained features in the long tail of the importance distribution.
- Distillation floors can be predicted solely from sparse autoencoder measurements of the teacher's features without performing the distillation.
Where Pith is reading between the lines
- If the bound holds, increasing student width should monotonically lower the floor in a predictable way.
- The result may generalize to other model compression techniques that reduce effective width or capacity.
- Practitioners could use SAE feature counts to decide minimum viable student sizes before training.
Load-bearing premise
The superposition capacity of any network is strictly bounded by its width times g(α), independent of training method or objective, so that excess features cause permanent unrecoverable loss.
What would settle it
Finding a student model that recovers more features than d_S · g(α) as measured by sparse autoencoders after distillation, or achieving a lower loss floor than predicted by the geometric bound.
Figures


read the original abstract
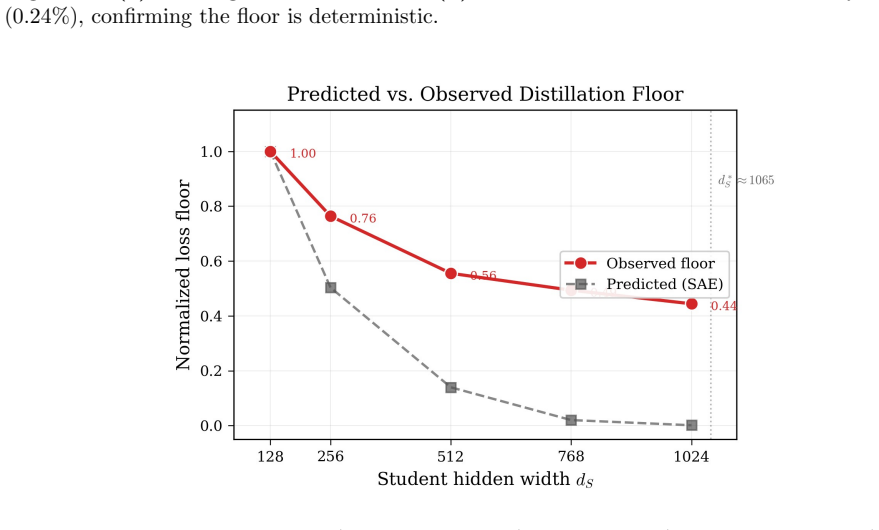
Knowledge distillation compresses large teachers into smaller students, but performance saturates at a loss floor that persists across training methods and objectives. We argue this floor is geometric: neural networks represent far more features than dimensions through superposition, and a student of width $d_S$ can encode at most $d_S \cdot g(\alpha)$ features, where $g(\alpha) = 1/((1-\alpha)\ln\frac{1}{1-\alpha})$ is a sparsity-dependent capacity function. Features beyond this budget are permanently lost, yielding an importance-weighted loss floor. We validate on a toy model (48 configurations, median accuracy >93%) and on Pythia-410M, where sparse autoencoders measure $F \approx 28{,}700$ features at $\alpha \approx 0.992$ (critical width $d_S^* \approx 1{,}065$). Distillation into five student widths confirms the predicted monotonic floor ordering. The observed floor decomposes into a geometric component and a width-independent architectural baseline ($R^2 = 0.993$). Linear probing shows coarse concepts survive even 88% feature loss, revealing the floor arises from aggregate loss of fine-grained features in the importance distribution's long tail. Our results connect representation geometry to distillation limits and provide a practical tool for predicting distillation performance from SAE measurements alone.
Editorial analysis
A structured set of objections, weighed in public.
Referee Report
Summary. The paper claims that knowledge distillation exhibits a geometric loss floor arising from superposition: networks encode more features than dimensions, so a student of width d_S encodes at most d_S · g(α) features where g(α) = 1/((1-α) ln(1/(1-α))), with excess features permanently lost and producing an importance-weighted floor. The claim is supported by a toy-model validation (48 configurations, median accuracy >93%) and Pythia-410M experiments where SAEs measure F ≈ 28,700 features at α ≈ 0.992 (critical width d_S^* ≈ 1,065); distillation into five student widths confirms monotonic floor ordering, the observed floor decomposes into geometric and architectural components (R² = 0.993), and linear probing shows coarse concepts survive 88% feature loss.
Significance. If the minimum-width theorem holds and the capacity bound is objective-independent, the work supplies a practical, SAE-based predictor of distillation floors and links representation geometry to compression limits. The toy-model accuracy and Pythia monotonicity are concrete strengths; the decomposition into geometric and baseline components is a useful empirical contribution. However, the result's significance is tempered by the need to demonstrate that g(α) is not post-hoc or data-dependent.
major comments (3)
- [Abstract / §3] Abstract and §3 (theorem statement): the explicit derivation of g(α) = 1/((1-α) ln(1/(1-α))) from superposition is not provided; without it the minimum-width claim that d_S · g(α) is a hard, objective-independent budget cannot be evaluated and risks being an ad-hoc fit to the observed floor.
- [Pythia experiments] Pythia experiments (α measurement and prediction): α ≈ 0.992 is obtained from SAE on the teacher itself and then used to predict the distillation floor on students of the same architecture; this introduces circularity that undermines the claim that the floor is a geometric prediction rather than a fitted quantity.
- [Distillation results / linear probing] Claim of permanent loss: the manuscript asserts features beyond d_S · g(α) are unrecoverable, yet no ablation compares distillation against direct training on the student or against objectives that reallocate capacity to high-importance features; without this the permanence and objective-independence of the bound remain unshown.
minor comments (2)
- [Decomposition paragraph] Clarify whether the importance-weighted loss used in the floor decomposition is the same as the distillation objective or a post-hoc diagnostic; this affects whether the geometric component is truly predictive.
- [Toy model validation] The toy-model section should report the exact distribution of the 48 configurations (widths, α values, feature importances) so readers can assess coverage of the claimed regime.
Simulated Author's Rebuttal
We thank the referee for the constructive comments on our work. We address each of the major comments in detail below, clarifying the theoretical foundations, experimental design, and proposing specific revisions to enhance the manuscript's clarity and rigor.
read point-by-point responses
-
Referee: [Abstract / §3] Abstract and §3 (theorem statement): the explicit derivation of g(α) = 1/((1-α) ln(1/(1-α))) from superposition is not provided; without it the minimum-width claim that d_S · g(α) is a hard, objective-independent budget cannot be evaluated and risks being an ad-hoc fit to the observed floor.
Authors: We agree that an explicit derivation is essential for evaluating the claim. The function g(α) is derived from the superposition theory by calculating the maximum number of features that can be represented in d dimensions with activation sparsity α, specifically using the formula arising from the expected overlap and the logarithmic term from the entropy or capacity calculation in sparse coding models. In the revised manuscript, we will add a dedicated subsection in §3 providing the full mathematical derivation step-by-step, starting from the feature activation model and arriving at g(α) = 1/((1-α) ln(1/(1-α))). This will establish that the bound is theoretically grounded rather than fitted. revision: yes
-
Referee: [Pythia experiments] Pythia experiments (α measurement and prediction): α ≈ 0.992 is obtained from SAE on the teacher itself and then used to predict the distillation floor on students of the same architecture; this introduces circularity that undermines the claim that the floor is a geometric prediction rather than a fitted quantity.
Authors: We appreciate the concern about potential circularity. The value of α is measured via SAE on the teacher to characterize its representation geometry, and the same α is used for prediction because the student models, being of the same family and trained via distillation to match the teacher's outputs, are hypothesized to operate under similar sparsity regimes. To mitigate this, we will revise the experiments section to include post-training SAE measurements of α for each student width, demonstrating consistency in α across models. Additionally, we will discuss the theoretical basis for why α is expected to be architecture-dependent but not task-specific in this context. revision: yes
-
Referee: [Distillation results / linear probing] Claim of permanent loss: the manuscript asserts features beyond d_S · g(α) are unrecoverable, yet no ablation compares distillation against direct training on the student or against objectives that reallocate capacity to high-importance features; without this the permanence and objective-independence of the bound remain unshown.
Authors: This comment highlights a key area for strengthening the evidence. Our current results, including the high R² decomposition and linear probing showing survival of coarse concepts, provide support for the geometric component being independent of specific objectives. However, to directly address permanence, we will include in the revision an additional experiment: training the student networks from scratch on the same downstream task without any distillation, and compare the achieved performance to the distillation floors. If the floors align closely, it would support that the bound is geometric and objective-independent. We believe this ablation is feasible and will add it to the manuscript. revision: yes
Circularity Check
No significant circularity; derivation uses independent measurements and validation
full rationale
The paper presents g(α) as a derived capacity function from superposition theory, measures α via SAE on the teacher (separate from distillation runs), and validates the resulting floor predictions empirically on toy models (48 configs) and Pythia distillation experiments. The central claim does not reduce by construction to its inputs; the observed floor is decomposed into geometric and baseline components with reported R²=0.993, and linear probing provides additional independent evidence. No load-bearing self-citation or fitted-parameter renaming is present.
Axiom & Free-Parameter Ledger
free parameters (1)
- α (sparsity level)
axioms (1)
- domain assumption Superposition permits representing more features than dimensions with sparsity controlled by α
Forward citations
Cited by 1 Pith paper
-
Linear-Readout Floors and Threshold Recovery in Computation in Superposition
Linear readouts incur an Omega(d^{-1/2}) crosstalk floor that caps the Hanni template at d^{3/2} capacity, while threshold recovery succeeds at quadratic loads for s = O(d/log d) sparsity, resolving the apparent contr...
Reference graph
Works this paper leans on
-
[1]
Sparse Autoencoders Find Highly Interpretable Features in Language Models
Hoagy Cunningham, Aidan Ewart, Logan Riggs, Robert Huben, and Lee Sharkey. Sparse autoen- coders find highly interpretable features in language models.arXiv preprint arXiv:2309.08600,
work page internal anchor Pith review Pith/arXiv arXiv
-
[2]
11 Nelson Elhage, Tristan Hume, Catherine Olsson, Nicholas Schiefer, Tom Henighan, Shauna Kravec, Zac Hatfield-Dodds, Robert Lasenby, Dawn Drain, Carol Chen, et al. Toy models of superposition. arXiv preprint arXiv:2209.10652,
work page internal anchor Pith review Pith/arXiv arXiv
-
[3]
The Pile: An 800GB Dataset of Diverse Text for Language Modeling
Leo Gao, Stella Biderman, Sid Black, Laurence Golding, Travis Hoppe, Charles Foster, Jason Phang, Horace He, Anish Thite, Noa Nabeshima, et al. The Pile: An 800GB dataset of diverse text for language modeling.arXiv preprint arXiv:2101.00027,
work page internal anchor Pith review Pith/arXiv arXiv
-
[4]
Distilling the Knowledge in a Neural Network
Geoffrey Hinton, Oriol Vinyals, and Jeff Dean. Distilling the knowledge in a neural network.arXiv preprint arXiv:1503.02531,
work page internal anchor Pith review Pith/arXiv arXiv
-
[5]
Adam Scherlis, Kshitij Sachan, Adam S Jermyn, Joe Benton, and Buck Shlegeris. Polysemanticity and capacity in neural networks.arXiv preprint arXiv:2210.01892,
-
[6]
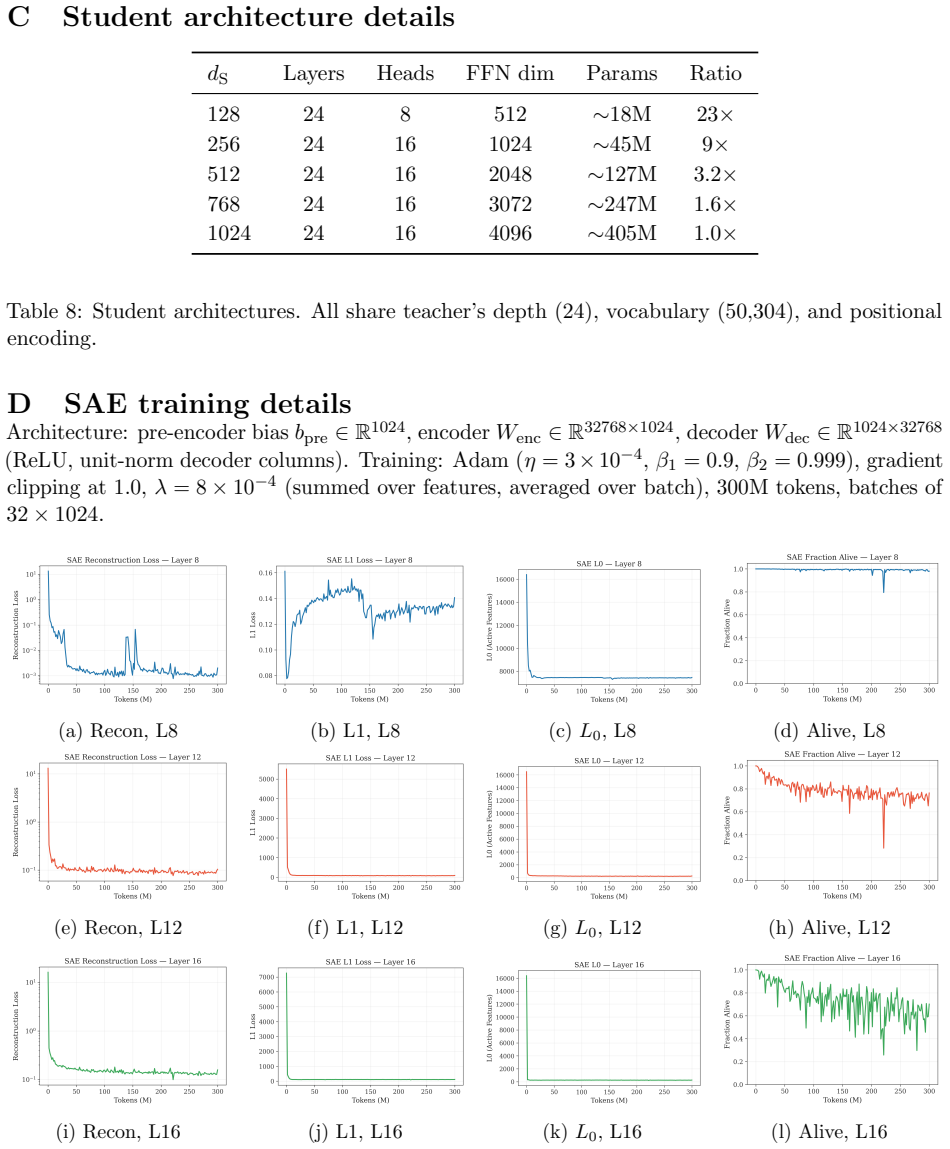
A Sparsity capacity function α1−α g(α) Features/dim 0.00 1.000 1.0 1.0× 0.50 0.500 2.9 2.9× 0.80 0.200 3.1 3.1× 0.90 0.100 4.3 4.3× 0.95 0.050 6.7 6.7× 0.99 0.010 21.7 21.7× 0.992 0.008 27.0 27.0× 0.999 0.001 145 145× Table 7: Reference values forg(α). B Additional toy model results Sparsity effect.Higher sparsity yields lower floors at every width becaus...
work page 2048
discussion (0)
Sign in with ORCID, Apple, or X to comment. Anyone can read and Pith papers without signing in.