Recognition: 2 theorem links
· Lean TheoremSolar-VLM: Multimodal Vision-Language Models for Augmented Solar Power Forecasting
Pith reviewed 2026-05-13 16:54 UTC · model grok-4.3
The pith
Solar-VLM fuses time-series observations, satellite cloud images, and weather text through graph attention to forecast photovoltaic power more accurately across sites.
A machine-rendered reading of the paper's core claim, the machinery that carries it, and where it could break.
Core claim
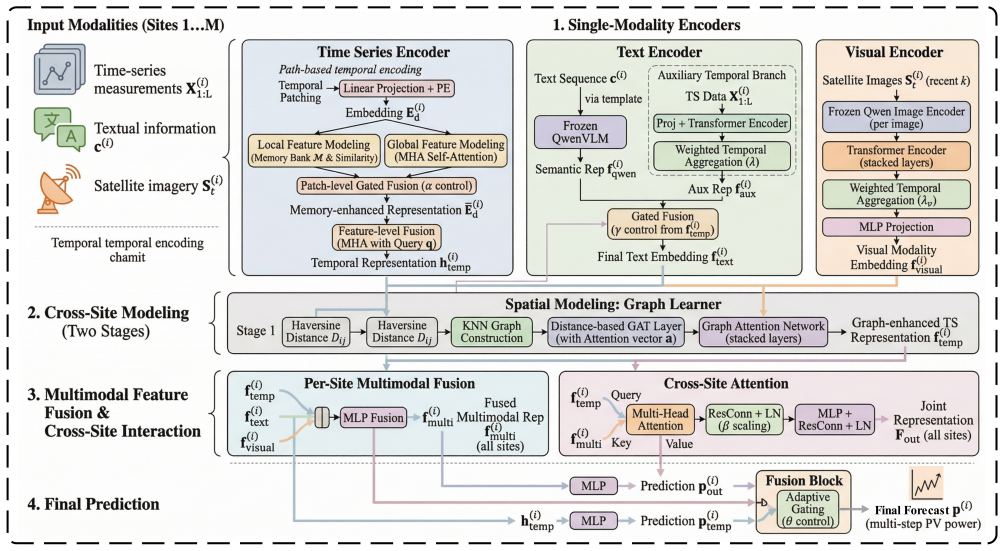
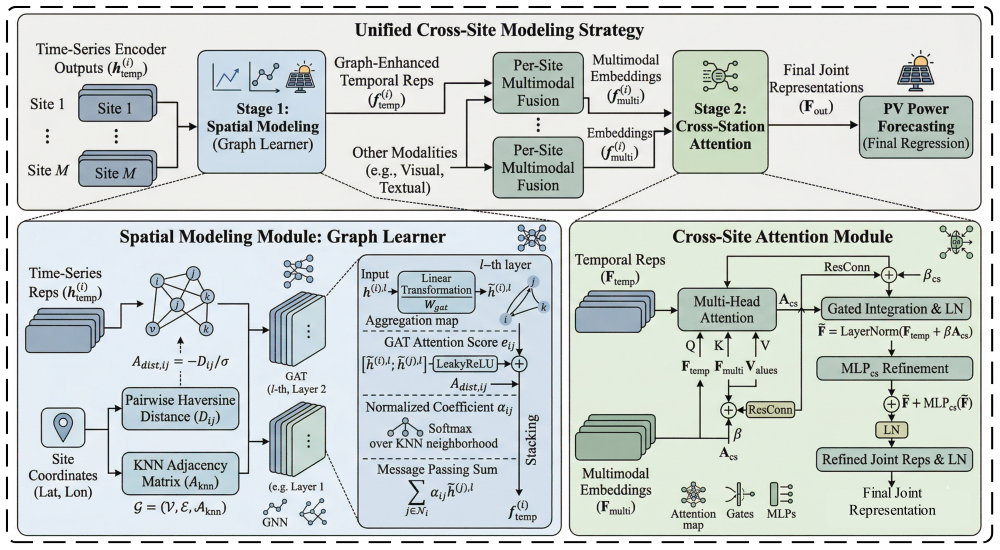
Solar-VLM is a large-language-model-driven framework that develops modality-specific encoders for time-series patch-based patterns, Qwen-based visual extraction of cloud cover from satellite images, and text distillation of weather characteristics, then applies a cross-site feature fusion mechanism with a Graph Learner on a KNN graph via graph attention network and a cross-site attention module to model inter-station correlations, demonstrating effectiveness on data from eight PV stations in a northern province of China.
What carries the argument
The cross-site feature fusion mechanism, which constructs a KNN graph over stations and uses graph attention network plus cross-site attention to integrate complementary features from the three modality encoders.
If this is right
- More accurate PV forecasts enable better power system dispatch and market participation decisions.
- Spatial modeling across sites reduces errors caused by localized cloud movements.
- Multimodal fusion incorporates cloud cover and weather text that single-source methods miss.
- Public release of the model code supports replication and further testing on new sites.
Where Pith is reading between the lines
- The same encoder-plus-graph structure could extend to wind power forecasting where weather text and imagery also matter.
- Adding real-time numerical weather prediction inputs might strengthen the text and visual pathways without redesigning the fusion layer.
- Larger underlying language models could improve the text encoder's handling of nuanced weather descriptions for edge cases like rapid weather shifts.
Load-bearing premise
The modality-specific encoders and cross-site graph fusion capture complementary spatiotemporal dependencies that produce practically superior forecasts.
What would settle it
Direct comparison of forecast error metrics on the eight-station dataset against non-multimodal or non-graph baselines, checking for absence of consistent improvement.
Figures


read the original abstract
Photovoltaic (PV) power forecasting plays a critical role in power system dispatch and market participation. Because PV generation is highly sensitive to weather conditions and cloud motion, accurate forecasting requires effective modeling of complex spatiotemporal dependencies across multiple information sources. Although recent studies have advanced AI-based forecasting methods, most fail to fuse temporal observations, satellite imagery, and textual weather information in a unified framework. This paper proposes Solar-VLM, a large-language-model-driven framework for multimodal PV power forecasting. First, modality-specific encoders are developed to extract complementary features from heterogeneous inputs. The time-series encoder adopts a patch-based design to capture temporal patterns from multivariate observations at each site. The visual encoder, built upon a Qwen-based vision backbone, extracts cloud-cover information from satellite images. The text encoder distills historical weather characteristics from textual descriptions. Second, to capture spatial dependencies across geographically distributed PV stations, a cross-site feature fusion mechanism is introduced. Specifically, a Graph Learner models inter-station correlations through a graph attention network constructed over a K-nearest-neighbor (KNN) graph, while a cross-site attention module further facilitates adaptive information exchange among sites. Finally, experiments conducted on data from eight PV stations in a northern province of China demonstrate the effectiveness of the proposed framework. Our proposed model is publicly available at https://github.com/rhp413/Solar-VLM.
Editorial analysis
A structured set of objections, weighed in public.
Referee Report
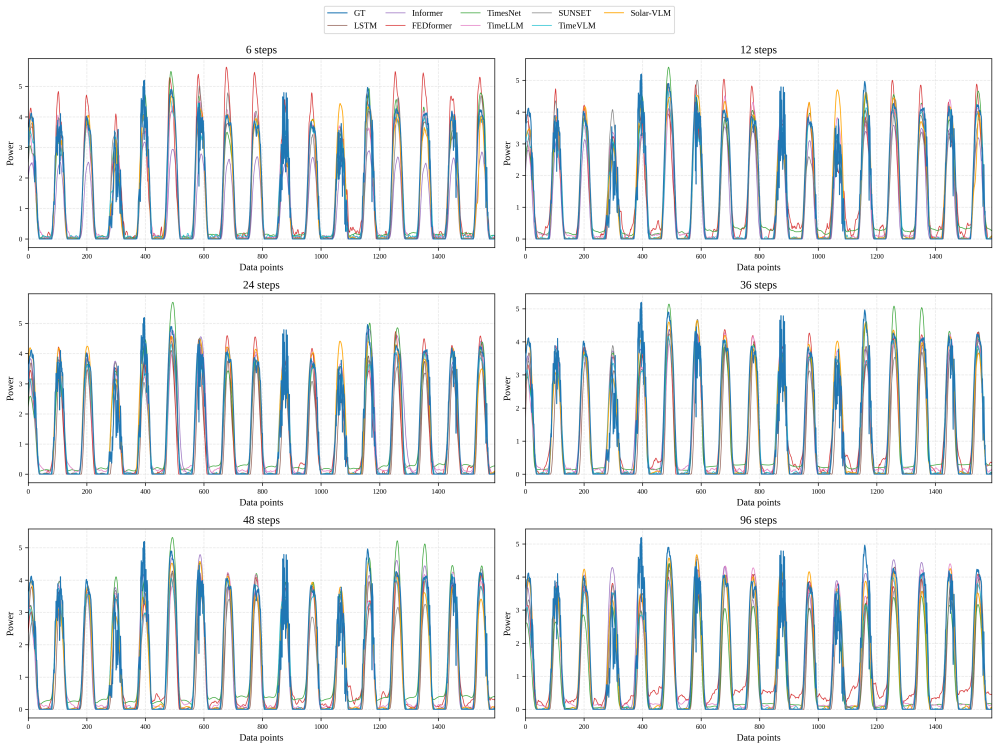
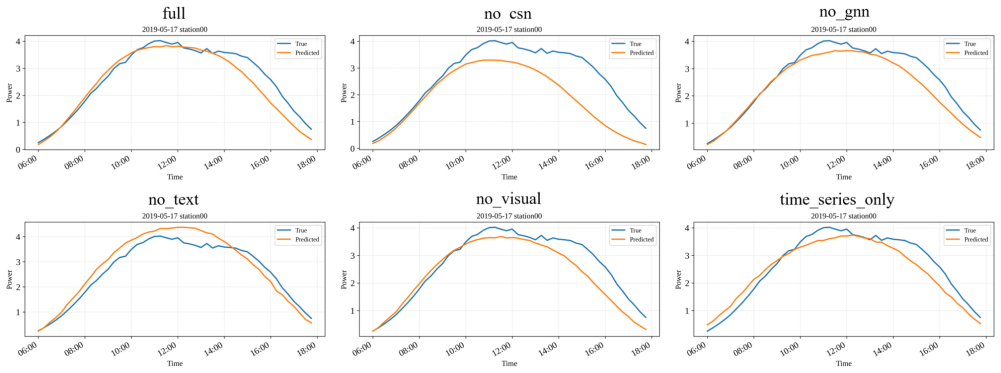
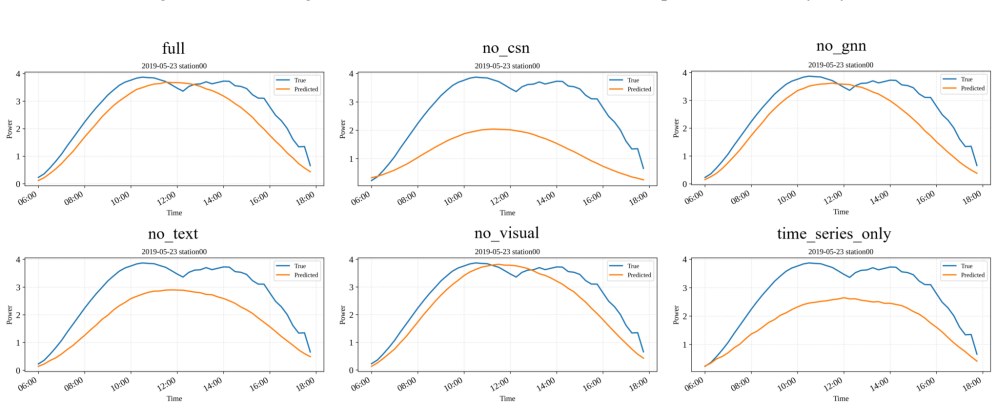
Summary. The paper proposes Solar-VLM, a multimodal framework for PV power forecasting that integrates modality-specific encoders (patch-based time-series, Qwen-based visual for satellite imagery, and text for weather descriptions) with a cross-site fusion mechanism using a KNN-graph attention network and cross-site attention module. Experiments on data from eight PV stations in northern China are reported to show effectiveness via baseline comparisons (LSTM, Transformer, unimodal variants) and ablations demonstrating RMSE/MAE reductions when components are removed; code is publicly released.
Significance. If the quantitative results hold, the work is significant for demonstrating measurable gains from multimodal fusion (temporal + visual + textual) and spatial graph modeling in solar forecasting, a domain where weather and cloud dynamics are critical. The inclusion of ablations, multiple baselines, and public code supports reproducibility and allows direct assessment of each component's contribution.
major comments (2)
- [§4.2] §4.2, Table 2: The ablation results indicate consistent RMSE/MAE drops when removing the graph fusion module, but the paper does not report station-wise variance or statistical tests (e.g., Wilcoxon signed-rank) across the eight sites; this weakens the claim that the cross-site mechanism yields practically superior forecasts rather than site-specific artifacts.
- [§3.2] §3.2: The KNN graph uses a fixed but unspecified K as a free hyperparameter; while ablations test the module's presence, no sensitivity analysis over K values or justification for the chosen K is provided, leaving open whether performance gains are robust or tuned to the specific eight-station topology.
minor comments (3)
- [Abstract] Abstract: The claim of 'demonstrate the effectiveness' would be strengthened by briefly stating the magnitude of key improvements (e.g., average RMSE reduction) rather than leaving it entirely to the results section.
- [§4.1] §4.1: Dataset description omits explicit train/validation/test split ratios and exact temporal coverage; although code is public, these details should appear in the manuscript for standalone readability.
- [Figure 3] Figure 3: The attention visualization would benefit from clearer labeling of which modality contributes to each highlighted region in the satellite images.
Simulated Author's Rebuttal
We thank the referee for the insightful comments and the recommendation for minor revision. We address each major comment below and have incorporated the suggested improvements in the revised manuscript.
read point-by-point responses
-
Referee: [§4.2] §4.2, Table 2: The ablation results indicate consistent RMSE/MAE drops when removing the graph fusion module, but the paper does not report station-wise variance or statistical tests (e.g., Wilcoxon signed-rank) across the eight sites; this weakens the claim that the cross-site mechanism yields practically superior forecasts rather than site-specific artifacts.
Authors: We thank the referee for pointing this out. We have now included station-wise performance metrics with mean and standard deviation across the eight sites in the revised Table 2. Furthermore, we conducted Wilcoxon signed-rank tests on the paired RMSE values across stations, yielding p < 0.01 for the comparison against the strongest baseline and p < 0.05 against the no-graph-fusion variant. These additions confirm that the improvements are statistically significant and not due to site-specific artifacts. We have updated §4.2 accordingly. revision: yes
-
Referee: [§3.2] §3.2: The KNN graph uses a fixed but unspecified K as a free hyperparameter; while ablations test the module's presence, no sensitivity analysis over K values or justification for the chosen K is provided, leaving open whether performance gains are robust or tuned to the specific eight-station topology.
Authors: We acknowledge that the value of K was not explicitly stated and no sensitivity analysis was provided. In our experiments, K was set to 3, chosen to reflect the typical connectivity in the eight-station network based on geographic proximity. We have added a sensitivity study in the revised §3.2, evaluating K from 1 to 5, which shows that performance peaks at K=3 and remains robust for K=2 to 4. The chosen K and the analysis will be detailed in the manuscript revision. revision: yes
Circularity Check
No significant circularity in empirical multimodal framework
full rationale
The paper presents an architectural proposal (modality-specific encoders for time-series, satellite imagery via Qwen vision backbone, and text, followed by KNN-graph attention fusion) whose central claim is empirical effectiveness on eight-station PV data. No equations, derivations, or first-principles predictions are supplied that reduce to fitted inputs by construction. Validation relies on external baselines (LSTM, Transformer, unimodal variants) and ablation tables showing measurable RMSE/MAE gains, satisfying independence from self-referential fitting. Public code further allows external reproduction. This is the standard case of a self-contained empirical contribution with no load-bearing circular steps.
Axiom & Free-Parameter Ledger
free parameters (1)
- K in KNN graph
axioms (2)
- domain assumption Modality-specific encoders extract complementary features from time-series, images, and text
- domain assumption Graph attention over KNN graph captures spatial dependencies across PV sites
Lean theorems connected to this paper
-
IndisputableMonolith/Cost/FunctionalEquation.leanwashburn_uniqueness_aczel unclearmodality-specific encoders... Graph Learner... KNN graph... cross-site attention
-
IndisputableMonolith/Foundation/RealityFromDistinction.leanreality_from_one_distinction unclearexperiments on eight PV stations... ablation tables
Reference graph
Works this paper leans on
-
[1]
A. Q. Al-Shetwi, M. A. Hannan, K. P. Jern, M. Mansur, T. M. I. Mahlia, Grid-connected renewable energy sources: Review of the recent integration requirements and control methods, Journal of Cleaner Production 253 (2020) 119831
work page 2020
-
[2]
F. Wang, Z. Xuan, Z. Zhen, K. Li, T. Wang, M. Shi, A day-ahead pv power forecasting method based on lstm-rnn model and time correlation modification under partial daily pattern prediction framework, Energy Conversion and Management 212 (2020) 112766
work page 2020
- [3]
-
[4]
R. H. Inman, H. T. C. Pedro, C. F. M. Coimbra, Solar forecasting methods for renewable energy integration, Progress in Energy and Combustion Science 39 (6) (2013) 535–576
work page 2013
-
[5]
H. Ye, B. Yang, Y. Han, N. Chen, State-of-the-art solar energy forecasting approaches: Critical potentials and challenges, Frontiers in Energy Research 10 (2022) 875790
work page 2022
-
[6]
V. Kushwaha, N. M. Pindoriya, A sarima-rvfl hybrid model assisted by wavelet decomposition for very short-term solar pv power generation forecast, Renewable Energy 140 (C) (2019) 124–139
work page 2019
-
[7]
M. Pan, C. Li, R. Gao, Y. Huang, H. You, T. Gu, F. Qin, Photovoltaic power forecasting based on a support vector machine with improved ant colony optimization, Journal of Cleaner Production 277 (2020) 123948
work page 2020
-
[8]
D. Liu, K. Sun, Random forest solar power forecast based on classification optimization, Energy 187 (2019) 115940
work page 2019
-
[9]
C.Persson,P.Bacher,T.Shiga,H.Madsen,Multi-sitesolarpowerforecastingusinggradientboosted regression trees, Solar Energy 150 (2017) 423–436. 22
work page 2017
- [10]
-
[11]
P. Li, K. Zhou, X. Lu, S. Yang, A hybrid deep learning model for short-term pv power forecasting, Applied Energy 259 (2020) 114216
work page 2020
-
[12]
K.Tao,J.Zhao,Y.Tao,Q.Qi,Y.Tian,Operationalday-aheadphotovoltaicpowerforecastingbased on transformer variant, Applied Energy 373 (2024) 123825
work page 2024
-
[13]
Y. Yang, Y. Liu, Y. Zhang, S. Shu, J. Zheng, Dest-gnn: A double-explored spatio-temporal graph neural network for multi-site intra-hour pv power forecasting, Applied Energy 378 (2025) 124744
work page 2025
- [14]
-
[15]
A. Verdone, S. Scardapane, M. Panella, Explainable spatio-temporal graph neural networks for multi-site photovoltaic energy production, Appl. Energy 353 (2024) 122151
work page 2024
-
[16]
Y. Fu, H. Chai, Z. Zhen, F. Wang, X. Xu, K. Li, M. Shafie-Khah, P. Dehghanian, J. P. S. Catalão, Sky image prediction model based on convolutional auto-encoder for minutely solar pv power forecasting, IEEE Transactions on Industry Applications 57 (4) (2021) 3272–3281
work page 2021
-
[17]
S.Xu,R.Zhang,H.Ma,C.Ekanayake,Y.Cui,Onvisiontransformerforultra-short-termforecasting of photovoltaic generation using sky images, Solar Energy 267 (2024) 112203
work page 2024
-
[18]
J. Qin, H. Jiang, N. Lu, L. Yao, C. Zhou, Enhancing solar pv output forecast by integrating ground and satellite observations with deep learning, Renewable and Sustainable Energy Reviews 167 (2022) 112680
work page 2022
-
[19]
Y. Nie, A. S. Zamzam, A. Brandt, Resampling and data augmentation for short-term pv output prediction based on an imbalanced sky images dataset using convolutional neural networks, Solar Energy 224 (2021) 341–354
work page 2021
- [20]
-
[21]
LLaMA: Open and Efficient Foundation Language Models
H. Touvron, T. Lavril, G. Izacard, X. Martinet, M.-A. Lachaux, T. Lacroix, B. Rozière, N. Goyal, E. Hambro, F. Azhar, A. Rodriguez, A. Joulin, E. Grave, G. Lample, LLaMA: Open and efficient foundation language models (2023). arXiv:2302.13971
work page internal anchor Pith review Pith/arXiv arXiv 2023
- [22]
-
[23]
C. Chang, W.-Y. Wang, W.-C. Peng, T.-F. Chen, Llm4ts: Aligning pre-trained llms as data-efficient time-series forecasters, ACM Transactions on Intelligent Systems and Technology 16 (3) (2025) 1–20. 23
work page 2025
-
[24]
T.Zhou,P.Niu,X.Wang,L.Sun,R.Jin,Onefitsall: powergeneraltimeseriesanalysisbypretrained lm,in: Proceedingsofthe37thInternationalConferenceonNeuralInformationProcessingSystems, NIPS ’23, Curran Associates Inc., Red Hook, NY, USA, 2023
work page 2023
-
[25]
M. Jin, S. Wang, L. Ma, Z. Chu, J. Y. Zhang, X. Shi, P.-Y. Chen, Y. Liang, Y.-F. Li, S. Pan, Q. Wen, Time-LLM: Time series forecasting by reprogramming large language models, in: The Twelfth International Conference on Learning Representations, 2024
work page 2024
-
[26]
X.Liu,J.Hu,Y.Li,S.Diao,Y.Liang,B.Hooi,R.Zimmermann,UniTime: Alanguage-empowered unifiedmodelforcross-domaintimeseriesforecasting,in: ProceedingsoftheACMWebConference 2024,WWW’24,AssociationforComputingMachinery,NewYork,NY,USA,2024,p.4095–4106
work page 2024
-
[27]
W. Kim, B. Son, I. Kim, ViLT: Vision-and-language transformer without convolution or region supervision, in: International conference on machine learning, PMLR, 2021, pp. 5583–5594
work page 2021
-
[28]
A.Radford,J.W.Kim,C.Hallacy,A.Ramesh,G.Goh,S.Agarwal,G.Sastry,A.Askell,P.Mishkin, J. Clark, et al., Learning transferable visual models from natural language supervision, in: Interna- tional conference on machine learning, PmLR, 2021, pp. 8748–8763
work page 2021
-
[29]
H. Liu, C. Li, Q. Wu, Y. J. Lee, Visual instruction tuning, in: Advances in Neural Information Processing Systems, Vol. 36, Curran Associates, Inc., 2023, pp. 34892–34916
work page 2023
- [30]
-
[31]
H. Zhou, S. Zhang, J. Peng, S. Zhang, J. Li, H. Xiong, W. Zhang, Informer: Beyond efficient transformer for long sequence time-series forecasting, in: Proceedings of the AAAI conference on artificial intelligence, Vol. 35, 2021, pp. 11106–11115
work page 2021
-
[32]
T. Zhou, Z. Ma, Q. Wen, X. Wang, L. Sun, R. Jin, Fedformer: Frequency enhanced decomposed transformer for long-term series forecasting, in: International conference on machine learning, PMLR, 2022, pp. 27268–27286
work page 2022
-
[33]
H. Wu, T. Hu, Y. Liu, H. Zhou, J. Wang, M. Long, Timesnet: Temporal 2d-variation modeling for generaltimeseriesanalysis,in: TheEleventhInternationalConferenceonLearningRepresentations, 2023
work page 2023
-
[34]
Y. Sun, V. Venugopal, A. R. Brandt, Short-term solar power forecast with deep learning: Exploring optimal input and output configuration, Solar Energy 188 (2019) 730–741
work page 2019
-
[35]
Z. Siru, R. Weilin, M. Jin, L. Huan, W. Qingsong, L. Yuxuan, Time-VLM: Exploring multimodal vision-languagemodelsforaugmentedtimeseriesforecasting,in: Forty-SecondInternationalCon- ference on Machine Learning (ICML 2025), Proceedings of Machine Learning Research, 2025. 24
work page 2025
discussion (0)
Sign in with ORCID, Apple, or X to comment. Anyone can read and Pith papers without signing in.