Recognition: 2 theorem links
· Lean TheoremIdentifying signatures of inflow onto face-on galaxies using the Balmer decrement
Pith reviewed 2026-05-10 18:51 UTC · model grok-4.3
The pith
Foreground gas in face-on galaxies shows lower Balmer decrements than gas in or behind the disk.
A machine-rendered reading of the paper's core claim, the machinery that carries it, and where it could break.
Core claim
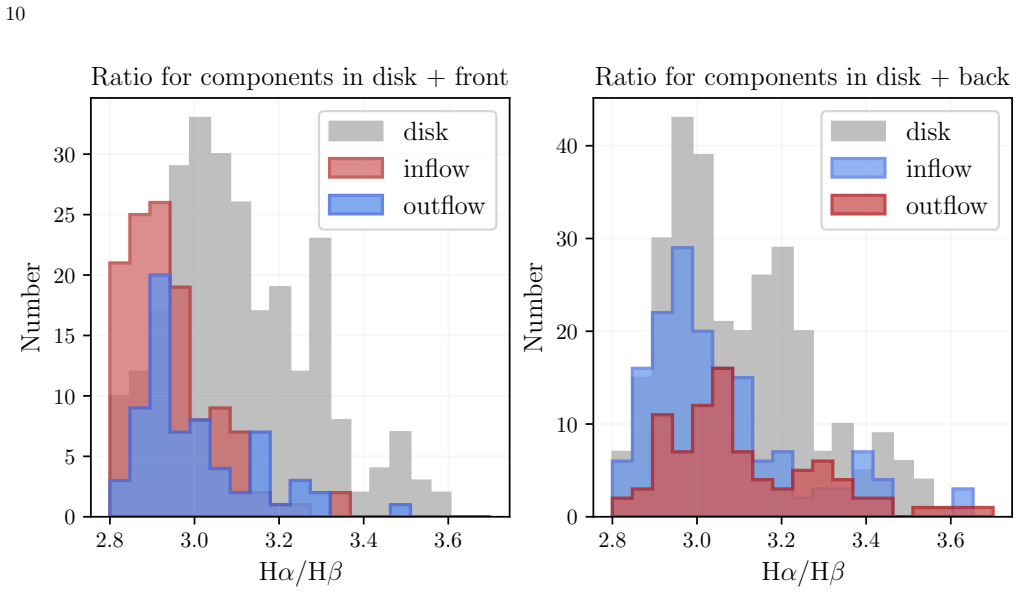
In mock spatial-spectral observations of an isolated Milky Way-mass galaxy, gas components located in front of the disk exhibit systematically lower Balmer decrements than gas embedded in or behind the disk, with a mean front-back offset of Δ(Hα/Hβ) ≈ −0.14. The extremely clumpy, multiphase dust distribution along each line of sight introduces substantial scatter that limits clean separation between disk and far-side components. The results indicate that the Balmer decrement supplies a useful observational diagnostic of inflow and outflow geometry in dusty face-on galaxies.
What carries the argument
The Balmer decrement (Hα/Hβ intensity ratio) used as a position-dependent diagnostic that exploits differential dust extinction for gas in front of versus within or behind the galactic disk.
If this is right
- Observers gain a method to flag likely inflowing gas in emission-line maps of low-inclination galaxies where velocity information alone is ambiguous.
- The diagnostic applies specifically to dusty systems and works in emission, complementing absorption-line studies that are restricted to limited sightlines.
- Foreground components selected by lower Balmer decrements can be isolated statistically even when dust clumpiness prevents clean separation for every individual pixel.
- The approach enables studies of accretion in face-on disks that would otherwise be confused with far-side outflows of similar Doppler shift.
Where Pith is reading between the lines
- The same spatial-spectral data sets could be cross-checked with additional line ratios or metallicity maps to strengthen the inflow identification.
- Varying the dust content or star-formation intensity across a suite of simulations would test how sensitive the 0.14 offset is to galaxy properties.
- If the offset holds in observations, statistical samples of face-on galaxies could yield average inflow rates without requiring individual kinematic decomposition.
Load-bearing premise
The simulated galaxy and its multiphase clumpy dust distribution accurately represent conditions in real isolated star-forming galaxies such that the front-back Balmer decrement offset survives observational noise and selection effects.
What would settle it
A survey of real face-on star-forming galaxies using integral-field spectroscopy that finds no systematic average difference in Balmer decrement between kinematically distinct foreground and background gas components would falsify the proposed diagnostic.
Figures


read the original abstract
Isolated star-forming galaxies require inflows of fresh gas from the surrounding medium to sustain episodes of star formation over time. However, there are very few direct detections of accretion onto external galaxies. Studies in absorption can only observe along limited sightlines, while those in emission can have difficulty distinguishing inflowing gas in the foreground of the galactic disk from similarly Doppler-shifted outflowing gas in the background. We explore the possibility of using the Balmer decrement (H$\alpha$/H$\beta$) in low-inclination systems as a diagnostic for disentangling the flow geometry in disk-like galaxies. We leverage mock spatial-spectral observations of an isolated Milky Way-mass galaxy simulated using the radiation-hydrodynamics code AREPO-RT and post-processed with the Monte Carlo radiative transfer code COLT. We find that gas components located in front of the disk exhibit systematically lower Balmer decrements than gas embedded in or behind the disk, with a mean front-back offset of $\Delta(\text{H}\alpha/\text{H}\beta) \approx -0.14$. The ability to differentiate between the disk and far-side components is limited by the extremely clumpy, multiphase dust distribution along the line of sight introducing substantial scatter. Overall, the results provide a useful observational diagnostic of inflow and outflow in dusty face-on galaxies.
Editorial analysis
A structured set of objections, weighed in public.
Referee Report
Summary. The manuscript uses radiation-hydrodynamics simulations of an isolated Milky Way-mass galaxy with AREPO-RT, followed by Monte Carlo radiative transfer post-processing with COLT, to generate mock spatial-spectral observations. It reports that gas components located in front of the disk exhibit systematically lower Balmer decrements than gas embedded in or behind the disk, with a mean front-back offset of Δ(Hα/Hβ) ≈ -0.14, and proposes this as an observational diagnostic for inflows in low-inclination galaxies, while noting substantial scatter from the clumpy multiphase dust distribution.
Significance. If the offset is robust, the work supplies a concrete geometric diagnostic for separating inflow from outflow signatures in emission-line studies of face-on star-forming galaxies, where velocity information alone is ambiguous. The forward-modeling approach with established codes (AREPO-RT and COLT) directly ties the result to radiative transfer through a realistic, clumpy dust geometry rather than to fitted parameters, strengthening the interpretation.
major comments (1)
- [Abstract and Results] Abstract and Results: The central mean offset Δ(Hα/Hβ) ≈ -0.14 is presented as a direct measurement from the mocks, but the text provides no quantitative information on the number of sightlines or gas parcels sampled, the exact velocity or spatial criteria used to classify components as 'front,' 'embedded,' or 'behind,' the procedure for computing the mean and its uncertainty, or the statistical characterization of the clumpy-dust scatter (e.g., standard deviation, distribution shape, or fraction of sightlines showing the offset). These details are load-bearing for assessing whether the reported offset is statistically meaningful and observationally usable.
minor comments (2)
- [Abstract] The abstract states that the distinction is 'limited by the extremely clumpy, multiphase dust distribution' but does not quantify how this scatter would propagate into observational error bars or selection biases; a short additional sentence or figure panel would clarify the practical utility.
- [Throughout] Notation for the Balmer decrement is occasionally inconsistent (Hα/Hβ versus the Δ symbol); uniform usage throughout would improve readability.
Simulated Author's Rebuttal
We thank the referee for their careful reading of the manuscript and for the positive recommendation of minor revision. Their comment has identified an important gap in the presentation of our quantitative results, and we have revised the paper to address it directly.
read point-by-point responses
-
Referee: [Abstract and Results] Abstract and Results: The central mean offset Δ(Hα/Hβ) ≈ -0.14 is presented as a direct measurement from the mocks, but the text provides no quantitative information on the number of sightlines or gas parcels sampled, the exact velocity or spatial criteria used to classify components as 'front,' 'embedded,' or 'behind,' the procedure for computing the mean and its uncertainty, or the statistical characterization of the clumpy-dust scatter (e.g., standard deviation, distribution shape, or fraction of sightlines showing the offset). These details are load-bearing for assessing whether the reported offset is statistically meaningful and observationally usable.
Authors: We agree that these methodological and statistical details were insufficiently quantified in the original text and that their inclusion strengthens the reader's ability to assess the result. In the revised manuscript we have added a new subsection in the Methods section and expanded the Results to specify: the total number of independent sightlines sampled through the galaxy; the precise spatial (position relative to the disk midplane) and velocity criteria used to classify gas components as front, embedded, or behind; the exact procedure for computing the mean offset (simple average across classified components) together with its uncertainty (standard error of the mean, confirmed via bootstrap resampling); and a full statistical characterization of the scatter, including the standard deviation, the shape of the distribution, and the fraction of sightlines that exhibit a negative offset. We have also added a supplementary figure showing the Balmer-decrement histograms for each geometric category to illustrate the clumpy-dust contribution to the scatter. These additions are now referenced from the Abstract and Results so that the reported mean offset of ≈ −0.14 is placed on a firmer quantitative footing. revision: yes
Circularity Check
No significant circularity: forward-modeling result from established radiative transfer codes
full rationale
The central result (mean front-back Balmer decrement offset of ≈−0.14) is obtained by running AREPO-RT radiation-hydrodynamics on an isolated Milky Way-mass galaxy, then post-processing with the Monte Carlo code COLT to produce mock spatial-spectral observations, and finally measuring the Hα/Hβ ratio separately for gas components classified by their geometric position relative to the disk. This is a direct numerical measurement of an output quantity under the simulated dust geometry and radiative transfer; it does not involve fitting any parameter to the target observable, redefining the observable in terms of itself, or relying on a self-citation chain for the load-bearing step. The codes are standard, externally validated tools, and the paper explicitly notes the large scatter from clumpy dust as the main limitation rather than claiming a parameter-free analytic derivation.
Axiom & Free-Parameter Ledger
axioms (2)
- domain assumption The AREPO-RT simulation produces a realistic multiphase ISM and dust distribution for an isolated Milky Way-mass galaxy.
- domain assumption COLT radiative transfer accurately computes the observed Balmer decrement including dust extinction and scattering for the chosen lines of sight.
Lean theorems connected to this paper
-
IndisputableMonolith/Cost/FunctionalEquation.leanwashburn_uniqueness_aczel unclear?
unclearRelation between the paper passage and the cited Recognition theorem.
gas components located in front of the disk exhibit systematically lower Balmer decrements than gas embedded in or behind the disk, with a mean front-back offset of Δ(Hα/Hβ)≈−0.14
-
IndisputableMonolith/Foundation/AlexanderDuality.leanalexander_duality_circle_linking unclear?
unclearRelation between the paper passage and the cited Recognition theorem.
mock spatial-spectral observations of an isolated Milky Way-mass galaxy simulated using the radiation-hydrodynamics code AREPO-RT and post-processed with the Monte Carlo radiative transfer code COLT
What do these tags mean?
- matches
- The paper's claim is directly supported by a theorem in the formal canon.
- supports
- The theorem supports part of the paper's argument, but the paper may add assumptions or extra steps.
- extends
- The paper goes beyond the formal theorem; the theorem is a base layer rather than the whole result.
- uses
- The paper appears to rely on the theorem as machinery.
- contradicts
- The paper's claim conflicts with a theorem or certificate in the canon.
- unclear
- Pith found a possible connection, but the passage is too broad, indirect, or ambiguous to say the theorem truly supports the claim.
Reference graph
Works this paper leans on
-
[1]
2018, MNRAS, 478, 4905, doi:10.1093/mnras/sty1431
Shimizu, I. 2018, MNRAS, 478, 4905, doi: 10.1093/mnras/sty1431
-
[2]
Bacon, R., Accardo, M., Adjali, L., et al. 2010, in Society of Photo-Optical Instrumentation Engineers (SPIE) Conference Series, Vol. 7735, Ground-based and Airborne Instrumentation for Astronomy III, ed. I. S. McLean, S. K. Ramsay, & H. Takami, 773508, doi: 10.1117/12.856027
-
[3]
Baron, D., Netzer, H., Lutz, D., Davies, R. I., & Prochaska, J. X. 2024, ApJ, 968, 23, doi: 10.3847/1538-4357/ad39e9
-
[4]
Bolda, C., Li, Z., Erb, D. K., Steidel, C. C., & Chen, Y. 2025, ApJ, 982, 54, doi: 10.3847/1538-4357/adb586 Bouch´ e, N., Finley, H., Schroetter, I., et al. 2016, ApJ, 820, 121, doi: 10.3847/0004-637X/820/2/121
-
[5]
Bruzual, G., & Charlot, S. 2003, MNRAS, 344, 1000, doi: 10.1046/j.1365-8711.2003.06897.x
-
[6]
Calzetti, D., Armus, L., Bohlin, R. C., et al. 2000, ApJ, 533, 682, doi: 10.1086/308692
work page internal anchor Pith review doi:10.1086/308692 2000
-
[7]
The Astrophysical Journal , author =
Calzetti, D., Kinney, A. L., & Storchi-Bergmann, T. 1994, ApJ, 429, 582, doi: 10.1086/174346 16
-
[8]
2009, in The Galaxy Disk in Cosmological Context, ed
Chiappini, C. 2009, in The Galaxy Disk in Cosmological Context, ed. J. Andersen, Nordstr¨ oara, B. m, & J. Bland-Hawthorn, Vol. 254, 191–196, doi: 10.1017/S1743921308027580
-
[9]
Chiappini, C., Matteucci, F., & Gratton, R. 1997, ApJ, 477, 765, doi: 10.1086/303726
-
[10]
Chomiuk, L., & Povich, M. S. 2011, AJ, 142, 197, doi: 10.1088/0004-6256/142/6/197
-
[11]
Clark, S., Bordoloi, R., & Fox, A. J. 2022, MNRAS, 512, 811, doi: 10.1093/mnras/stac504
-
[12]
Coleman, E., Keerthi, V. G. C., Chen, Y., et al. 2024, ApJL, 977, L23, doi: 10.3847/2041-8213/ad93d0
-
[13]
2016, ApJ, 827, 148, doi: 10.3847/0004-637X/827/2/148
Corlies, L., & Schiminovich, D. 2016, ApJ, 827, 148, doi: 10.3847/0004-637X/827/2/148
-
[14]
Draine, B. T. 2011, Physics of the Interstellar and Intergalactic Medium
2011
-
[15]
Drory, N., MacDonald, N., Bershady, M. A., et al. 2015, AJ, 149, 77, doi: 10.1088/0004-6256/149/2/77
-
[16]
2022, ApJ, 941, 162, doi: 10.3847/1538-4357/aca27d
Elia, D., Molinari, S., Schisano, E., et al. 2022, ApJ, 941, 162, doi: 10.3847/1538-4357/aca27d
-
[17]
Fenner, Y., & Gibson, B. K. 2003, PASA, 20, 189, doi: 10.1071/AS02047
-
[18]
Fluetsch, A., Maiolino, R., Carniani, S., et al. 2021, MNRAS, 505, 5753, doi: 10.1093/mnras/stab1666
-
[19]
The Merger Rates and Mass Assembly Histories of Dark Matter Haloes in the Two
Genzel, R., Tacconi, L. J., Gracia-Carpio, J., et al. 2010, MNRAS, 407, 2091, doi: 10.1111/j.1365-2966.2010.16969.x
-
[20]
Groves, B., Brinchmann, J., & Walcher, C. J. 2011, Monthly Notices of the Royal Astronomical Society, 419, 1402, doi: 10.1111/j.1365-2966.2011.19796.x
-
[21]
Hill, G. J., MacQueen, P. J., Tejada, C., et al. 2004, in Society of Photo-Optical Instrumentation Engineers (SPIE) Conference Series, Vol. 5492, Ground-based Instrumentation for Astronomy, ed. A. F. M. Moorwood & M. Iye, 251–261, doi: 10.1117/12.552474
-
[22]
James, B. L., Berg, D. A., King, T., et al. 2022, ApJS, 262, 37, doi: 10.3847/1538-4365/ac8008
-
[23]
Johnson, S. D., Schaye, J., Walth, G. L., et al. 2022, ApJL, 940, L40, doi: 10.3847/2041-8213/aca28e
-
[24]
2020, MNRAS, 499, 5732, doi: 10.1093/mnras/staa3249
Kannan, R., Marinacci, F., Vogelsberger, M., et al. 2020, MNRAS, 499, 5732, doi: 10.1093/mnras/staa3249
-
[25]
2019, MNRAS, 485, 117, doi: 10.1093/mnras/stz287
Kannan, R., Vogelsberger, M., Marinacci, F., et al. 2019, MNRAS, 485, 117, doi: 10.1093/mnras/stz287
-
[26]
2013, ApJ, 771, 62, doi: 10.1088/0004-637X/771/1/62
Kreckel, K., Groves, B., Schinnerer, E., et al. 2013, ApJ, 771, 62, doi: 10.1088/0004-637X/771/1/62
-
[27]
Lehner, N., & Howk, J. C. 2010, ApJL, 709, L138, doi: 10.1088/2041-8205/709/2/L138
-
[28]
K., Walter, F., Sandstrom, K., et al
Leroy, A. K., Walter, F., Sandstrom, K., et al. 2013, AJ, 146, 19, doi: 10.1088/0004-6256/146/2/19
-
[29]
Li, Q., Narayanan, D., & Dav´ e, R. 2019, MNRAS, 490, 1425, doi: 10.1093/mnras/stz2684
-
[30]
Licquia, T. C., & Newman, J. A. 2015, ApJ, 806, 96, doi: 10.1088/0004-637X/806/1/96
-
[31]
2019, ApJ, 877, 4, doi: 10.3847/1538-4357/ab184e
Schaye, J. 2019, ApJ, 877, 4, doi: 10.3847/1538-4357/ab184e
-
[32]
Lopez, S., Tejos, N., Barrientos, L. F., et al. 2020, MNRAS, 491, 4442, doi: 10.1093/mnras/stz3183
-
[33]
2019, MNRAS, 489, 4233, doi: 10.1093/mnras/stz2391
Springel, V. 2019, MNRAS, 489, 4233, doi: 10.1093/mnras/stz2391
-
[34]
McKinnon, R., Torrey, P., Vogelsberger, M., Hayward, C. C., & Marinacci, F. 2017, MNRAS, 468, 1505, doi: 10.1093/mnras/stx467
-
[35]
2018, MNRAS, 478, 2851, doi:10.1093/mnras/sty1248
McKinnon, R., Vogelsberger, M., Torrey, P., Marinacci, F., & Kannan, R. 2018, MNRAS, 478, 2851, doi: 10.1093/mnras/sty1248
-
[36]
McKinnon, R. M. 2019, PhD thesis, Massachusetts Institute of Technology
2019
-
[37]
McQuinn, K. B. W., van Zee, L., & Skillman, E. D. 2019, ApJ, 886, 74, doi: 10.3847/1538-4357/ab4c37
-
[38]
2022, ApJ, 941, 185, doi: 10.3847/1538-4357/ac9d9c
Melso, N., Schiminovich, D., Smiley, B., et al. 2022, ApJ, 941, 185, doi: 10.3847/1538-4357/ac9d9c
-
[39]
Mingozzi, M., Cresci, G., Venturi, G., et al. 2019, A&A, 622, A146, doi: 10.1051/0004-6361/201834372
-
[40]
Mortensen, K., Keerthi Vasan, G. C., Jones, T., et al. 2021, ApJ, 914, 92, doi: 10.3847/1538-4357/abfa11
-
[41]
Putman, M. E. 2017, in Astrophysics and Space Science
2017
-
[42]
430, Gas Accretion onto Galaxies, ed
Library, Vol. 430, Gas Accretion onto Galaxies, ed. A. Fox & R. Dav´ e, 1, doi: 10.1007/978-3-319-52512-91 Reichardt Chu, B., Fisher, D. B., Chisholm, J., et al. 2025, MNRAS, 536, 1799, doi: 10.1093/mnras/stae2705
-
[43]
Rubin, K. H. R., Prochaska, J. X., Koo, D. C., & Phillips, A. C. 2012, ApJL, 747, L26, doi: 10.1088/2041-8205/747/2/L26
-
[44]
The Merger Rates and Mass Assembly Histories of Dark Matter Haloes in the Two
Schiminovich, D., Catinella, B., Kauffmann, G., et al. 2010, MNRAS, 408, 919, doi: 10.1111/j.1365-2966.2010.17210.x
-
[45]
2015, Monthly Notices of the Royal Astronomical Society, 449, 4336, doi: 10.1093/mnras/stv565
Smith, A., Safranek-Shrader, C., Bromm, V., & Milosavljevi´ c, M. 2015, MNRAS, 449, 4336, doi: 10.1093/mnras/stv565
-
[46]
2021, arXiv e-prints, arXiv:2111.13721
Smith, A., Kannan, R., Tacchella, S., et al. 2021, arXiv e-prints, arXiv:2111.13721. https://arxiv.org/abs/2111.13721
-
[47]
Tacconi, L. J., Neri, R., Genzel, R., et al. 2013, ApJ, 768, 74, doi: 10.1088/0004-637X/768/1/74
-
[48]
2021, MNRAS, 507, 663, doi: 10.1093/mnras/stab2147 Tomiˇ ci´ c, N., Kreckel, K., Groves, B., et al
Tejos, N., L´ opez, S., Ledoux, C., et al. 2021, MNRAS, 507, 663, doi: 10.1093/mnras/stab2147 Tomiˇ ci´ c, N., Kreckel, K., Groves, B., et al. 2017, ApJ, 844, 155, doi: 10.3847/1538-4357/aa7b30 17
-
[49]
Vayner, A., Zakamska, N. L., Sabhlok, S., et al. 2023, MNRAS, 519, 961, doi: 10.1093/mnras/stac3537 Villar Mart´ ın, M., Emonts, B., Humphrey, A., Cabrera
-
[50]
2014, MNRAS, 440, 3202, doi: 10.1093/mnras/stu448
Lavers, A., & Binette, L. 2014, MNRAS, 440, 3202, doi: 10.1093/mnras/stu448
-
[51]
Weingartner, J. C., & Draine, B. T. 2001, ApJ, 548, 296, doi: 10.1086/318651
-
[52]
Weldon, A., Reddy, N. A., Topping, M. W., et al. 2023, MNRAS, 523, 5624, doi: 10.1093/mnras/stad1615
-
[53]
Yusef-Zadeh, F., Morris, M., & White, R. L. 1984, ApJ, 278, 186, doi: 10.1086/161780
-
[54]
Zheng, Y., Peek, J. E. G., Werk, J. K., & Putman, M. E. 2017, ApJ, 834, 179, doi: 10.3847/1538-4357/834/2/179
discussion (0)
Sign in with ORCID, Apple, or X to comment. Anyone can read and Pith papers without signing in.