Recognition: no theorem link
Priced risk in corporate bonds
Pith reviewed 2026-05-10 18:48 UTC · model grok-4.3
The pith
Most previously proposed risk factors add no explanatory power for corporate bond returns beyond the overall market factor.
A machine-rendered reading of the paper's core claim, the machinery that carries it, and where it could break.
Core claim
Based on portfolio- and bond-level analyses, previously proposed bond risk factors, with traded liquidity as the only marginal exception, do not have any incremental explanatory power over the corporate bond market factor. Consequently, this implies that the bond CAPM is not dominated by either traded- or nontraded-factor models in pairwise and multiple model comparison tests.
What carries the argument
The corporate bond market factor as baseline, evaluated through incremental explanatory power in cross-sectional asset pricing tests and formal model comparison statistics against multifactor alternatives.
If this is right
- The corporate bond market factor alone accounts for the priced risk that prior multifactor models attempted to capture.
- Liquidity is the only candidate factor with detectable but limited additional role.
- Model comparison tests favor the bond CAPM over the alternatives examined.
- Asset pricing research on corporate bonds should focus on refining the market factor rather than expanding the factor set.
Where Pith is reading between the lines
- Portfolio managers may achieve similar performance with a market-beta approach as with more complex factor tilts.
- Similar patterns could appear in other fixed-income segments if the same testing framework is applied.
- Attention to data quality and sample selection is needed to confirm the absence of incremental power.
- Out-of-sample tests or longer horizons could serve as further checks on the single-factor result.
Load-bearing premise
The portfolio- and bond-level analyses have enough statistical power and correct specification to detect any real incremental explanatory power from the tested factors.
What would settle it
A dataset or subsample in which any previously proposed factor shows statistically significant reduction in pricing errors or increase in explained variation after the market factor is controlled for.
Figures
read the original abstract
Recent studies document strong empirical support for multifactor models that aim to explain the cross-sectional variation in corporate bond expected excess returns. We revisit these findings and provide evidence that common factor pricing in corporate bonds is exceedingly difficult to establish. Based on portfolio- and bond-level analyses, we demonstrate that previously proposed bond risk factors, with traded liquidity as the only marginal exception, do not have any incremental explanatory power over the corporate bond market factor. Consequently, this implies that the bond CAPM is not dominated by either traded- or nontraded-factor models in pairwise and multiple model comparison tests.
Editorial analysis
A structured set of objections, weighed in public.
Referee Report
Summary. The paper claims that common factor pricing in corporate bonds is difficult to establish. Based on portfolio- and bond-level analyses, previously proposed bond risk factors (with traded liquidity as the only marginal exception) lack incremental explanatory power over the corporate bond market factor. This leads to the conclusion that the bond CAPM is not dominated by either traded- or nontraded-factor models in pairwise and multiple model comparison tests.
Significance. If the results are robust, this would imply that corporate bond expected returns are largely captured by a single market factor, challenging the recent literature on multifactor models for bonds and suggesting simpler pricing structures in this asset class. The work provides a direct re-examination of factor dominance via formal model comparisons.
minor comments (3)
- The abstract would benefit from briefly noting the sample period, data sources (e.g., TRACE or other bond databases), and the exact construction of the corporate bond market factor to allow readers to assess generalizability.
- Clarify in the methods section how 'incremental explanatory power' is measured in the multiple model comparison tests (e.g., specific metrics like adjusted R², information criteria, or cross-sectional R²) and whether they account for potential multicollinearity with the market factor.
- Consider adding a table or appendix summarizing the factor definitions and their correlations with the market factor to support the claim of no incremental power.
Simulated Author's Rebuttal
We thank the referee for their review of our manuscript and for providing a concise and accurate summary of our main claims and conclusions. We are encouraged that the potential significance of the findings for the corporate bond pricing literature is acknowledged, conditional on robustness. We respond below to the referee's summary of the paper.
read point-by-point responses
-
Referee: The paper claims that common factor pricing in corporate bonds is difficult to establish. Based on portfolio- and bond-level analyses, previously proposed bond risk factors (with traded liquidity as the only marginal exception) lack incremental explanatory power over the corporate bond market factor. This leads to the conclusion that the bond CAPM is not dominated by either traded- or nontraded-factor models in pairwise and multiple model comparison tests.
Authors: We confirm that this is a faithful summary of the manuscript. Our portfolio-level sorts and cross-sectional regressions at the bond level show that the market factor alone captures most of the variation in expected returns, while the majority of previously proposed factors (term, default, downside risk, etc.) add little or no incremental explanatory power. The traded liquidity factor is the sole exception, displaying marginal significance in some specifications but not dominating the market factor in formal model comparison tests such as the pairwise and multiple model tests we employ. revision: no
Circularity Check
No significant circularity in empirical factor tests
full rationale
The paper reports portfolio- and bond-level regressions testing whether prior bond risk factors add explanatory power beyond the corporate bond market factor. No derivation chain is claimed; results follow from standard cross-sectional and time-series regressions on observed returns and factor realizations. No self-definitional constructs, fitted inputs renamed as out-of-sample predictions, or load-bearing self-citations appear in the abstract or described methodology. The central finding rests on statistical tests against external data rather than internal redefinitions or ansatzes that presuppose the outcome.
Axiom & Free-Parameter Ledger
Reference graph
Works this paper leans on
-
[1]
Journal of Finance 72, 2045–2072
What drives the cross-section of credit spreads?: A variance decomposition approach. Journal of Finance 72, 2045–2072. Pástor, L., Stambaugh, R. F.,
2045
-
[2]
Journal of Political Economy 111, 642–685
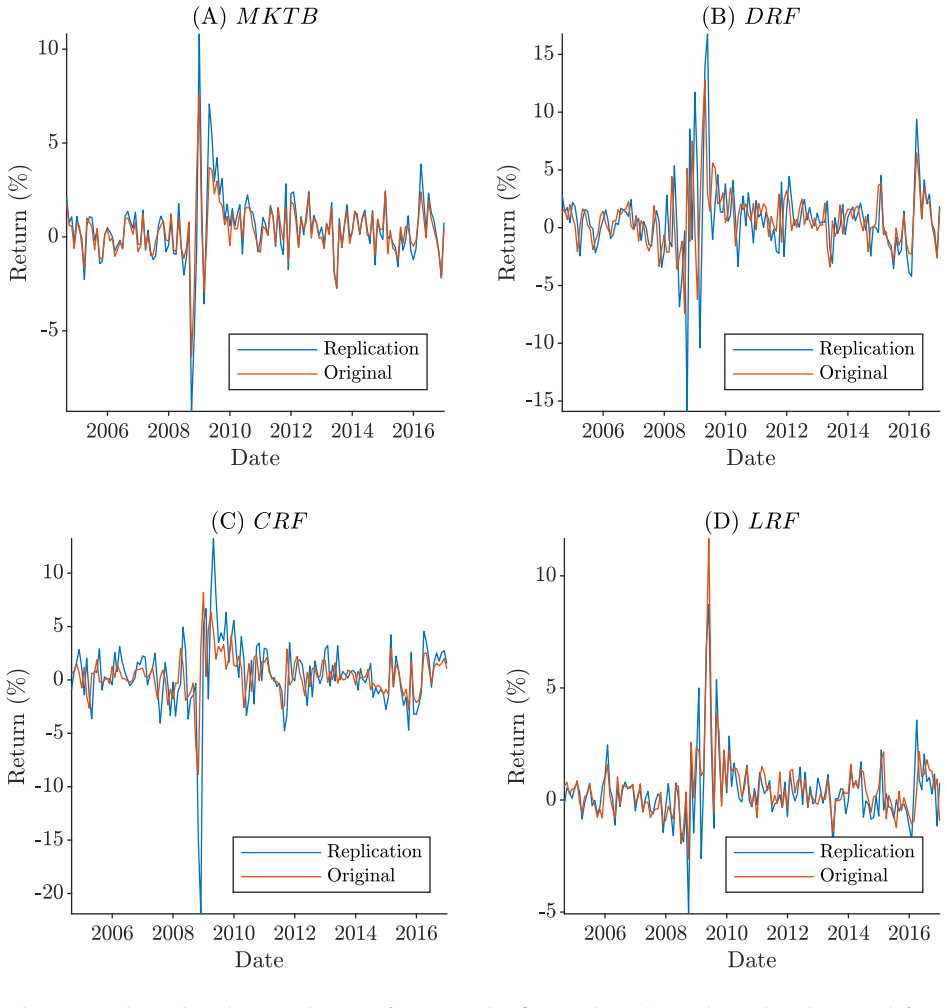
Liquidity risk and expected stock returns. Journal of Political Economy 111, 642–685. 30 Table 1 Bai, Bali, and Wen (2019) four-factor comparison. Panels A and B report factor means (Mean), standard deviations (SD), and percentiles for the original and replicated factors, respectively. The factors include the bond market factor (MKTB), the downside risk f...
2019
-
[3]
andˆλ(with ˆλ0 multiplied by 100), thet-statistics under correctly specified models (t-statc), and the model misspecification-robustt-statistics (t-statm) from Kan, Robotti, and Shanken (2013). In addition, we report the OLS and GLS CSR R2 for each model and the difference between the CSR R2s of the models in rowiand columnj.t-statistics are in round brac...
-
[4]
the EJN sample (1984:03-2019:12) and our set of basis assets (DMR basis assets) vs
for the mimicking portfolios on the conditional long-run consumption factor of Elkamhi, Jo, and Nozawa (2023), based on our sample (2004:08-2016:12) vs. the EJN sample (1984:03-2019:12) and our set of basis assets (DMR basis assets) vs. the EJN set of basis assets (EJN basis assets). We report two types of bootstrapped standard errors computed with 5,000 ...
2023
-
[5]
in Panel B, thet-statistics under correctly specified models (t-statc), and the model misspecification-robustt-statistics (t-statm) from Kan, Robotti, and Shanken (2013). In Panel C, we report the OLS and GLS CSR R2 for each model and the difference between the CSR R2s of the models in rowiand columnj.t-statistics are in round brackets andp-values are in ...
2013
-
[6]
The sample period is 2004:08 to 2016:12 (149 months)
in Panels A and C andˆλin Panels B and D. The sample period is 2004:08 to 2016:12 (149 months). After computing the rolling betas, the sample spans the period 2006:08 to 2016:12 (125 months). The Fama-MacBetht-statistics (t-statF M) with a 12-lag NW adjustment are in round brackets. We denote by Obs. the total number of observations and by Adj. R2the aver...
2004
discussion (0)
Sign in with ORCID, Apple, or X to comment. Anyone can read and Pith papers without signing in.