Recognition: no theorem link
Machine-State Embeddings as an Operational Coordinate System for Accelerator Operation
Pith reviewed 2026-05-10 18:09 UTC · model grok-4.3
The pith
Graph neural network embeddings of CEBAF injector snapshots create a 16-dimensional space where operations cluster into ten stable, persistent neighborhoods rather than a featureless continuum.
A machine-rendered reading of the paper's core claim, the machinery that carries it, and where it could break.
Core claim
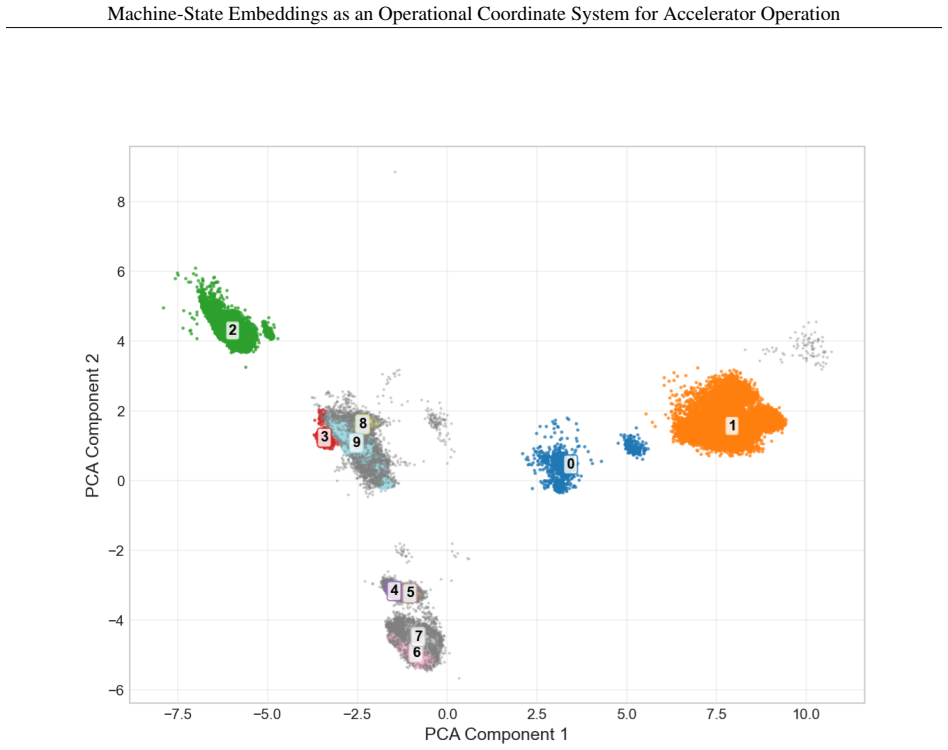
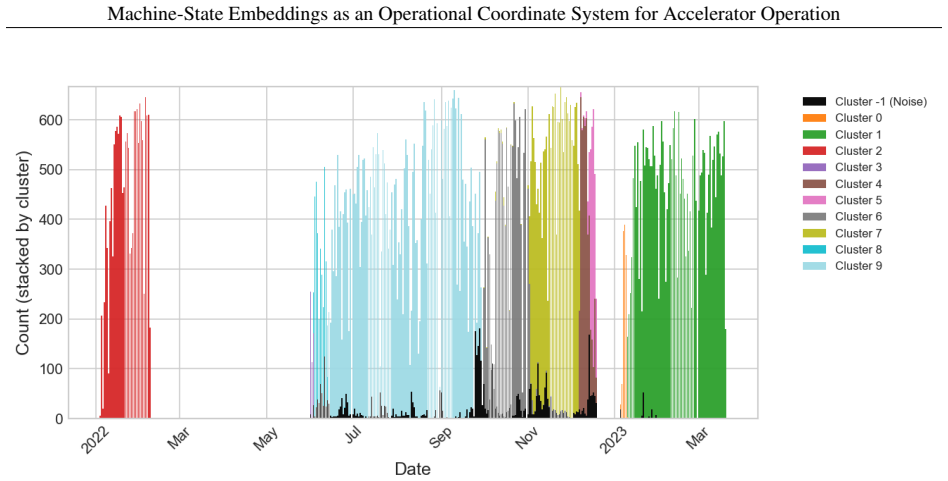
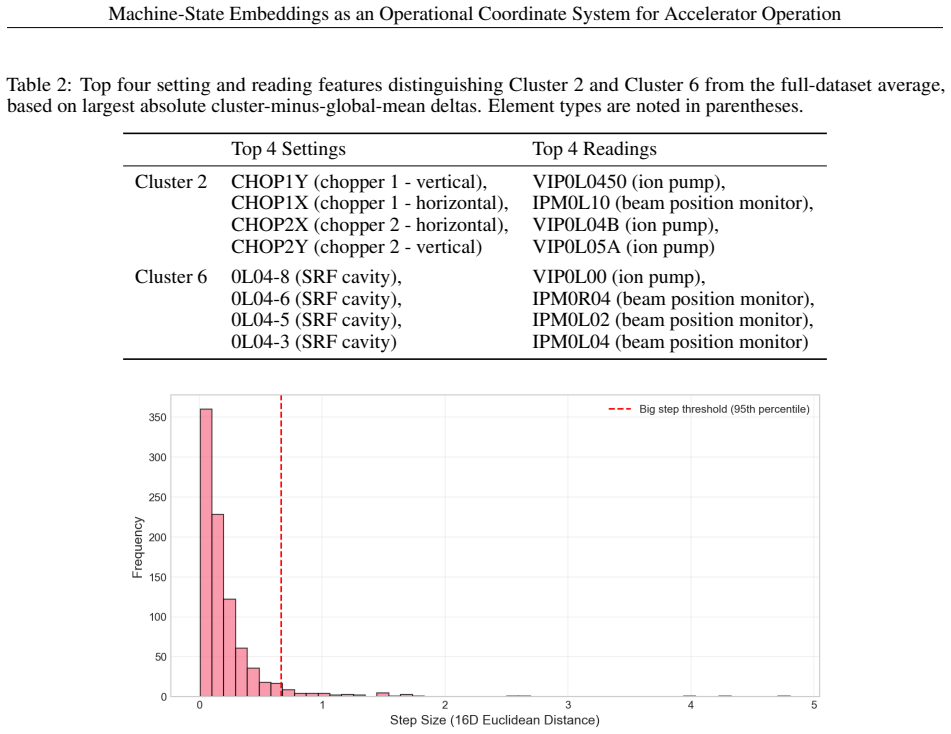
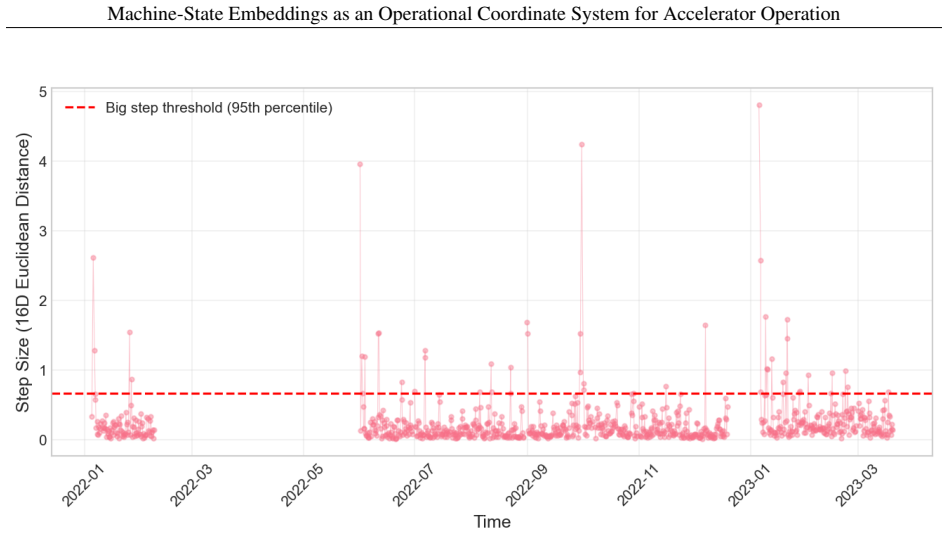
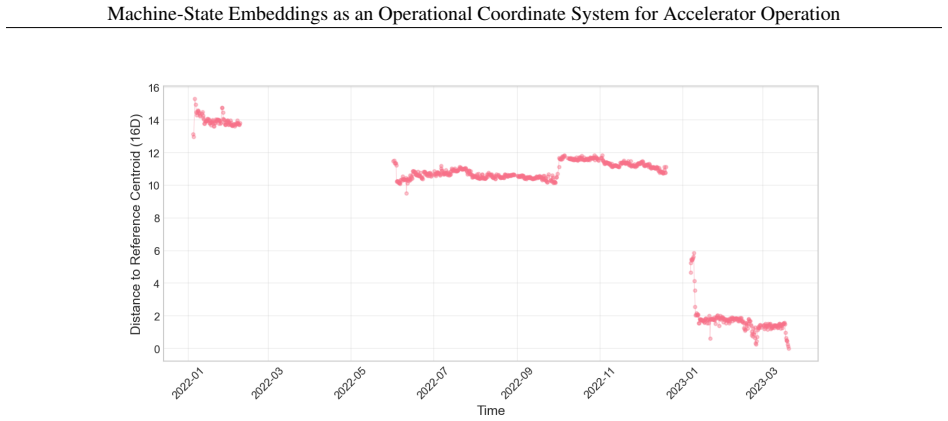
We demonstrate that graph neural network embeddings of injector configurations provide a practical operational coordinate system for the CEBAF injector at Jefferson Lab. Using 137,389 snapshots spanning January 2022 through March 2023, we show that injector operation occupies a small number of persistent, well-separated neighborhoods in a 16-dimensional learned state space rather than a featureless continuum. Density-based clustering identifies ten recurring operating regimes with strong operational run alignment, and regime persistence statistics confirm that these regimes are stable over timescales of hours to weeks. Large relocations between neighborhoods are rare and episodic; 99.6% of 1
What carries the argument
The 16-dimensional GNN embedding space derived from injector configuration snapshots, which functions as an operational coordinate system by exposing clustered neighborhoods that correspond to distinct, stable operating regimes.
If this is right
- Density-based clustering on the embeddings yields ten recurring operating regimes that align strongly with actual run records.
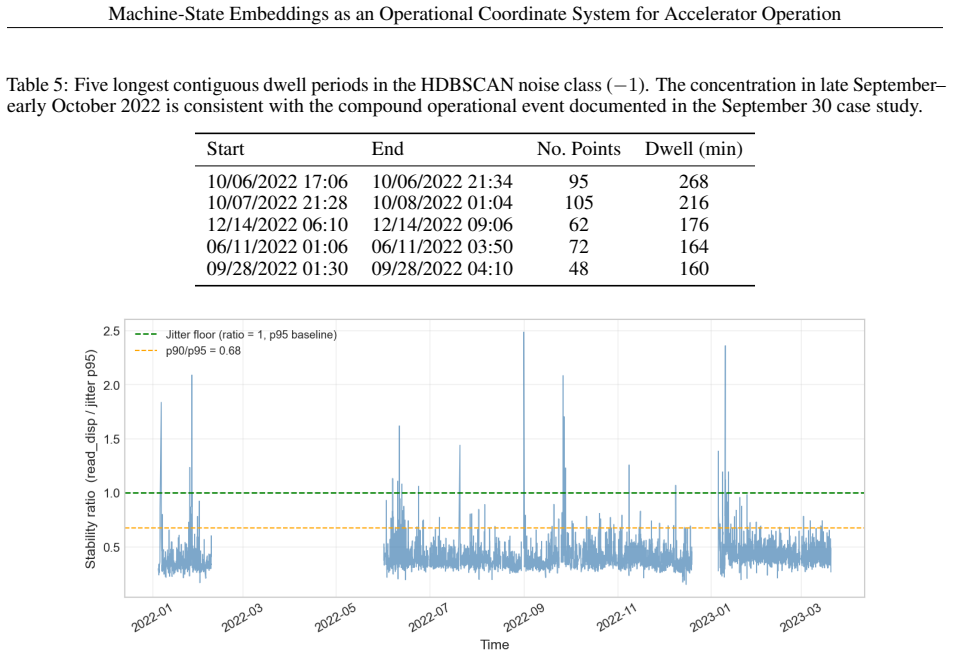
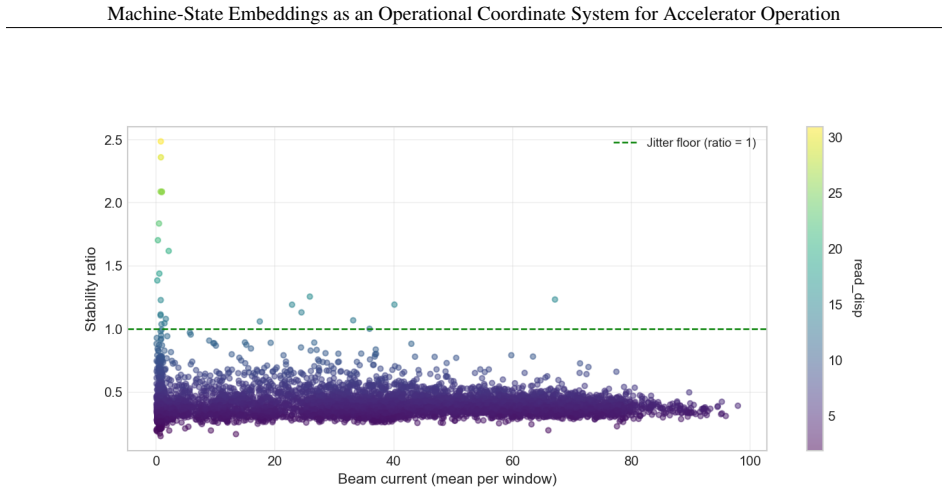
- Regime persistence statistics show that 99.6% of one-hour windows remain inside an empirically derived jitter baseline.
- Geometric outlier screening on the embedding space narrows a year-long archive to a small set of intervals that warrant operational review.
- Nearest-neighbor lookup in embedding space enables case-based reasoning by retrieving similar past configurations from the historical record.
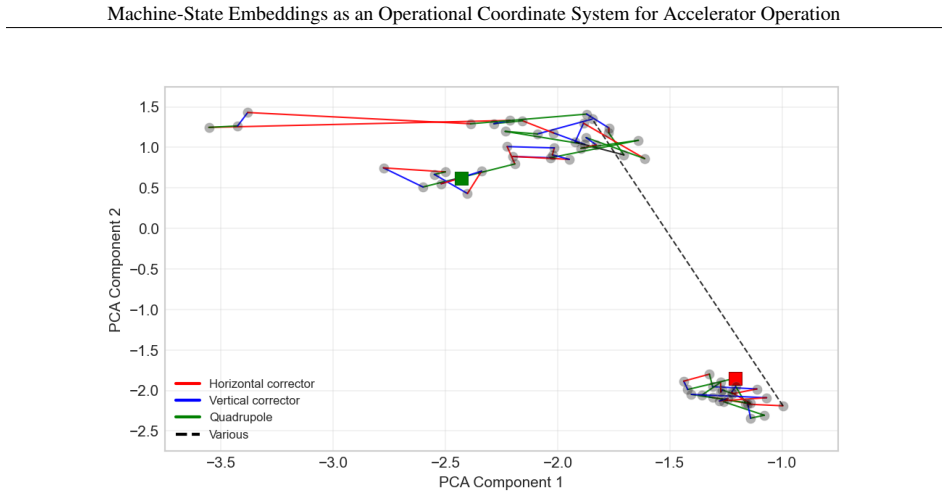
- A controlled beam study confirms that deliberate injector reconfigurations produce coherent, interpretable trajectories through the embedding space.
Where Pith is reading between the lines
- The same embedding technique could be applied to other accelerator sections or entire machines to create unified state maps across subsystems.
- Embedding-space distances might serve as a quantitative metric for how far a current configuration has drifted from established good regimes.
- The approach provides a natural way to test whether new operating procedures stay within previously observed neighborhoods or explore genuinely new states.
- Connecting to high-dimensional sensor anomaly detection in other complex systems such as fusion devices or manufacturing lines.
Load-bearing premise
The GNN embeddings learned from the 137k snapshots capture operationally meaningful and stable states rather than artifacts of data collection, sensor noise, or model training choices.
What would settle it
Embed a fresh collection of injector snapshots with the same trained GNN model and check whether the points form a featureless continuum without ten persistent, run-aligned clusters or whether regime persistence drops below the reported hourly-to-weekly stability.
Figures


read the original abstract
We demonstrate that graph neural network (GNN) embeddings of injector configurations provide a practical operational coordinate system for the Continuous Electron Beam Accelerator Facility (CEBAF) injector at Jefferson Lab. Using 137,389 snapshots spanning January 2022 through March 2023, we show that injector operation occupies a small number of persistent, well-separated neighborhoods in a 16-dimensional learned state space rather than a featureless continuum. Density-based clustering identifies ten recurring operating regimes with strong operational run alignment, and regime persistence statistics confirm that these regimes are stable over timescales of hours to weeks. Large relocations between neighborhoods are rare and episodic; 99.6% of one-hour operating windows fall within an empirically derived jitter baseline. Geometric outlier screening narrows a year-long dataset to a small set of intervals warranting operational review, and nearest-neighbor retrieval enables case-based reasoning over the historical archive. A controlled beam study validates that deliberate injector reconfiguration traces coherent, interpretable trajectories in embedding space. Together these capabilities demonstrate that machine-state embeddings support holistic operational monitoring in ways that single-channel inspection cannot.
Editorial analysis
A structured set of objections, weighed in public.
Referee Report
Summary. The manuscript demonstrates that graph neural network embeddings of CEBAF injector configurations, derived from 137,389 snapshots over 14 months, form a 16-dimensional operational coordinate system. Density-based clustering identifies ten persistent, well-separated regimes with strong run alignment and stability over hours-to-weeks timescales; 99.6% of one-hour windows remain within a jitter baseline, large relocations are rare, and a controlled beam study shows coherent trajectories. The approach enables outlier screening, nearest-neighbor retrieval for case-based reasoning, and holistic monitoring beyond single-channel inspection.
Significance. If the embeddings prove robust to architecture and data choices, the work supplies a practical, data-driven state space for accelerator operation that supports regime identification, persistence tracking, and anomaly flagging at scale. The combination of large historical dataset, controlled validation, and operational utilities (outlier narrowing, case retrieval) distinguishes it from purely descriptive clustering studies and could inform monitoring tools at similar facilities.
major comments (2)
- [Abstract and §4] Abstract and §4 (clustering results): the claim that injector operation occupies 'well-separated neighborhoods rather than a featureless continuum' rests on density-based clustering yielding exactly ten regimes, yet no quantitative validation (silhouette score, Davies-Bouldin index, inter-cluster separation statistics, or stability under bootstrap resampling) is reported. This metric gap is load-bearing because the skeptic concern—that GNN message-passing and 16D embedding choices may induce apparent discreteness—cannot be assessed without these numbers.
- [§5] §5 (controlled beam study): trajectories are described as 'coherent and interpretable,' but the section supplies no error bars, quantitative alignment metrics between observed embedding paths and expected parameter changes, or ablation against noise-augmented or randomized snapshot subsets. Without these, the study does not directly test whether the observed structure survives perturbations that would be expected if the geometry were artifactual.
minor comments (2)
- [Abstract] The abstract states '99.6% of one-hour operating windows fall within an empirically derived jitter baseline' but does not define the baseline computation or the precise windowing procedure; a short methods paragraph or equation would clarify reproducibility.
- [§2] Dataset collection details (operator bias in snapshot timing, sensor calibration drift over the 14-month span) are mentioned only in passing; a dedicated subsection on data provenance would strengthen the claim that the 137k snapshots represent unbiased operational coverage.
Simulated Author's Rebuttal
We thank the referee for the constructive and detailed comments. We agree that the manuscript would be strengthened by the addition of quantitative validation metrics for both the clustering analysis and the controlled beam study. We have revised the manuscript to incorporate these elements and address the concerns directly. Below we respond to each major comment.
read point-by-point responses
-
Referee: [Abstract and §4] Abstract and §4 (clustering results): the claim that injector operation occupies 'well-separated neighborhoods rather than a featureless continuum' rests on density-based clustering yielding exactly ten regimes, yet no quantitative validation (silhouette score, Davies-Bouldin index, inter-cluster separation statistics, or stability under bootstrap resampling) is reported. This metric gap is load-bearing because the skeptic concern—that GNN message-passing and 16D embedding choices may induce apparent discreteness—cannot be assessed without these numbers.
Authors: We agree that the absence of these quantitative metrics leaves the discreteness claim vulnerable to the interpretation that it could be an artifact of the GNN message-passing or the 16-dimensional embedding. In the revised manuscript we have added a new subsection to §4 that reports the silhouette score, Davies-Bouldin index, inter-cluster separation statistics, and results from bootstrap resampling (100 iterations at 80% subsampling). These additions demonstrate that the ten regimes remain stable and well-separated, directly addressing the concern that the observed structure may be induced by modeling choices rather than reflecting genuine operational regimes. revision: yes
-
Referee: [§5] §5 (controlled beam study): trajectories are described as 'coherent and interpretable,' but the section supplies no error bars, quantitative alignment metrics between observed embedding paths and expected parameter changes, or ablation against noise-augmented or randomized snapshot subsets. Without these, the study does not directly test whether the observed structure survives perturbations that would be expected if the geometry were artifactual.
Authors: We acknowledge that §5 would be more convincing with error bars, quantitative alignment metrics, and ablation studies to test robustness against perturbations. The revised §5 now includes error bars on the trajectory plots (derived from repeated controlled runs), a quantitative alignment metric correlating embedding displacements with the magnitude of deliberate parameter changes, and an ablation comparing the observed trajectories against noise-augmented and fully randomized snapshot subsets. The results show that coherent trajectories persist under realistic noise but degrade under randomization, providing direct evidence that the geometry is not artifactual. revision: yes
Circularity Check
No circularity: empirical discovery of neighborhoods in learned embedding space
full rationale
The paper trains a GNN on 137k historical snapshots to produce 16-dimensional embeddings, then applies density-based clustering and persistence statistics to identify ten operating regimes. All central claims (neighborhood separation, run alignment, 99.6% jitter compliance, trajectory coherence in the controlled study) are direct empirical observations on the output of this pipeline rather than quantities defined in terms of themselves or fitted parameters renamed as predictions. No self-citation chains, ansatzes, or uniqueness theorems are invoked to justify the existence or stability of the regimes; the geometry is measured from the data. The derivation chain therefore remains non-circular and externally falsifiable against the raw snapshot archive.
Axiom & Free-Parameter Ledger
free parameters (1)
- GNN hyperparameters and embedding dimension
axioms (1)
- domain assumption The collected snapshots are representative of normal and recurring injector operation
Reference graph
Works this paper leans on
-
[1]
doi:10.1109/MIM.2021.9620023. M. M. Breunig, H.-P. Kriegel, R. T. Ng, and J. Sander. LOF: Identifying density-based local outliers. InProc. ACM SIGMOD Int. Conf. on Management of Data, volume 29, pages 93–104,
-
[2]
doi:10.1145/335191.335388. R. J. Campello, D. Moulavi, A. Zimek, and J. Sander. Hierarchical density estimates for data clustering, visualization, and outlier detection.ACM Transactions on Knowledge Discovery from Data (TKDD), 10(1):1–51,
-
[3]
doi:10.1007/978-3-642-37456-2_14. 16 Machine-State Embeddings as an Operational Coordinate System for Accelerator Operation T. Chen, S. Kornblith, M. Norouzi, and G. Hinton. A simple framework for contrastive learning of visual representations. InProc. 37th Int. Conf. on Machine Learning (ICML), pages 1597–1607,
-
[4]
doi:10.1146/annurev-nucl-121423-100719
ISSN 1545-4134. doi:10.1146/annurev-nucl-121423-100719. URL http://dx.doi.org/10.1146/ annurev-nucl-121423-100719. E. Fol, R. Tomás, J. Coello de Portugal, and G. Franchetti. Detection of faulty beam position monitors using unsupervised learning.Phys. Rev. Accel. Beams, 23:102805,
-
[5]
doi:10.1103/PhysRevAccelBeams.23.102805. Y . Gorishniy, I. Rubachev, V . Khrulkov, and A. Babenko. Revisiting deep learning models for tabular data. InAdvances in Neural Information Processing Systems (NeurIPS), volume 34, pages 18932–18943,
-
[6]
doi:10.1109/TBDATA.2019.2921572. I. T. Jolliffe.Principal Component Analysis. Springer, New York, NY , USA, 2nd edition,
-
[7]
doi:10.1016/j.conengprac.2019.104189
ISSN 0967-0661. doi:10.1016/j.conengprac.2019.104189. URLhttps://www.sciencedirect.com/science/article/pii/S0967066119301728. D. P. Kingma and M. Welling. Auto-Encoding variational Bayes. InProc. 2nd Int. Conf. on Learning Representations (ICLR),
-
[8]
doi:10.1109/ICDM.2008.17. L. McInnes, J. Healy, N. Saul, and L. Großberger. UMAP: Uniform manifold approximation and projection for dimension reduction.J. Open Source Softw., 3(29):861,
-
[9]
doi:10.21105/joss.00861. S. Ramaswamy, R. Rastogi, and K. Shim. Efficient algorithms for mining outliers from large data sets. InProc. ACM SIGMOD Int. Conf. on Management of Data, volume 29, pages 427–438,
-
[10]
doi:10.1145/335191.335437. L. van der Maaten and G. Hinton. Visualizing data using t-SNE.J. Mach. Learn. Res., 9(86):2579–2605,
-
[11]
doi:10.3389/fdata.2024.1366469. P. Wójcik and T. Barszcz. Condition monitoring using a latent space of variational autoencoder trained on healthy data. Sensors, 24(21):6670,
-
[12]
doi:10.3390/s24216825. Y . You, T. Chen, Y . Sui, T. Chen, Z. Wang, and Y . Shen. Graph contrastive learning with augmentations. InAdvances in Neural Information Processing Systems (NeurIPS), volume 33, pages 5812–5823,
-
[13]
12 Supplementary Methods: Logbook Analysis Workflow For the September 30, 2022 case study, logbook entries were analyzed to connect a large embedding-space relocation event to operator-recorded machine context. The goal of this workflow was not to automate root-cause attribution, but to assemble a chronologically ordered, human-authored narrative record t...
2022
discussion (0)
Sign in with ORCID, Apple, or X to comment. Anyone can read and Pith papers without signing in.