Recognition: unknown
A PMP-inspired Evaluation Framework for Assessing Deep-Learning Earth System Models
Pith reviewed 2026-05-10 17:36 UTC · model grok-4.3
The pith
Deep-learning Earth system models can be evaluated using traditional PMP diagnostics, producing encouraging matches to observations.
A machine-rendered reading of the paper's core claim, the machinery that carries it, and where it could break.
Core claim
Treating DL-ESMs as traditional models and running them through PMP standardized diagnostics shows that models such as Ai2's ACE2 and Google's NeuralGCM can simulate climatology and key modes of variability against observational references, thereby extending their tested range and supporting greater confidence in their potential to accelerate Earth system modeling.
What carries the argument
The PMP-inspired evaluation framework that applies multiple standardized diagnostics from the PCMDI Metrics Package to check climatology and variability performance in DL-ESMs.
If this is right
- DL-ESMs become testable within existing standardized pipelines without new custom diagnostics.
- Results can guide future development of deep-learning models for Earth system science.
- Scientific applications gain a clearer basis for deciding when a DL-ESM is fit for purpose.
- Community confidence in DL-ESMs grows through direct comparison with established models.
Where Pith is reading between the lines
- This approach could let developers test new DL-ESMs quickly using tools already in wide use.
- The framework might highlight particular strengths or gaps in how DL-ESMs capture variability compared with physics-based models.
- Hybrid systems that combine traditional and deep-learning components could be evaluated under the same metrics.
Load-bearing premise
That the PMP diagnostics created for traditional ESMs are appropriate and sufficient to assess the performance and trustworthiness of deep-learning Earth system models.
What would settle it
A finding that DL-ESMs systematically fail multiple PMP variability metrics on which traditional models perform well would show the framework does not establish comparable trustworthiness.
Figures


read the original abstract
In recent years, Deep-Learning Earth System Models (DL-ESMs) have emerged as promising and computationally efficient alternatives to traditional ESMs. Here, we present an evaluation framework for testing DL-ESMs from a traditional model development perspective, utilizing the PCMDI Metrics Package (PMP) standardized diagnostics. This methodology allows DL-ESMs, such as Ai2's ACE2 and Google's NeuralGCM, to be rigorously tested via multiple metrics to access their ability to simulate climatology and key modes of variability in observational reference datasets. By evaluating DL-ESMs as traditional models, we extend their application into uncharted territory and find encouraging results. This evaluation represents a critical step toward establishing trust in DL-ESMs within the scientific community, thus enhancing confidence in their potential to accelerate Earth System modeling, and guiding future model development. Our analysis sheds light on the fit-for-purpose of DL-ESMs offering insights for a wide range of Earth System science applications.
Editorial analysis
A structured set of objections, weighed in public.
Referee Report
Summary. The manuscript proposes a PMP-inspired evaluation framework for Deep-Learning Earth System Models (DL-ESMs) such as ACE2 and NeuralGCM. It applies the PCMDI Metrics Package standardized diagnostics to assess climatology and key modes of variability against observational reference datasets, reports encouraging results, and positions the work as a critical step toward establishing trust in DL-ESMs for Earth system applications.
Significance. If the quantitative results hold, the framework would provide a reproducible bridge between DL-ESMs and the traditional ESM evaluation ecosystem by leveraging existing PMP tools, enabling direct comparability and guiding model development. The emphasis on standardized, observation-based diagnostics is a strength for community adoption.
major comments (2)
- [Abstract] Abstract: the claim of 'encouraging results' and 'critical step toward establishing trust' lacks any specific metrics, error bars, tables, or quantitative comparisons, leaving the central claim without visible support and preventing assessment of whether the framework actually demonstrates fitness for purpose.
- [Abstract] Abstract and introduction: the evaluation assumes PMP climatology/variability diagnostics (developed for physics-constrained ESMs) are sufficient to build trust in DL-ESMs, but does not address or test whether they detect non-physical artifacts, conservation violations, or spurious sources/sinks that can occur in learned models even when mean-state scores appear good; this assumption is load-bearing for the trustworthiness claim.
minor comments (1)
- [Abstract] Abstract: 'to access their ability' appears to be a typo for 'to assess their ability'.
Simulated Author's Rebuttal
We thank the referee for the constructive and insightful comments. We address each major comment point by point below and indicate the revisions we will make to the manuscript.
read point-by-point responses
-
Referee: [Abstract] Abstract: the claim of 'encouraging results' and 'critical step toward establishing trust' lacks any specific metrics, error bars, tables, or quantitative comparisons, leaving the central claim without visible support and preventing assessment of whether the framework actually demonstrates fitness for purpose.
Authors: We agree that the abstract would benefit from including specific quantitative support for the claims. In the revised manuscript, we will update the abstract to highlight key results from the evaluations, including specific metrics such as RMSE values for climatological fields and pattern correlations for modes of variability (e.g., ENSO, MJO) when comparing ACE2 and NeuralGCM to observations. This will make the central claims more concrete and allow readers to assess fitness for purpose directly from the abstract. revision: yes
-
Referee: [Abstract] Abstract and introduction: the evaluation assumes PMP climatology/variability diagnostics (developed for physics-constrained ESMs) are sufficient to build trust in DL-ESMs, but does not address or test whether they detect non-physical artifacts, conservation violations, or spurious sources/sinks that can occur in learned models even when mean-state scores appear good; this assumption is load-bearing for the trustworthiness claim.
Authors: This is a substantive and valid concern. The manuscript applies PMP diagnostics to enable standardized, reproducible comparison of DL-ESMs with traditional ESMs using the existing evaluation ecosystem, but it does not test or claim that these diagnostics can identify DL-specific issues such as conservation violations or spurious sources/sinks. We will revise the abstract and introduction to clarify the scope of the work, temper the language regarding 'establishing trust,' and add an explicit discussion of limitations, noting that complementary physics-based checks would be required for more comprehensive validation of DL-ESMs. This addresses the load-bearing assumption without overclaiming the current framework's capabilities. revision: partial
Circularity Check
No circularity: framework applies independent external PMP diagnostics to DL-ESMs
full rationale
The paper presents an evaluation methodology that directly applies the pre-existing PCMDI Metrics Package (PMP) standardized diagnostics to assess DL-ESMs (ACE2, NeuralGCM) against observational references for climatology and modes of variability. No derivation chain, equations, fitted parameters, or self-referential definitions are present. The claim of a 'critical step toward establishing trust' is an interpretive conclusion drawn from the application of these external metrics, not a result that reduces to the paper's own inputs by construction. No self-citation load-bearing steps, ansatz smuggling, or renaming of known results occur. The approach is self-contained against external benchmarks.
Axiom & Free-Parameter Ledger
Reference graph
Works this paper leans on
-
[1]
Adler, R. F., Sapiano, M. R., Huffman, G. J., Wang, J. J., Gu, G., Bolvin, D., Chiu, L., Schneider, U., Becker, A., Nelkin, E., Xie, P., Ferraro, R., and Shin, D.-B.: The Global Precipitation Climatology Project (GPCP) monthly analysis (new version 2.3) and a review of 2017 global precipitation, Atmosphere, 9, 138, https://doi.org/10.3390/atmos9040138,
-
[2]
Ahn, M.-S., Kim, D. H., Sperber, K. R., Kang, I.-S., Maloney, E. D., Waliser, D. E., and Hendon, H. H.: MJO simulation in CMIP5 climate models: MJO skill metrics and process-oriented diagnosis, Climate Dynamics, 49, 4023–4045, https://doi.org/10.1007/s00382-017-3558- 4,
-
[3]
Ahn, M.-S., Gleckler, P. J., Lee, J., Pendergrass, A. G., and Jakob, C.: Benchmarking Simulated Precipitation Variability Amplitude across Time Scales, Journal of Climate, 35, 3173–3196, https://doi.org/10.1175/JCLI-D-21-0542.1,
-
[4]
Ai2: ACE2-ERA5 (Revision a4ca6cc), https://doi.org/10.57967/hf/5377,
-
[5]
Back, S.-Y ., Kim, D., and Son, S.-W.: MJO Diversity in CMIP6 Models, Journal of Climate, 37, 4835 – 4850, https://doi.org/10.1175/JCLI- D-23-0656.1,
-
[6]
A., Hassanzadeh, P., Rucker, K., and Shaw, T
Baxter, I., Pahlavan, H. A., Hassanzadeh, P., Rucker, K., and Shaw, T. A.: Benchmarking Atmospheric Circulation Vari- ability in an AI Emulator, ACE2, and a Hybrid Model, NeuralGCM, Geophysical Research Letters, 53, e2025GL119 877, https://doi.org/https://doi.org/10.1029/2025GL119877, e2025GL119877 2025GL119877,
-
[7]
Bi, K., Xie, L., Zhang, H., Chen, X., Gu, X., and Tian, Q.: Accurate medium-range global weather forecasting with 3D neural networks, Nature, 619, 533–538, https://doi.org/10.1038/s41586-023-06185-3,
-
[8]
Bodnar, C., Bruinsma, W. P., Lucic, A., Stanley, M., Allen, A., Brandstetter, J., Garvan, P., Riechert, M., Weyn, J. A., Dong, H., Gupta, J. K., Thambiratnam, K., Archibald, A. T., Wu, C.-C., Heider, E., Welling, M., Turner, R. E., and Perdikaris, P.: A foundation model for the Earth system, Nature, 641, 1180–1187, https://doi.org/10.1038/s41586-025-09005-y,
-
[9]
Brenowitz, N. D., Ge, T., Subramaniam, A., Manshausen, P., Gupta, A., Hall, D. M., Mardani, M., Vahdat, A., Kashinath, K., and Pritchard, M. S.: Climate in a Bottle: Towards a Generative Foundation Model for the Kilometer-Scale Global Atmosphere, arXiv preprint, https: //arxiv.org/abs/2505.06474,
-
[10]
Bretherton, C., Watt-Meyer, O., Henn, B., and Koldunov, N.: AIMIP Phase 1 Specification, https://github.com/ai2cm/AIMIP, version 1.2.3, accessed 19 February 2026,
2026
-
[11]
D., Popescu, O.-I., Pellicer- Valero, O
Camps-Valls, G., Fernández-Torres, M.-Á., Cohrs, K.-H., Höhl, A., Castelletti, A., Pacal, A., Robin, C., Martinuzzi, F., Papoutsis, I., Prapas, I., Pérez-Aracil, J., Weigel, K., Gonzalez-Calabuig, M., Reichstein, M., Rabel, M., Giuliani, M., Mahecha, M. D., Popescu, O.-I., Pellicer- Valero, O. J., Ouala, S., Salcedo-Sanz, S., Sippel, S., Kondylatos, S., H...
-
[12]
Chien, M.-T., Barnes, E. A., and Maloney, E. D.: Modulation of tropical cyclogenesis on subseasonal-to-interannual timescales in the deep- learning climate emulator ACE2, Machine Learning: Earth, 1, 015 008, https://doi.org/10.1088/3049-4753/adfd61,
-
[13]
K., Watt-Meyer, O., Kwa, A., McGibbon, J., Henn, B., Perkins, W
Clark, S. K., Watt-Meyer, O., Kwa, A., McGibbon, J., Henn, B., Perkins, W. A., Wu, E., Harris, L. M., and Bretherton, C. S.: ACE2- SOM: Coupling an ML Atmospheric Emulator to a Slab Ocean and Learning the Sensitivity of Climate to Changed CO2, Journal of Geophysical Research: Machine Learning and Computation, 2, e2024JH000 575, https://doi.org/https://doi...
-
[14]
26 Coats, S., Smerdon, J. E., Stevenson, S., Fasullo, J. T., Otto-Bliesner, B., and Ault, T. R.: Paleoclimate Constraints on the Spatiotemporal Character of Past and Future Droughts, Journal of Climate, 33, 9883 – 9903, https://doi.org/10.1175/JCLI-D-20-0004.1,
-
[15]
AGU Advances 6(4), 2025–001706 (2025) https://doi.org/10.1029/2025A V001706
Cresswell-Clay, N., Liu, B., Durran, D. R., Liu, Z., Espinosa, Z. I., Moreno, R. A., and Karlbauer, M.: A Deep Learning Earth System Model for Efficient Simulation of the Observed Climate, AGU Advances, 6, e2025A V001 706, https://doi.org/https://doi.org/10.1029/2025A V001706, e2025A V001706 2025A V001706,
-
[16]
J.: PCMDI/cmor: CMOR version 3.2.2, https://cmor.llnl.gov/, software release, March 2017,
Doutriaux, C., Nadeau, D., Bradshaw, T., Kettleborough, J., Weigel, T., Hogan, E., and Durack, P. J.: PCMDI/cmor: CMOR version 3.2.2, https://cmor.llnl.gov/, software release, March 2017,
2017
-
[17]
Duan, S., Zhang, J., Bonfils, C., and Pallotta, G.: Testing NeuralGCM’s capability to simulate future heatwaves based on the 2021 Pacific Northwest heatwave event, npj Climate and Atmospheric Science, 8, 251, https://doi.org/10.1038/s41612-025-01137-2,
-
[18]
Eyring, V ., Collins, W. D., Gentine, P., Barnes, E. A., Barreiro, M., Beucler, T., Bocquet, M., Bretherton, C. S., Christensen, H. M., Dagon, K., Gagne, D. J., Hall, D., Hammerling, D., Hoyer, S., Iglesias-Suarez, F., Lopez-Gomez, I., McGraw, M. C., Meehl, G. A., Molina, M. J., Monteleoni, C., Mueller, J., Pritchard, M. S., Rolnick, D., Runge, J., Stier,...
-
[19]
Gleckler, P. J., Taylor, K. E., and Doutriaux, C.: Performance metrics for climate models, Journal of Geophysical Research: Atmospheres, 113, https://doi.org/10.1029/2007JD008972,
-
[20]
Hersbach, H., Bell, B., Berrisford, P., Hirahara, S., Horányi, A., Muñoz-Sabater, J., Nicolas, J., Peubey, C., Radu, R., Schepers, D., Sim- mons, A., Soci, C., Abdalla, S., Abellan, X., Balsamo, G., Bechtold, P., Biavati, G., Bidlot, J., Bonavita, M., De Chiara, G., Dahlgren, P., Dee, D., Diamantakis, M., Dragani, R., Flemming, J., Forbes, R., Fuentes, M....
-
[21]
Jiang, X., Maloney, E., and Su, H.: Large-scale controls of propagation of the Madden-Julian Oscillation, npj Climate and Atmospheric Science, 3, 29, https://doi.org/10.1038/s41612-020-00134-x,
-
[22]
Kageyama, M., Braconnot, P., Chiessi, C. M., Rehfeld, K., Ait Brahim, Y ., Dütsch, M., Gwinneth, B., Hou, A., Loutre, M.-F., Hen- drizan, M., Meissner, K., Mongwe, P., Otto-Bliesner, B., Pezzi, L. P., Rovere, A., Seltzer, A., Sime, L., and Zhu, J.: Lessons from paleoclimates for recent and future climate change: opportunities and insights, Frontiers in Cl...
-
[23]
27 Kent, C., Scaife, A. A., Dunstone, N. J., Smith, D., Hardiman, S. C., Dunstan, T., and Watt-Meyer, O.: Skilful global seasonal predictions from a machine learning weather model trained on reanalysis data, npj Climate and Atmospheric Science, 8, 314, https://doi.org/10.1038/s41612-025-01198-3,
-
[24]
Kochkov, D., Yuval, J., Langmore, I., Norgaard, P., Smith, J., Mooers, G., Klöwer, M., Lottes, J., Rasp, S., Düben, P., Hatfield, S., Battaglia, P., Sanchez-Gonzalez, A., Willson, M., Brenner, M. P., and Hoyer, S.: Neural general circulation models for weather and climate, Nature, 632, 1060–1066, https://doi.org/10.1038/s41586-024-07744-y,
-
[25]
Lam, R., Sanchez-Gonzalez, A., Willson, M., Wirnsberger, P., Fortunato, M., Alet, F., Ravuri, S., Ewalds, T., Eaton-Rosen, Z., Hu, W., Merose, A., Hoyer, S., Holland, G., Vinyals, O., Stott, J., Pritzel, A., Mohamed, S., and Battaglia, P.: GraphCast: Learning skillful medium- range global weather forecasting, https://arxiv.org/abs/2212.12794,
-
[26]
Lee, J., Sperber, K. R., Gleckler, P. J., Bonfils, C., and Taylor, K. E.: Quantifying the agreement between observed and simulated extratropical modes of interannual variability, Climate Dynamics, 52, 4057–4089, https://doi.org/10.1007/s00382-018-4355-4,
-
[27]
J., Ahn, M.-S., Ordonez, A., Ullrich, P
Lee, J., Gleckler, P. J., Ahn, M.-S., Ordonez, A., Ullrich, P. A., Sperber, K. R., Taylor, K. E., Planton, Y . Y ., Guilyardi, E., Durack, P., Bonfils, C., Zelinka, M. D., Chao, L.-W., Dong, B., Doutriaux, C., Zhang, C., V o, T., Boutte, J., Wehner, M. F., Pendergrass, A. G., Kim, D., Xue, Z., Wittenberg, A. T., and Krasting, J.: Systematic and objective ...
-
[28]
Meng, Z., Hakim, G. J., Yang, W., and Vecchi, G. A.: Deep Learning Atmospheric Models Reliably Simulate Out-of-Sample Land Heat and Cold Wave Frequencies, Geophysical Research Letters, 53, e2025GL117 990, https://doi.org/https://doi.org/10.1029/2025GL117990, e2025GL117990 2025GL117990,
-
[29]
Nikumbh, A. C., Lin, P., Paynter, D., and Ming, Y .: Does Increasing Horizontal Resolution Improve the Simulation of Intense Tropical Rain- fall in GFDL’s AM4 Model?, Geophysical Research Letters, 51, e2023GL106 708, https://doi.org/https://doi.org/10.1029/2023GL106708, e2023GL106708 2023GL106708,
-
[30]
Pathak, J., Subramanian, S., Harrington, P., Raja, S., Chattopadhyay, A., Mardani, M., Kurth, T., Hall, D., Li, Z., Azizzadenesheli, K., Hassanzadeh, P., Kashinath, K., and Anandkumar, A.: FourCastNet: A Global Data-driven High-resolution Weather Model using Adaptive Fourier Neural Operators, https://arxiv.org/abs/2202.11214,
work page internal anchor Pith review arXiv
-
[31]
Peings, Y ., Dong, C., Mahesh, A., Pritchard, M., Collins, W., and Magnusdottir, G.: Subseasonal Forecasting and MJO Telecon- nections in Machine Learning Weather Prediction Models, Journal of Geophysical Research: Atmospheres, 131, e2025JD044 910, https://doi.org/https://doi.org/10.1029/2025JD044910, e2025JD044910 2025JD044910,
-
[32]
Pithan, F., Athanase, M., Dahlke, S., Sánchez-Benítez, A., Shupe, M. D., Sledd, A., Streffing, J., Svensson, G., and Jung, T.: Nudging allows direct evaluation of coupled climate models with in situ observations: a case study from the MOSAiC expedition, Geoscientific Model Development, 16, 1857–1873, https://doi.org/10.5194/gmd-16-1857-2023,
-
[33]
Price, I., Sanchez-Gonzalez, A., Alet, F., Andersson, T. R., El-Kadi, A., Masters, D., Ewalds, T., Stott, J., Mohamed, S., Battaglia, P., Lam, R., and Willson, M.: Probabilistic weather forecasting with machine learning, Nature, 637, 84–90, https://doi.org/10.1038/s41586-024- 08252-9,
-
[34]
Rasp, S., Hoyer, S., Merose, A., Langmore, I., Battaglia, P., Russell, T., Sanchez-Gonzalez, A., Yang, V ., Carver, R., Agrawal, S., Chantry, M., Ben Bouallegue, Z., Dueben, P., Bromberg, C., Sisk, J., Barrington, L., Bell, A., and Sha, F.: WeatherBench 2: A Benchmark for the Next Generation of Data-Driven Global Weather Models, Journal of Advances in Mod...
-
[35]
28 Rucker, K., Baxter, I., Hassanzadeh, P., Shaw, T. A., and Pahlavan, H. A.: Benchmarking Regional Thermodynamic Trends in an AI emulator, ACE2, and a hybrid model, NeuralGCM, https://arxiv.org/abs/2511.00274,
-
[36]
G., Boyd, E., Calel, R., Chapman, S
Shepherd, T. G., Boyd, E., Calel, R., Chapman, S. C., Dessai, S., Dima-West, I., Fowler, H. J., James, R., Maraun, D., Martius, O., Senior, C. A., Sobel, A. H., and Stainforth, D. A.: Storylines: an alternative approach to representing uncertainty in physical aspects of climate change, Climatic Change, 151, 555–571, https://link.springer.com/article/10.10...
- [37]
-
[38]
Sperber, K. R.: Madden–Julian variability in NCAR CAM2.0 and CCSM2.0, Climate Dynamics, 23, 259–278, https://doi.org/10.1007/s00382-004-0447-4,
-
[39]
Stephens, G. L., L’Ecuyer, T., Forbes, R., Gettlemen, A., Golaz, J.-C., Bodas-Salcedo, A., Suzuki, K., Gabriel, P., and Haynes, J.: The dreary state of precipitation in global models, Journal of Geophysical Research: Atmospheres, 115, https://doi.org/10.1029/2010JD014532,
-
[40]
Taylor, K. E.: Summarizing multiple aspects of model performance in a single diagram, Journal of Geophysical Research, 106, 7183–7192, https://doi.org/10.1029/2000JD900719,
-
[41]
Ullrich, P. A., Barnes, E. A., Collins, W. D., Dagon, K., Duan, S., Elms, J., Lee, J., Leung, L. R., Lu, D., Molina, M. J., O’Brien, T. A., and Rebassoo, F. O.: Recommendations for Comprehensive and Independent Evaluation of Machine Learning-Based Earth System Mod- els, Journal of Geophysical Research: Machine Learning and Computation, 2, e2024JH000 496, ...
-
[42]
Waliser, D., Gleckler, P. J., Ferraro, R., Taylor, K. E., Ames, S., Biard, J., Bosilovich, M. G., Brown, O., Chepfer, H., Cinquini, L., Durack, P. J., Eyring, V ., Mathieu, P.-P., Lee, T., Pinnock, S., Potter, G. L., Rixen, M., Saunders, R., Schulz, J., Thépaut, J.-N., and Tuma, M.: Observations for Model Intercomparison Project (Obs4MIPs): status for CMI...
-
[43]
Wang, B., Kim, H.-J., Kikuchi, K., and Kitoh, A.: Diagnostic metrics for evaluation of annual and diurnal cycles, Climate Dynamics, 37, 941–955, https://doi.org/10.1007/s00382-010-0877-0,
-
[44]
Watson-Parris, D., Rao, Y ., Olivié, D., Seland, Ø., Nowack, P., Camps-Valls, G., Stier, P., Bouabid, S., Dewey, M., Fons, E., Gonzalez, J., Harder, P., Jeggle, K., Lenhardt, J., Manshausen, P., Novitasari, M., Ricard, L., and Roesch, C.: ClimateBench v1.0: A Benchmark for Data-Driven Climate Projections, Journal of Advances in Modeling Earth Systems, 14,...
-
[45]
ACE: A fast, skillful learned global atmospheric model for climate prediction
Watt-Meyer, O., Dresdner, G., McGibbon, J., Clark, S. K., Henn, B., Duncan, J., Brenowitz, N. D., Kashinath, K., Pritchard, M. S., Bonev, B., Peters, M. E., and Bretherton, C. S.: ACE: A fast, skillful learned global atmospheric model for climate prediction, https://arxiv.org/ abs/2310.02074,
-
[46]
Xiang, B., Zhao, M., Held, I. M., and Golaz, J.-C.: Predicting the severity of spurious “double ITCZ” problem in CMIP5 coupled models from AMIP simulations, Geophysical Research Letters, 44, 1520–1527, https://doi.org/https://doi.org/10.1002/2016GL071992,
-
[47]
H., Yarosh, Y ., Sun, F., and Lin, R.: Reprocessed, bias-corrected CMORPH global high-resolution precip- itation estimates from 1998, Journal of Hydrometeorology, 18, 1617–1641,
29 Xie, P., Joyce, R., Wu, S., Yoo, S. H., Yarosh, Y ., Sun, F., and Lin, R.: Reprocessed, bias-corrected CMORPH global high-resolution precip- itation estimates from 1998, Journal of Hydrometeorology, 18, 1617–1641,
1998
-
[48]
Yuval, J., Langmore, I., Kochkov, D., and Hoyer, S.: Neural general circulation models for modeling precipitation, Science Advances, 12, eadv6891, https://doi.org/10.1126/sciadv.adv6891,
-
[49]
Zhang, B. and Merlis, T. M.: The Equilibrium Response of Atmospheric Machine-Learning Models to Uniform Sea Surface Temperature Warming, https://arxiv.org/abs/2510.02415,
-
[50]
Zhang, G., Rao, M., Yuval, J., and Zhao, M.: Advancing seasonal prediction of tropical cyclone activity with a hybrid AI-physics climate model, Environmental Research Letters, 20, 094 031, https://doi.org/10.1088/1748-9326/adf864, 2025a. Zhang, Q., Cheng, S., Liu, L., Zhang, L., Xu, J., She, D., and Yuan, Z.: Projections of climate change and its impacts ...
-
[51]
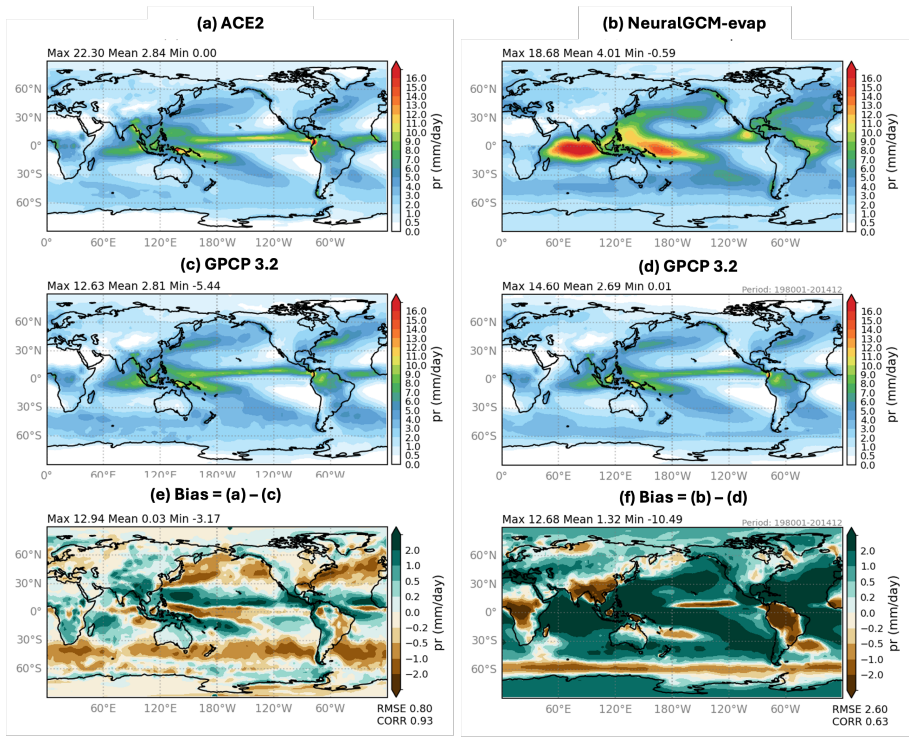
and (Lee et al., 2024). The climatology metric is computed with respect to the observed climatological fields provided by the reference dataset product corresponding to each examined variable as reported in Table
2024
-
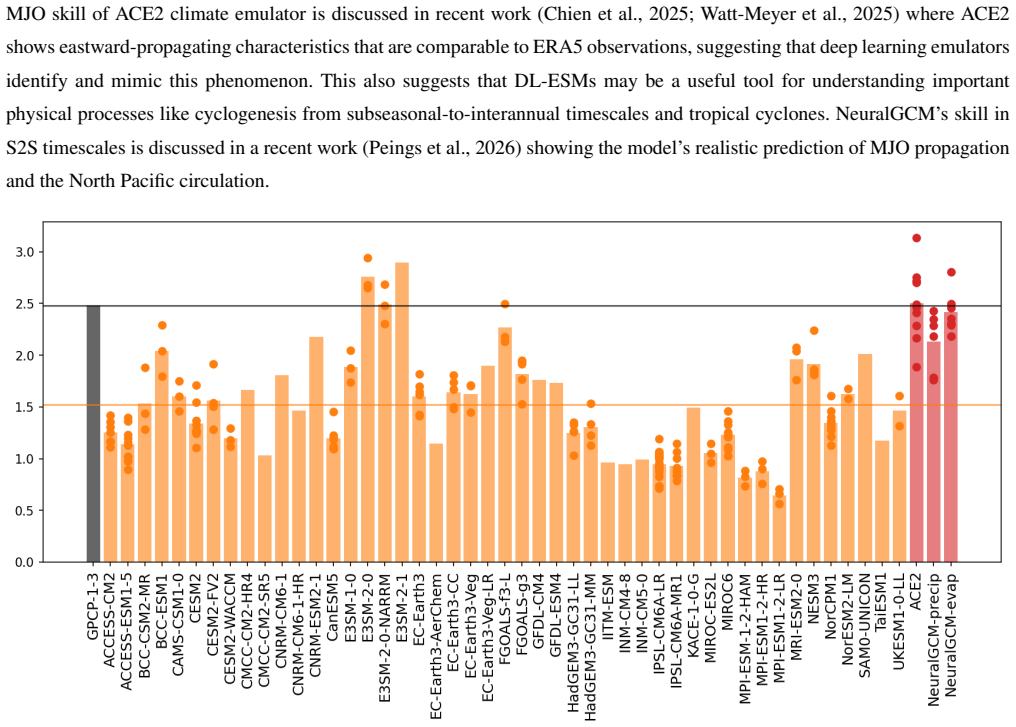
[52]
and (b) ACE2, (c) NeuralGCM-evap and (d) NeuralGCM-precip. The EWR is defined as the ratio of eastward power (as the average power in the dashed box on the right) to westward power (as the average power in the dashed box on the left) from the 2-dimensional wavenumber–frequency power spectra of daily 10°N-–10°S averaged precipitation in May to October (sha...
2001
-
[53]
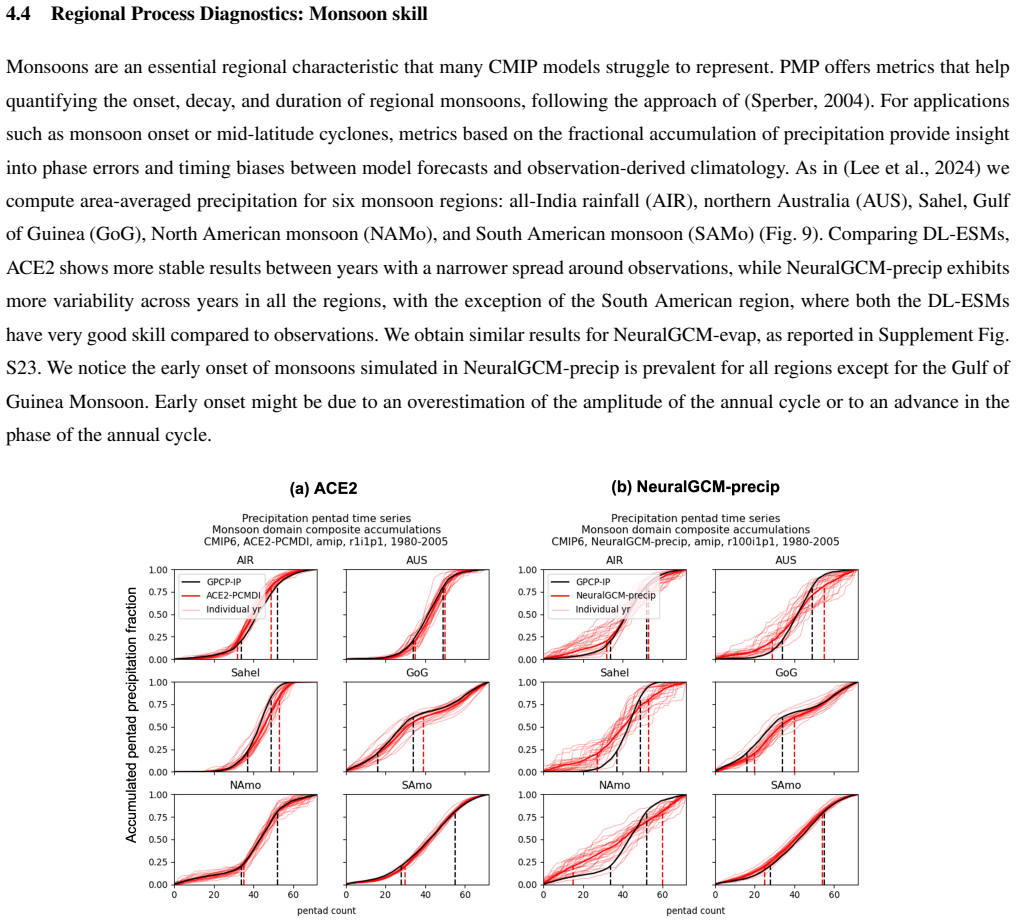
The monsoon metrics obtained from observation datasets (GPCP v1.3 and CMORPH v1.0; Joyce et al
45 Figure S23.Comparing the precipitation pentads between model and observations in NeuralGCM-evap. The monsoon metrics obtained from observation datasets (GPCP v1.3 and CMORPH v1.0; Joyce et al. (2004); Xie et al. (2017) and Historical simulation conducted via (a) ACE2 and (b) NeuralGCM-precip. For each model, we analyzed results for six monsoon regions:...
2004
discussion (0)
Sign in with ORCID, Apple, or X to comment. Anyone can read and Pith papers without signing in.